

hapabapa/iStock Editorial via Getty Images
Bristol-Myers Squibb (NYSE:BMY) has sold off in the last two months, with the share prices down 12% from the 12-month high closing price of $79.98 on June 27th. BMY’s trailing 3-month total return is -8.2% vs. -7.1% for the iShares U.S. Pharmaceuticals ETF (IHE), and -2.2% for the S&P 500 (SPY). BMY has recently had setbacks in trials for a blood thinner, but has also reported positive results in ongoing trials for a multiple myeloma treatment. The company also recently completed its acquisition of Turning Point Therapeutics, adding to BMY’s oncology lines.
Seeking Alpha
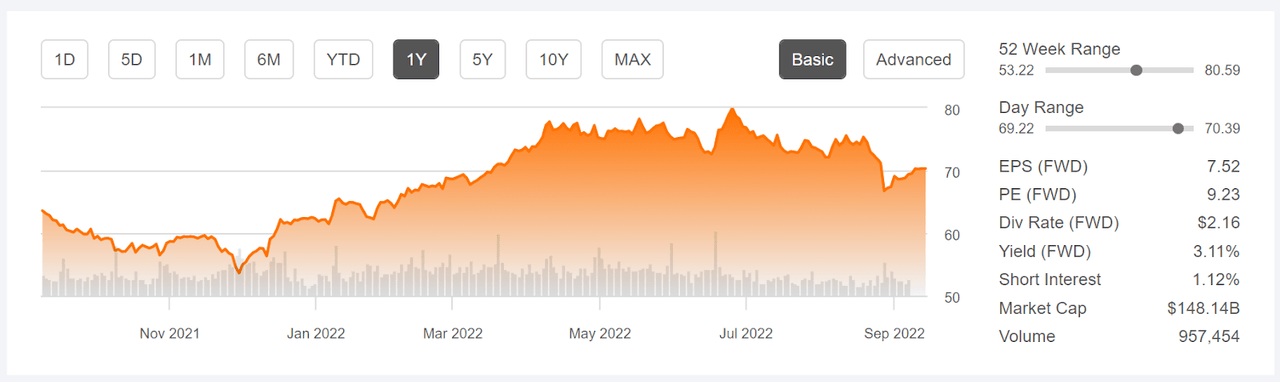
12-Month price history and basic statistics for BMY (Source: Seeking Alpha)
BMY reported Q2 results on July 27th, beating expectations on earnings and revenue. Total sales were up 2% YoY. The outlook for earnings growth is fairly muted, with a consensus outlook for EPS growth over the next 3 to 5 years at 4.6% per year. This low expected growth is likely to constrain investor enthusiasm.
ETrade
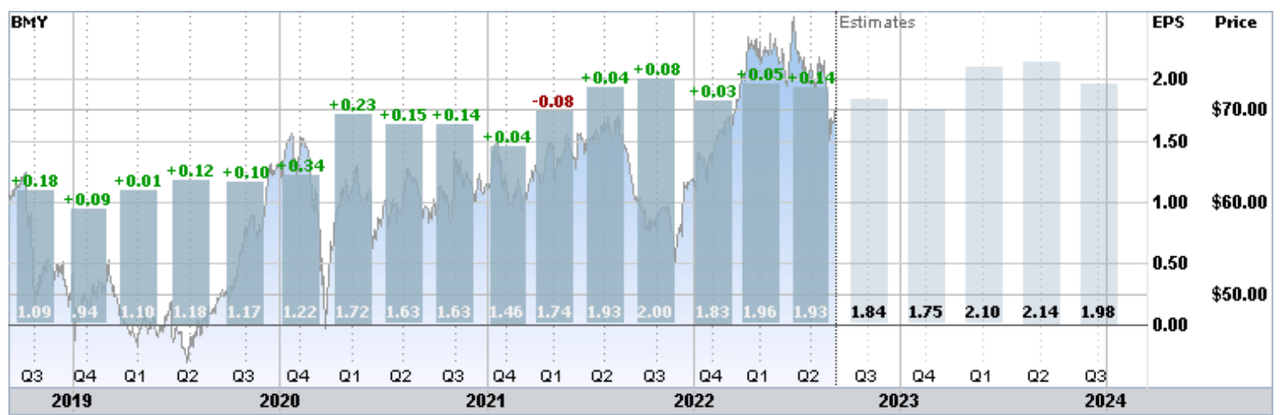
Historical (4 years) and estimated future quarterly EPS for BMY. Green (red) values are amounts by which quarterly EPS beat (missed) the consensus expected value (Source: ETrade)
BMY has a forward dividend yield of 3.1% and 3-, 5-, and 10-year annualized dividend growth rates of 9.0%, 6.4%, and 4.6%, respectively. Even with the rising dividend growth rate, the payout ratio is reasonable, at 27%.
I last wrote about BMY on February 8, 2022, at which time I maintained a hold rating. BMY had reported Q4 2021 results on February 4th, slightly beating expectations for earnings. The valuation was quite low relative to current earnings, but this is typically the case for drug companies. The Wall Street consensus rating for BMY was a buy, but the consensus 12-month price target was about 6% above the share price at that time, for an expected total return of 9.5%. Along with looking at fundamentals and the Wall Street consensus, I also consider the outlook implied by the prices of call and put options on a stock, the market-implied outlook. The market-implied outlook to the middle of June was slightly bullish, but the market-implied outlook to the middle of January of 2023 was slightly bearish. Since this post, BMY has returned a total of 8.2% vs. -9.2% for the S&P 500 (SPY).
It may be a coincidence, but I am intrigued by the fact that the market-implied outlook was bullish to the middle of June (June 17th was the expiration date for the options used for this outlook) and the return from the close on February 8th to the close on June 17th was 12.8%. The shares hit a 12-month high close of $79.98 on June 27th and have subsequently declined. It is always a bit tricky to assign a single overall rating when the near-term and longer-term market-implied outlooks are different.
For readers who are unfamiliar with the market-implied outlook, a brief explanation is needed. The price of an option on a stock is largely determined by the market’s consensus estimate of the probability that the stock price will rise above (call option) or fall below (put option) a specific level (the option strike price) between now and when the option expires. By analyzing the prices of call and put options at a range of strike prices, all with the same expiration date, it is possible to calculate a probabilistic price forecast that reconciles the options prices. This is the market-implied outlook. For a deeper explanation and background, I recommend this monograph published by the CFA Institute.
With seven months since my last analysis, I have calculated updated market-implied outlooks for BMY and I have compared these with the current Wall Street consensus outlook in revisiting my rating.
Wall Street Consensus Outlook for BMY
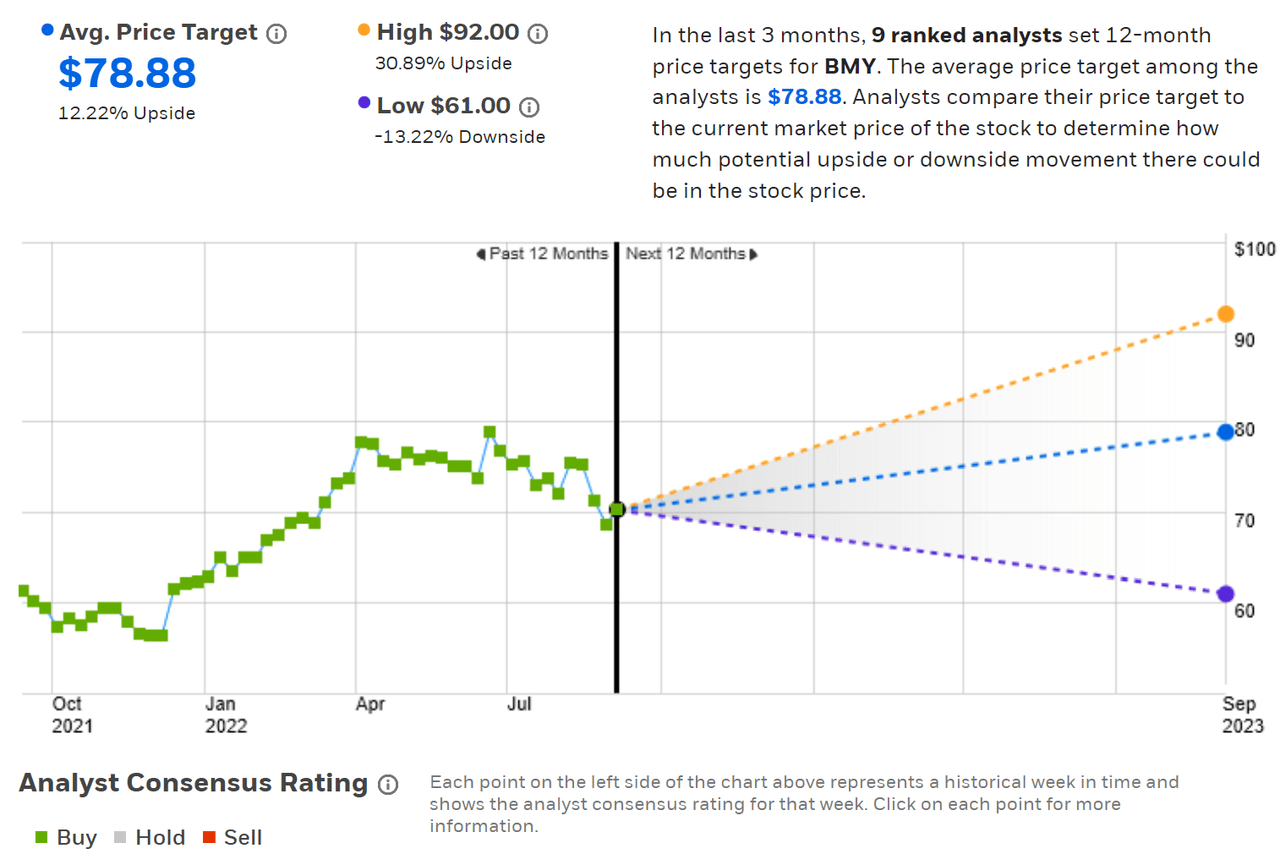
ETrade calculates the Wall Street consensus outlook for BMY using price targets and ratings from nine ranked analysts who have published opinions over the past three months. The consensus rating is a buy and the consensus 12-month price target is $78.88, 12.2% above the current share price. Back in February, the consensus rating was also a buy, but the 12-month price target was $68.00, which was 2.8% above the share price at that time. The prevailing view on BMY has improved considerably over the past seven months, with the consensus price target rising by 16%.
ETrade
Wall Street analyst consensus rating and 12-month price target for BMY (Source: ETrade)
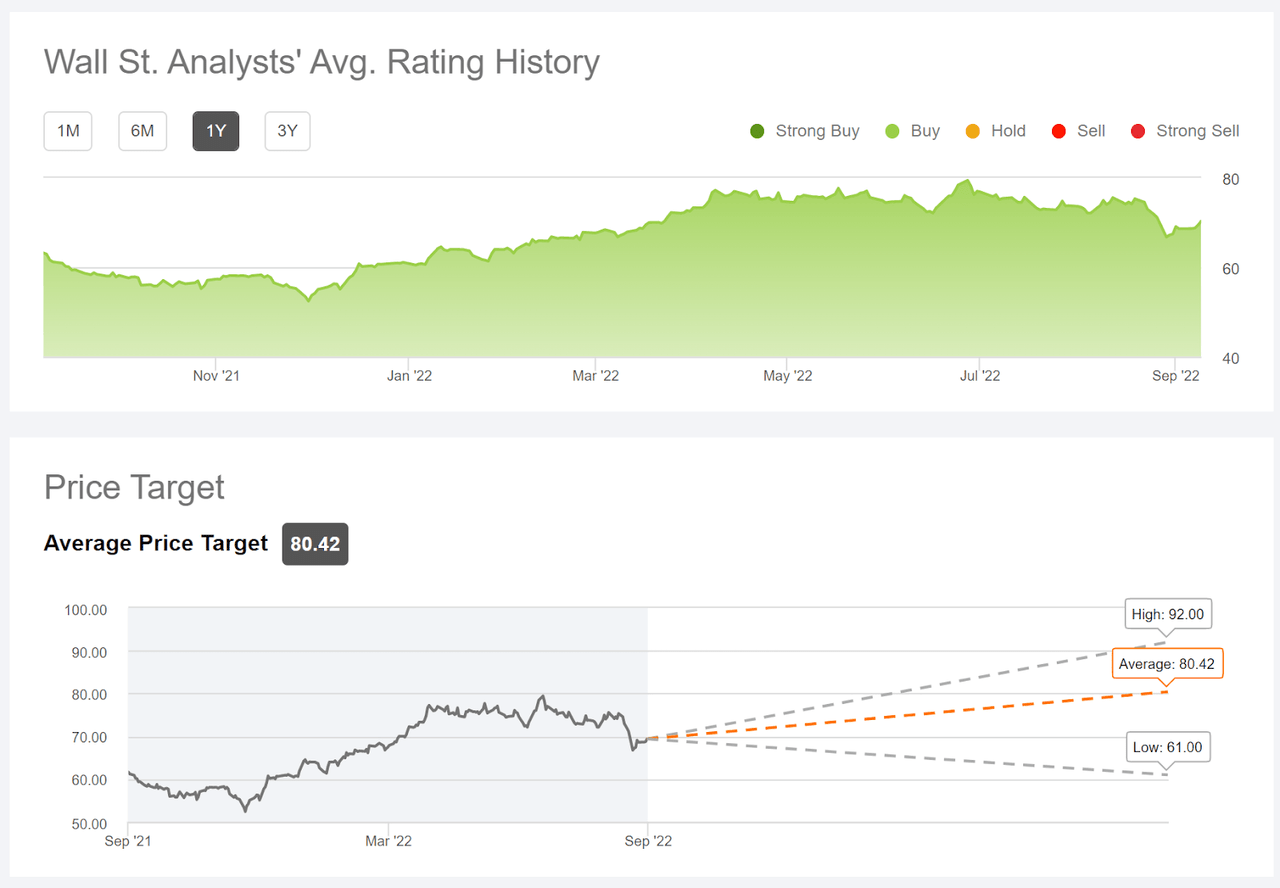
Seeking Alpha’s version of the Wall Street consensus outlook is calculated using ratings and price targets issued by 22 analysts over the past 90 days. The consensus rating is a buy and the consensus 12-month price target is $80.42, 14.4% above the current share price.
Seeking Alpha
Wall Street analyst consensus rating and 12-month price target for BMY (Source: Seeking Alpha)
The Wall Street consensus rating on BMY continues to be bullish, as it has been for all of the past year. The consensus 12-month price target has risen considerably in recent months, with an expected total return (including the 3.1% dividend yield) of 16.4% over the next year (I averaged the ETrade and Seeking Alpha consensus price targets).
Market-Implied Outlook for BMY
I have calculated the market-implied outlook for BMY for the 4.4-month period from now until January 20, 2023 and for the 9.2-month period from now until June 16, 2023, using the prices of call and put options that expire on each of these dates. I selected these specific expiration dates to provide a view to the start of 2023 and to the middle of the year, as well as because the options expiring in January and June tend to be among the most liquid.
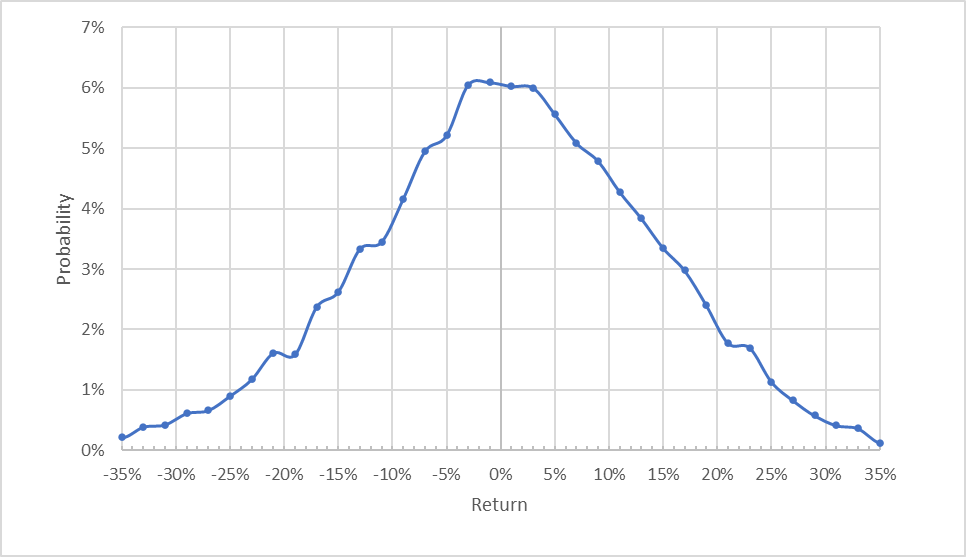
The standard presentation of the market-implied outlook is a probability distribution of price return, with probability on the vertical axis and return on the horizontal.
Geoff Considine
Market-implied price return probabilities for BMY for the 4.4-month period from now until January 20, 2023 (Source: Author’s calculations using options quotes from ETrade)
The outlook to mid-January of 2023 is centered at 0% return, but there is clearly a shift in the probabilities to favor positive returns. Compare, for example, the probability of having a +10% return to the probability of having a -10% return. The expected volatility calculated from this distribution is quite low, at 26% (annualized), and consistent with the value back in February (expected volatility for the options expiring on January 20, 2023 was 26%).
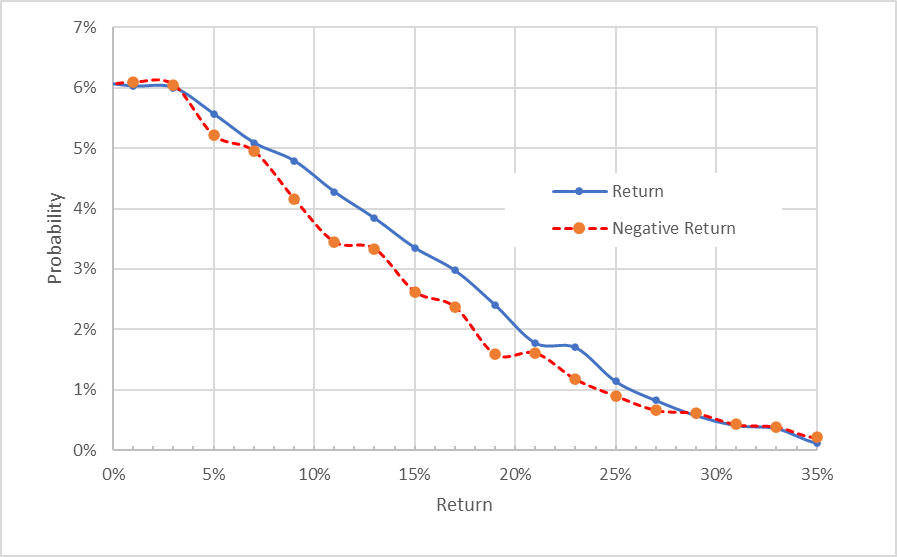
To make it easier to compare the relative probabilities of positive and negative returns, I rotate the negative return side of the distribution about the vertical axis (see chart below).
Geoff Considine
Market-implied price return probabilities for BMY for the 4.4-month period from now until January 20, 2023. The negative return side of the distribution has been rotated about the vertical axis (Source: Author’s calculations using options quotes from ETrade)
This view makes it much easier to compare the relative probabilities of positive and negative returns. The probabilities of positive returns are consistently higher than for negative returns of the same size, across almost the entire range of possible outcomes (the solid blue line is above the dashed red line over most of the chart above). This is a bullish outlook to January 20, 2023.
Theory indicates that the market-implied outlook is expected to have a negative bias because investors, in aggregate, are risk averse and thus tend to pay more than fair value for downside protection. There is no way to measure the magnitude of this bias, or whether it is even present, however. The expectation of a negative bias reinforces the bullish interpretation of this outlook.
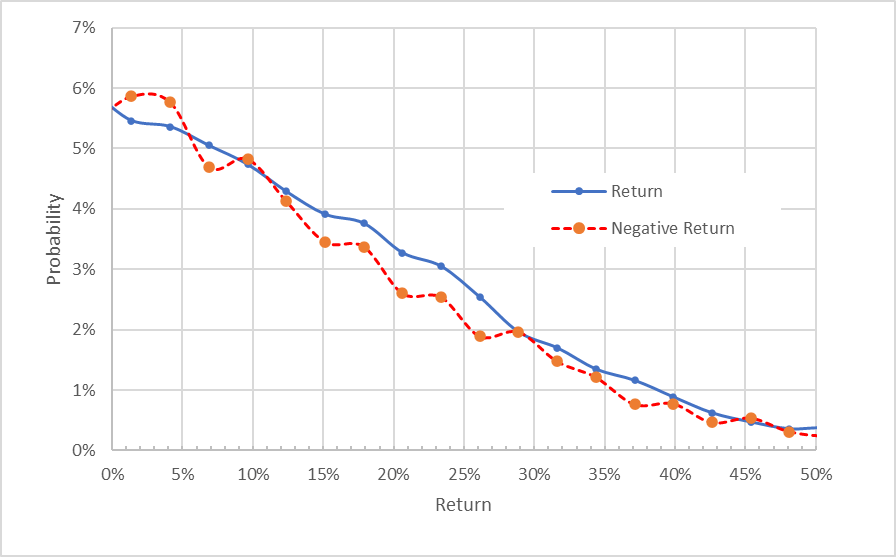
The market-implied outlook for BMY for the 9.2-month period from now until June 16, 2023 has a less pronounced shift in probabilities to favor positive returns. I interpret this outlook as slightly bullish, with additional confidence because of the theoretical negative bias. The expected volatility calculated from this distribution is 26% (annualized).
Geoff Considine
Market-implied price return probabilities for BMY for the 9.2-month period from now until June 16, 2023. The negative return side of the distribution has been rotated about the vertical axis (Source: Author’s calculations using options quotes from ETrade)
The market-implied outlook for BMY has become more favorable over the past seven months. The outlook to mid-January of 2023 is bullish and the outlook to the middle of 2023 is slightly bullish. The expected volatility is stable and quite low, at 26%.
Summary
Outlooks for drug companies are always difficult because of the complexity of these firms’ product pipelines and the inherent unpredictability of drug trials. In terms of observed results, BMY has managed to deliver stable earnings growth in recent years, even without the kind of windfall earnings at companies with commercial COVID treatments. The Wall Street consensus rating for BMY continues to be a buy, and the consensus 12-month price target has risen substantially in the past seven months, currently implying a 12-month total return of 16.4% over the next year. As a rule of thumb for an attractive return vs. risk, I look for expected return that is at least ½ the expected volatility (26% from the market-implied outlook). BMY exceeds this threshold. The market-implied outlook for BMY has gotten more bullish since my last analysis. The outlook is bullish to January 20, 2023 and slightly bullish to June 16, 2023. I am changing my rating on BMY from a hold to a buy.
Be the first to comment