

Dow, S&P 500, Nasdaq 100 Talking Points:
Stocks are getting hammered this morning as Russia has crossed the line on an Ukrainian invasion. We’ve already written quite a bit on the topic at DailyFX: In this article I want to look at U.S. equities and the possible scenarios to work with.
Of consideration – tomorrow brings PCE data out of the United States. Rate hike odds are in limbo at the moment but if tomorrow’s inflation print comes out hot again, we could have another worry to incorporate. And given that this data is printing on a Friday morning, with a scenario that’s shown a tendency to develop over the weekend when markets are closed, there could be a very risky backdrop to look at for tomorrow as investors and traders look at dumping risk ahead of the weekend for fear of what may happen when markets are closed and they cannot manage their positions.
So that inflation print tomorrow is very important, even with everything else that’s going on.
The fundamental outlook could oddly get a boost from this ordeal, provided that it doesn’t get too out of hand, and that draws right back to rate hike expectations in the U.S. economy. The major stumbling block for stocks this year has been quickly rising expectations for the Fed to hike as many as six or seven times. But, with a fresh risk hitting the backdrop that’ll likely carry some reverberations in key markets such as oil, there’s much more that’s up in the air at the moment, and this could possibly compel the Fed to be less hawkish and aggressive, provided that inflation doesn’t print with another massive beat tomorrow.
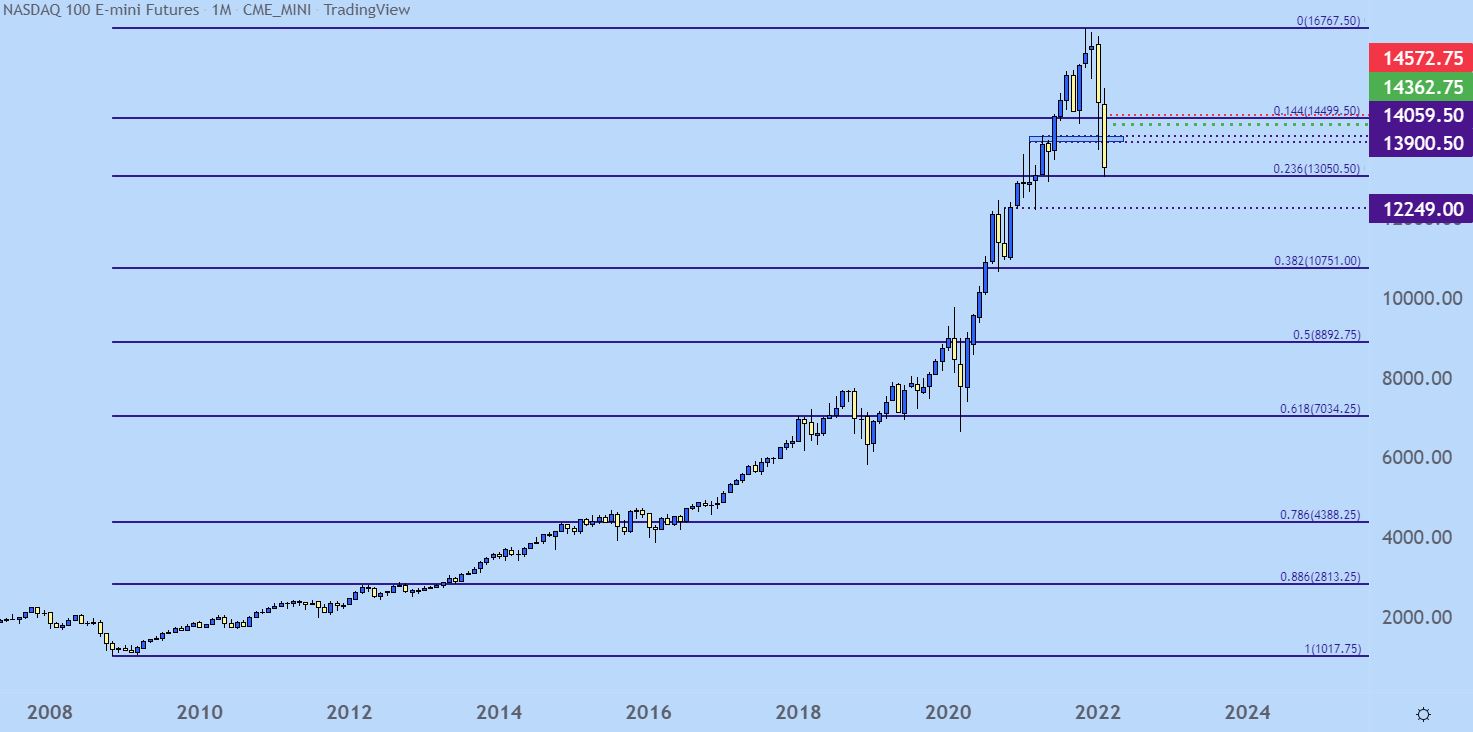
On the equity front, this morning marks the official ‘bear market’ indication for the Nasdaq 100. The index was down -19% from the highs yesterday and with this morning’s gap-down, that hit grew to more than -22% from the highs.
At this point, the Nasdaq 100 is testing the 23.6% retracement of the 2008-2021 major move, essentially accounting for the entire Fed-fueled run that began more than a decade ago. That level is at 13,050, and was last in-play in May of 2021, helping to set support.
Nasdaq 100 Monthly Price Chart
Chart prepared by James Stanley; Nasdaq 100 on Tradingview
Nasdaq 100 Shorter-Term
For short-term resistance levels, there’s potential at 13,287, 13,599 and 13,712. Given how oversold this move has become, there’s potential for a pullback as a combination of short-covering and bottom-fishing bring some buying pressure into the market.
However, there’s also liquidation risk after a move of this magnitude, as there may be some forced selling that could bring even more pressure into the situation. So, perhaps even more so than usual, caution is warranted.
Nasdaq 100 Four-Hour Price Chart
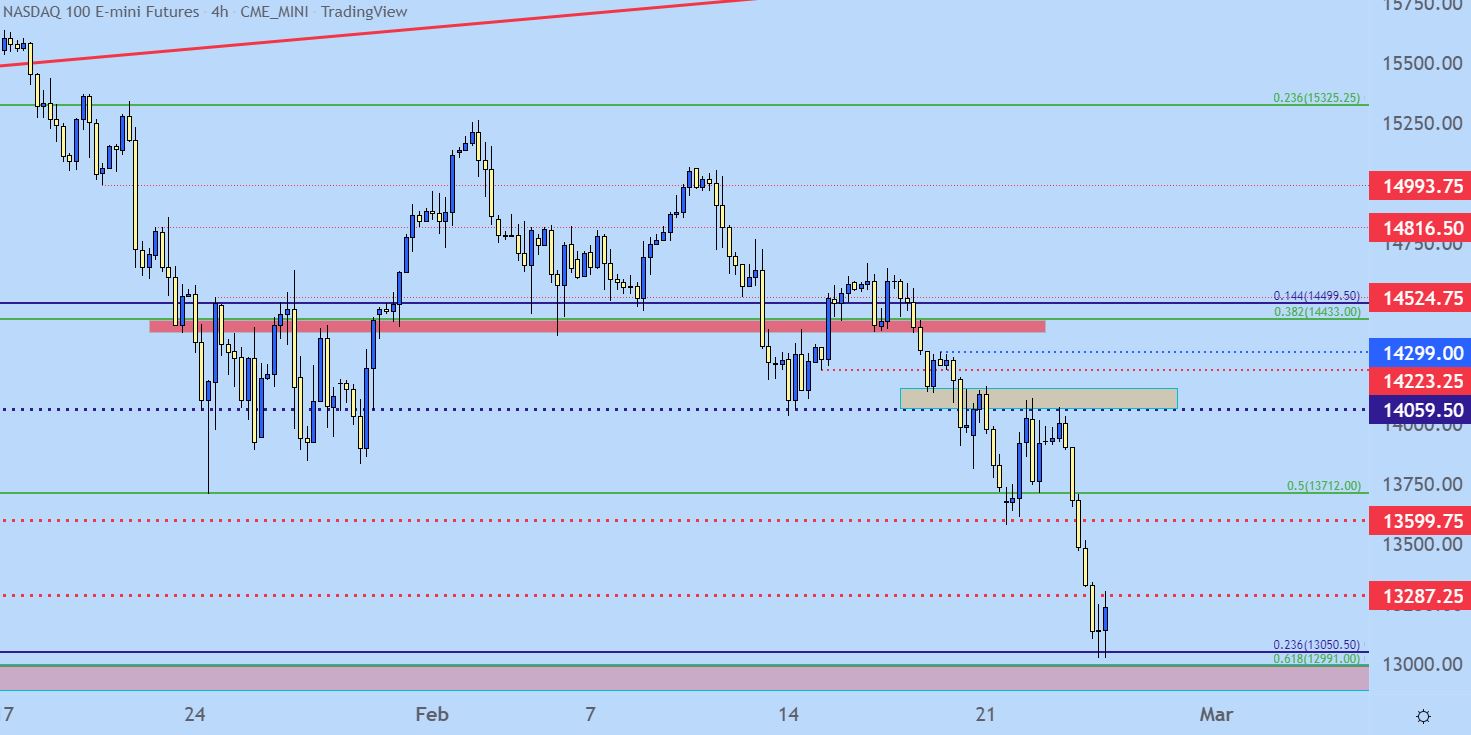
Chart prepared by James Stanley; Nasdaq 100 on Tradingview
S&P 500
The S&P 500 is currently testing support at the 23.6% Fibonacci retracement of the 2014-2022 major move. This plots at around 4100 and the major psychological level below that, at the 4k handle, showed some peculiarity when it came into the equation last year.
After the reflation trade roiled markets in Q1 of last year, tensions soothed around the Q2 open and the S&P 500 finally broke-above the psychological level for the first time ever – and it didn’t stop or even slow down. Prices didn’t even check back for support at the big figure, which is rather odd. But – it may soon come into play on the under-side of price action.
S&P 500 Monthly Price Chart
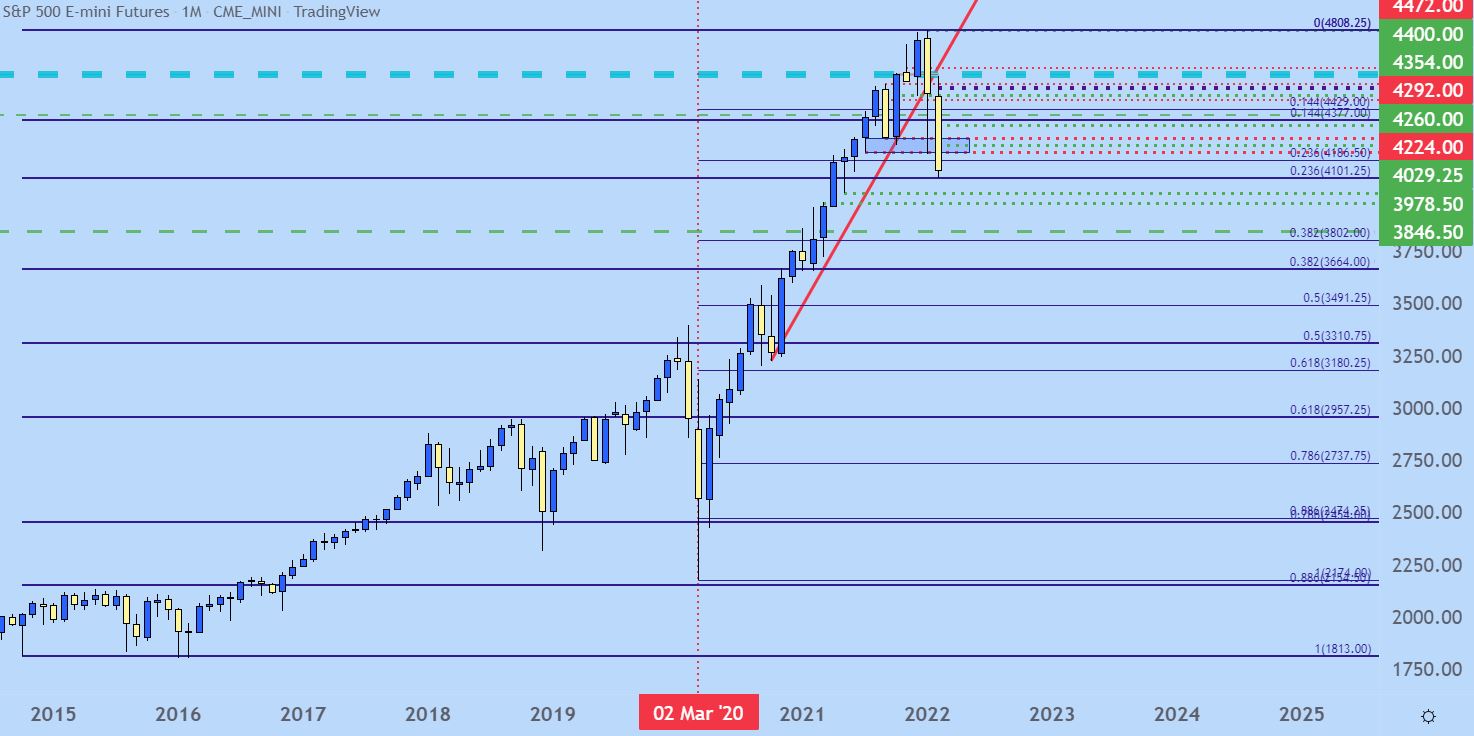
Chart prepared by James Stanley; S&P 500 on Tradingview
SPX Short-Term Levels
For resistance potential, 4164, 4186, 4224 and the familiar 4260 level all remain relevant. Given the less intense sell-off than what’s shown in the Nasdaq, the S&P may be a bit more attractive for bounce or pullback themes at the moment.
S&P 500 Four-Hour Price Chart
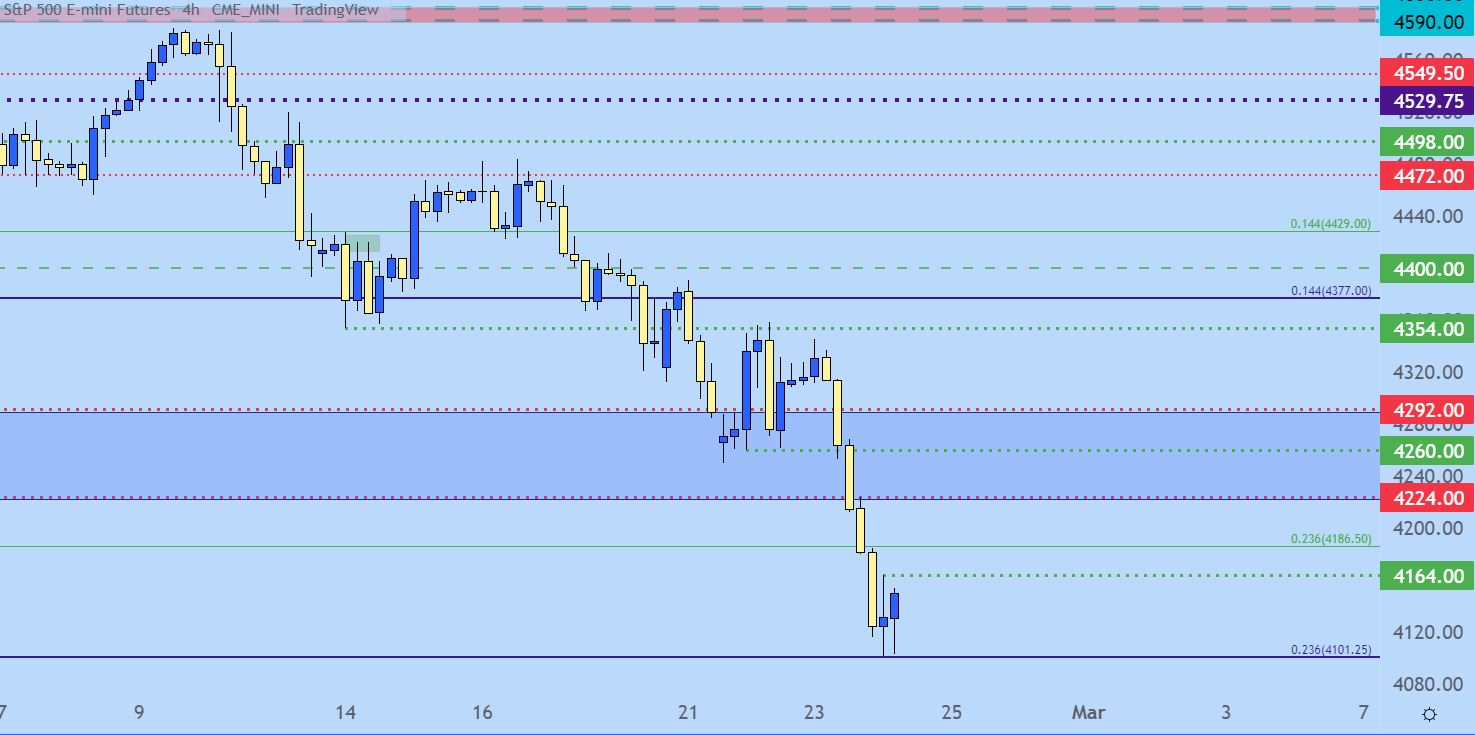
Chart prepared by James Stanley; S&P 500 on Tradingview
Dow Down to Support
The Dow is now testing the 14.4% retracement of the post-Financial Collapse run, and that level is confluent with the 23.6% retracement of the post-pandemic major move.
This is a confluent level right around the 32,500 psychological level. A hold here today can keep the door open for a bounce.
Dow Monthly Price Chart
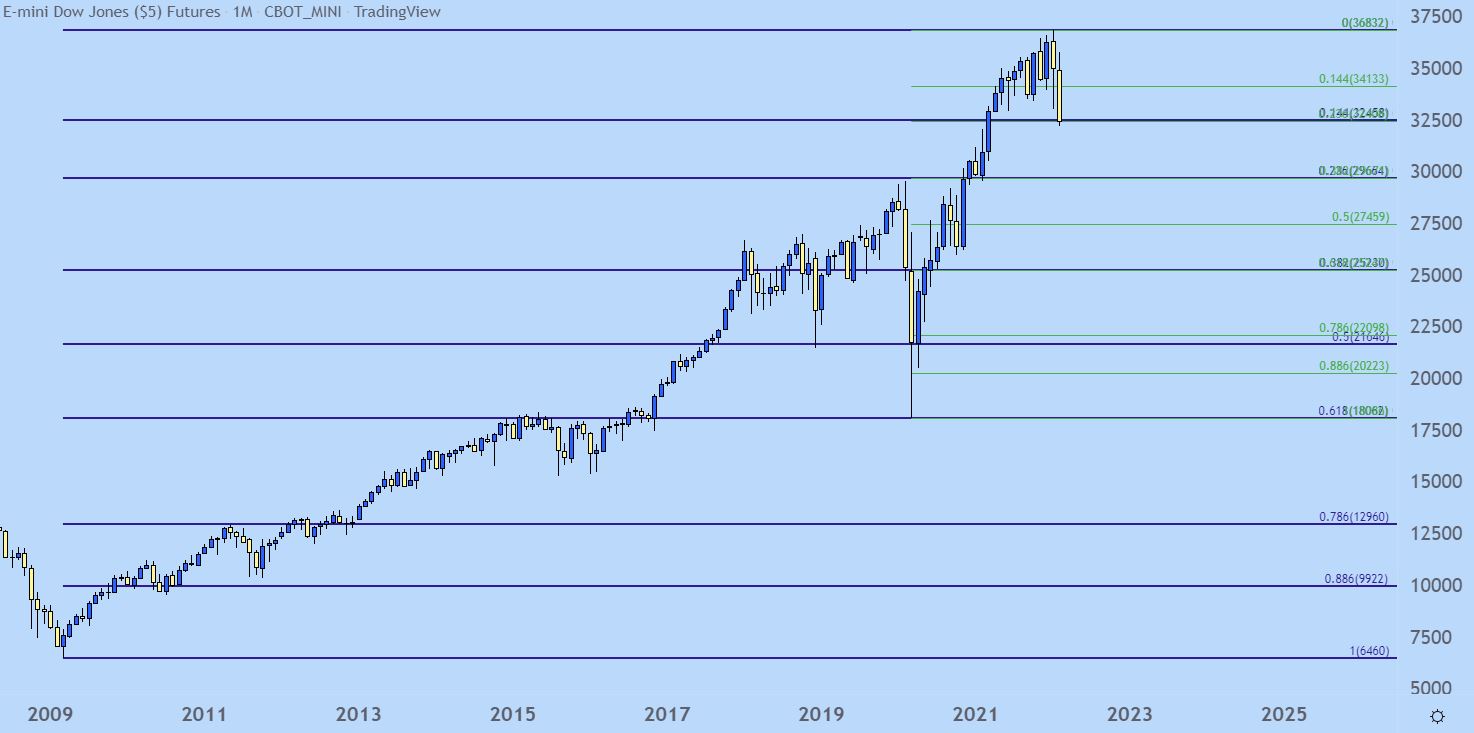
Chart prepared by James Stanley; Dow Jones on Tradingview
— Written by James Stanley, Senior Strategist for DailyFX.com
Contact and follow James on Twitter: @JStanleyFX
Be the first to comment