

PeopleImages/iStock via Getty Images
One of the most interesting specialty chemical companies on the market today is a firm called Stepan Company (NYSE:SCL). This producer of surfactants, polymers, and other specialty products such as those used in food and flavoring, is a small company with a market capitalization of about $2.22 billion as of this writing. Fundamental performance in prior years had been somewhat mixed on the top line but profits and cash flows have generally trended higher year after year. Despite shares of the company trading at fairly attractive levels and despite some rather strong performance throughout its 2021 fiscal year, shares of the enterprise have been beaten down by the market. Though this may cause some investors concern, value-oriented investors might want to take this opportunity to consider buying up more of the firm’s stock.
A look at recent developments
In mid-January of this year, I wrote an article detailing the positives and negatives associated with Stepan Company. At that time, I stressed the company’s bumpy past, particularly the fact that revenue had been declining since its 2018 fiscal year. I said that, relative to similar firms in the space, shares of the business were likely fairly valued, but that on an absolute basis, shares were priced on the cheap side of the spectrum. At the end of the day, my findings lead me to rate the company a ‘buy’ prospect. But since then, the market has disagreed. While the S&P 500 is down 2.9% since my last publication on the business, shares of Stepan Company have posted a decline of 17.9%.
Author – SEC EDGAR Data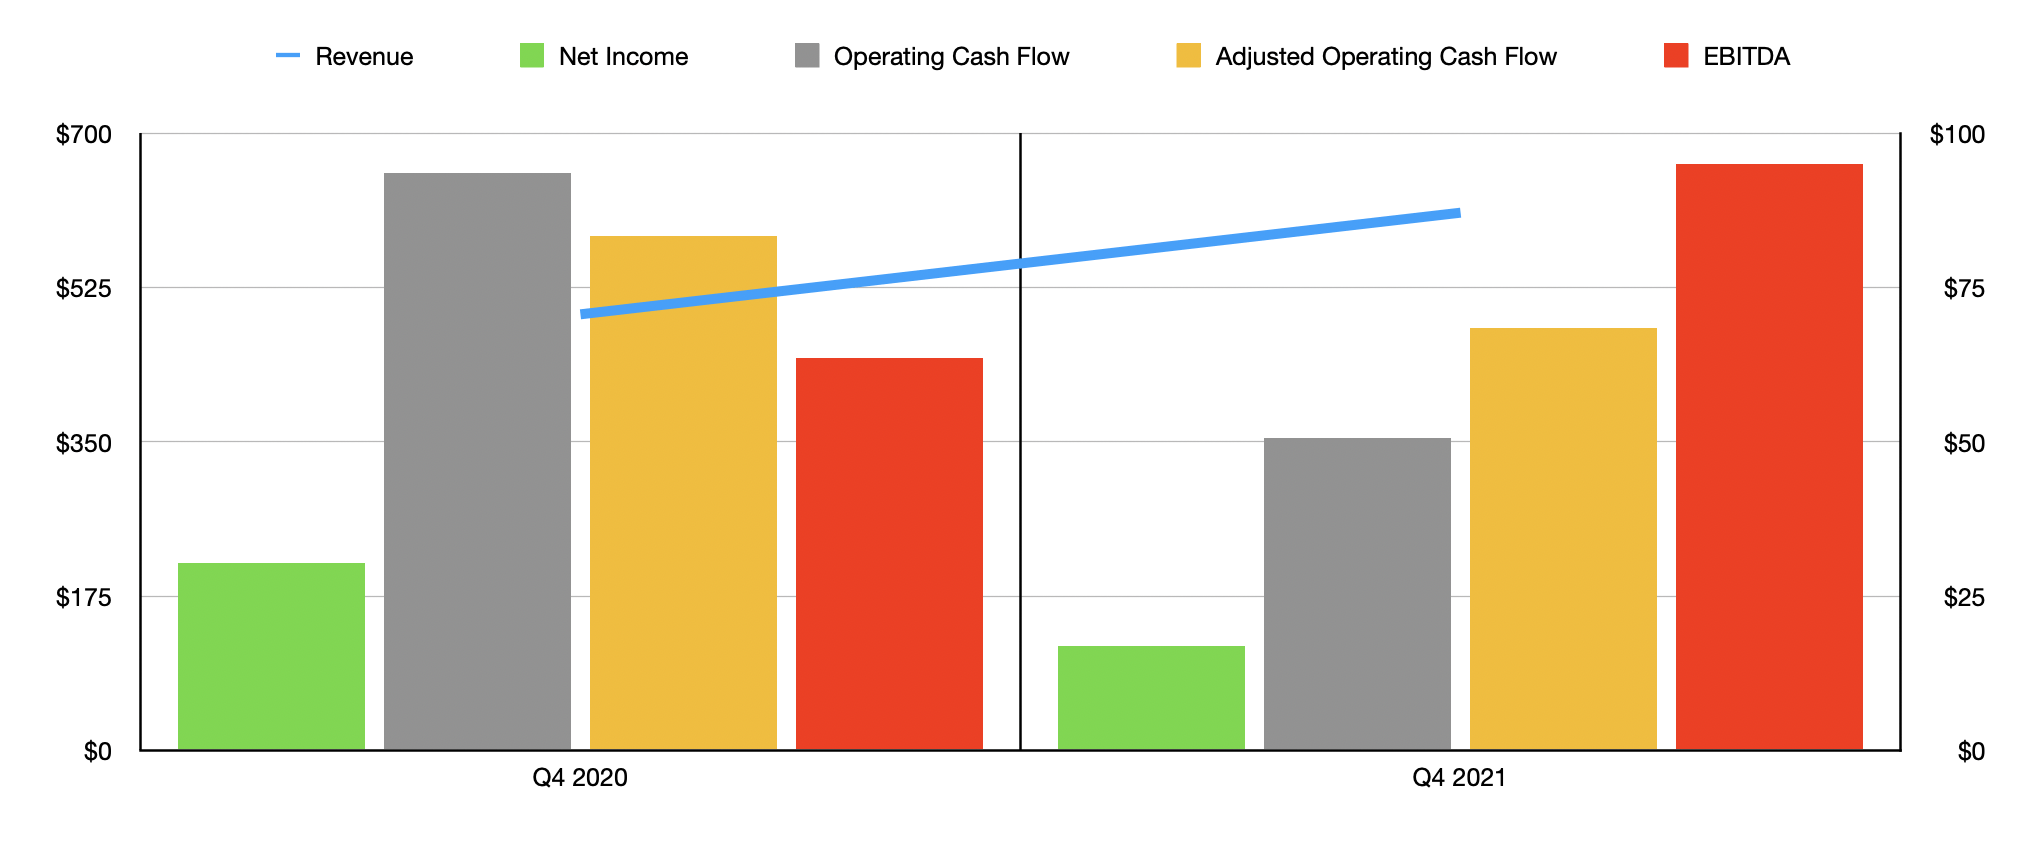
Such a stark disparity in returns might make investors think that the fundamental performance of the business has been depressing. This would not be an entirely fair characterization. But it is true that the company has experienced some pressure in some ways. Where the company has done well has been in the form of revenue generation. During the final quarter of its 2021 fiscal year, the only quarter for which data is now available that was not available as of my last writing, the business reported sales of $610 million. That represents an increase of 23.3% over the $494.7 million the company generated the same time one year earlier. This increase in sales was not just a one-time event. In fact, the company did quite well on its top line for the entirety of the 2021 fiscal year. For that timeframe, sales for the company came in at $2.35 billion. That is 25.5% higher than the $1.87 billion reported for its 2020 fiscal year. And it’s 17.7% higher than the company’s peak year of $1.99 billion.
A small driver of this increase in sales was a 2% rise in sales volume for the company. This added on $36.6 million to the company’s revenue increase of $476.2 million for the year. It is worth mentioning that sales volume changes were not broad-based. The company actually saw a 6% decline in volume associated with surfactant products. Meanwhile, volumes for polymer and specialty products were up by 29% and 6%, respectively. The company also benefited from a $24.4 million increase associated with foreign currency translation. But the biggest contributor, by far, involved higher average selling prices that contributed $415.2 million in extra revenue for the year. Management attributed this increase in sales price largely to the passing through of higher raw material costs to its customers. But it also claimed that more favorable product and customer mix also helped its top line.
Author – SEC EDGAR Data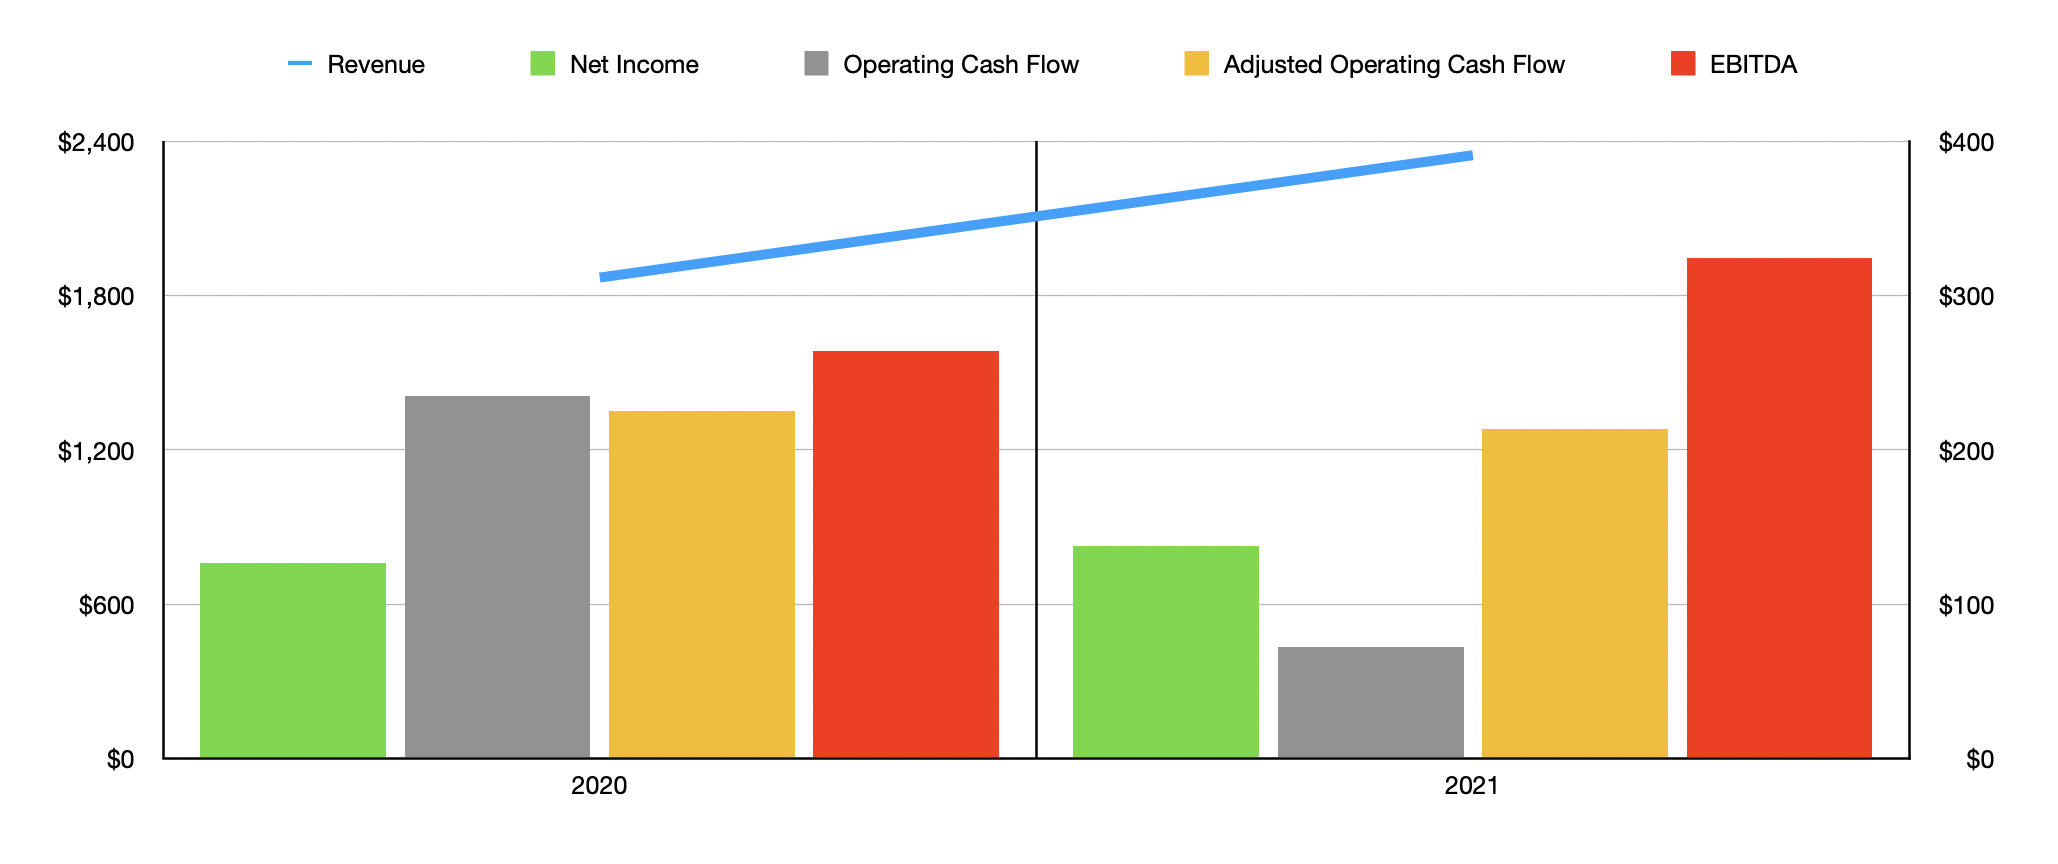
Despite the ability to pass on a lot of its costs to its customers, the company did experience some downward pressure on its bottom line. For the final quarter of the year, for instance, net income came in at $17 million. That’s nearly half the $30.4 million generated one year earlier. Total net profits for the year, however, still came in strong at $137.8 million. That’s up 8.7% over the $126.8 million generated in 2020. Other profitability metrics followed a similar path. Operating cash flow in the final quarter dropped from $93.5 million to $50.7 million. If we adjust for changes in working capital, it would have declined from $83.3 million to $68.5 million. The only profitability metric to improve year over year in the final quarter was EBITDA. This rose from $63.6 million to $95.1 million. For the entirety of the year, operating cash flow is just $72.1 million. That compares to the $235.2 million reported one year earlier. But if we adjust for changes in working capital, it would have totaled $213.6 million. Meanwhile, EBITDA for the company actually increased, rising from $264.4 million in 2020 to $324.3 million last year.
Author – SEC EDGAR Data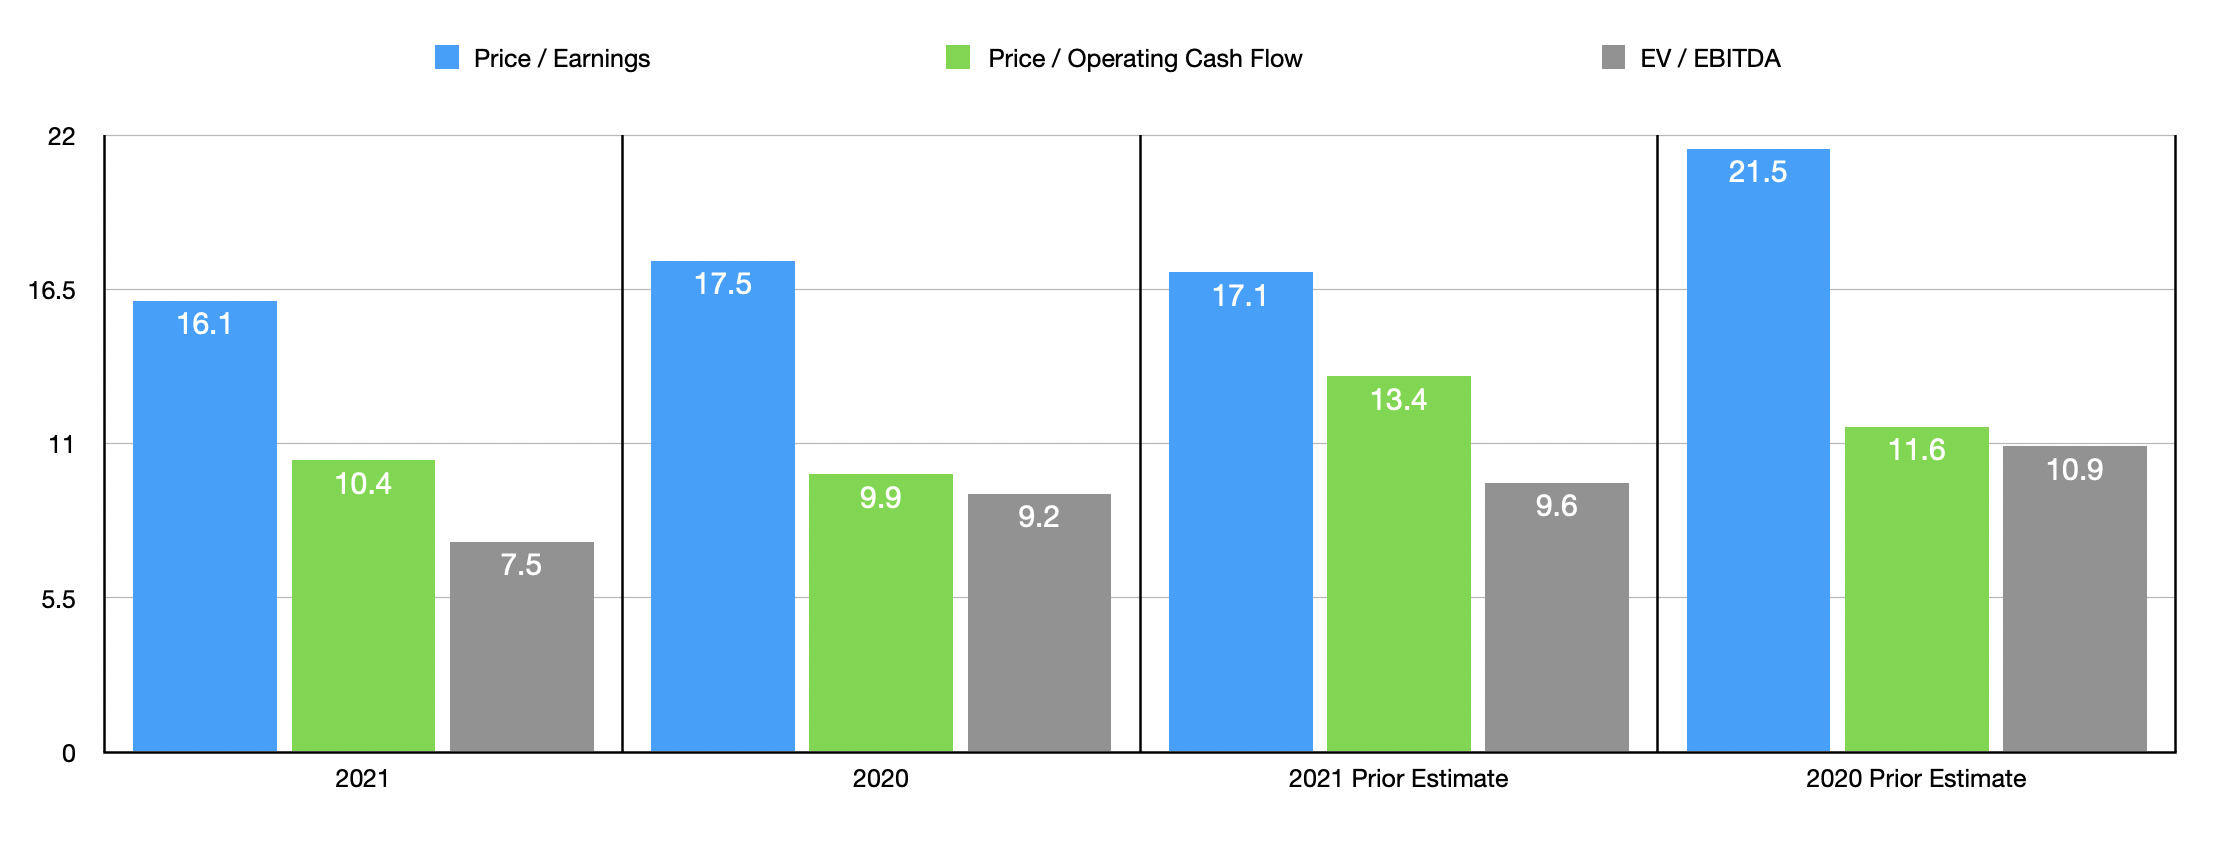
Management has not provided any real guidance for the 2022 fiscal year. So using the data from both 2020 and 2021, we can attempt to price the business as it stands today. On a price-to-earnings basis, using our 2021 results, the company is trading at a multiple of 16.1. This compares to the 17.5 reading that we get if we rely on 2020 figures. Our 2021 results also translate to a price to adjusted operating cash flow multiple of 10.4. By comparison, the reading for 2020 would be 9.9. And finally, we arrive at the EV to EBITDA approach. Our 2021 results give us a multiple of 7.5. This stacks up against the 9.2 reading that we get if we rely on 2020 figures. In the table above, you can see how, for both the 2020 and 2021 fiscal years, shares have gotten even more affordable than they were when I last wrote about the business earlier this year.
As part of my analysis, I decided to compare Stepan Company to the same five firms I compared it to in my prior article. On a price-to-earnings basis, these companies ranged from a low of 8.5 to a high of 197.1. In this case, one of the five companies was cheaper than Stepan Company. Using the price to operating cash flow approach, the range was from 9.2 to 71.3. Three of the five businesses were cheaper than our prospect. And finally, using the EV to EBITDA approach, the range was from 5.2 to 60. One of the five firms was cheaper than our prospect in this scenario.
| Company | Price / Earnings | Price / Operating Cash Flow | EV / EBITDA |
| Stepan Company | 16.1 | 10.4 | 7.5 |
| Celanese Corporation (CE) | 8.5 | 9.2 | 7.0 |
| Flexible Solutions International (FSI) | 13.1 | 9.8 | 5.2 |
| Eastman Chemical Company (EMN) | 17.2 | 9.1 | 10.3 |
| Albemarle Corp (ALB) | 197.1 | 71.3 | 60.0 |
| Innospec Inc (IOSP) | 24.4 | 24.3 | 12.1 |
Takeaway
There is no denying the fact that Stepan Company is experiencing some investor pessimism. A big portion of this is likely attributable to the fact that the most recent quarter illustrated some significant margin pressure. Ultimately, the fear from investors is that this will continue on into subsequent quarters. Truth be told, there is no way to tell whether this would be the case or not. Ultimately, if the company cannot pass its higher costs onto customers, then margins could remain under pressure for an extended time frame. But for long-term investors, this shouldn’t be much of an issue. At some point, the picture will adjust. Either the company will succeed in transferring all of these excess costs onto customers or costs will come down. In a world where fundamental performance matches what the company has historically achieved, such as in the 2020 and 2021 fiscal years, shares might offer some attractive upside. Because of this, I would still rate the company a ‘buy’ prospect at this time.
Be the first to comment