

Olivier Le Moal/iStock via Getty Images
Gold has gone almost straight up from 1780 on January 28, when Ukraine tensions began in earnest, to just shy of a new record high at 2079 on Tuesday. Let’s look at the bullish and bearish case for Gold going forward.
Gold – Continuous Contract (NYSE:EOD) CME (StockChart)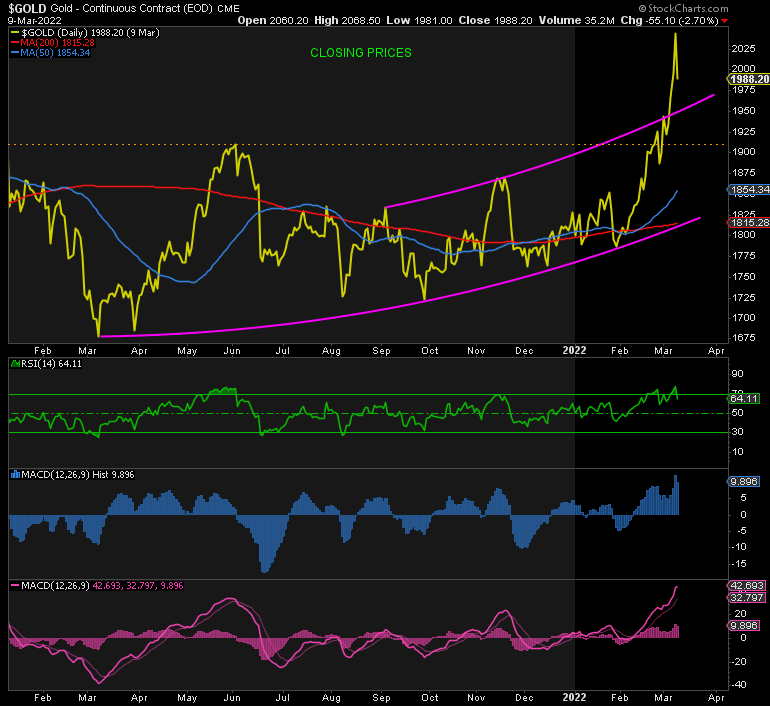
BEARISH
Gold is extreme overbought here. It reached a daily RSI peak of 80 on Tuesday. The MACDs hit their highest levels since the record high in August 2020. There is also little doubt that Gold is at its most bullish since that prior peak also.
Money Mgrs – Gold (Author)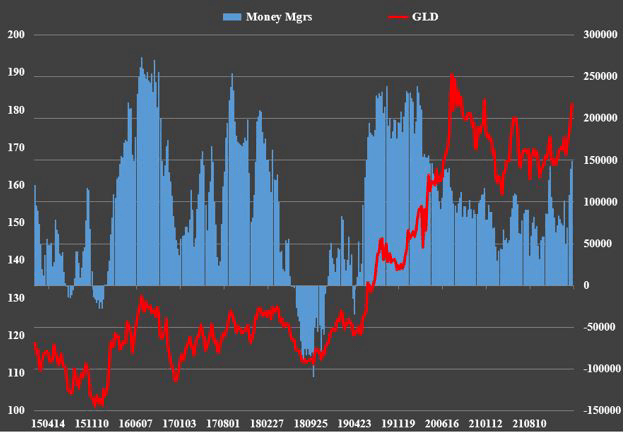
The COT positioning data as of Tuesday, March 1, nine days ago as I write, shows that Funds had their largest net long position since before the peak in August 2020. The March 1 close for Gold was 1944. Given that the price went even higher to 2079 on Tuesday, the probability is high that they piled on even more longs.
They also raced to add those longs at the fastest pace since June 2019, almost three years ago. This was on a three-week rolling basis. These guys are typically wrong at extremes, so this data is far from bullish. Quite the opposite.
Funds 3WD – Gold (Author)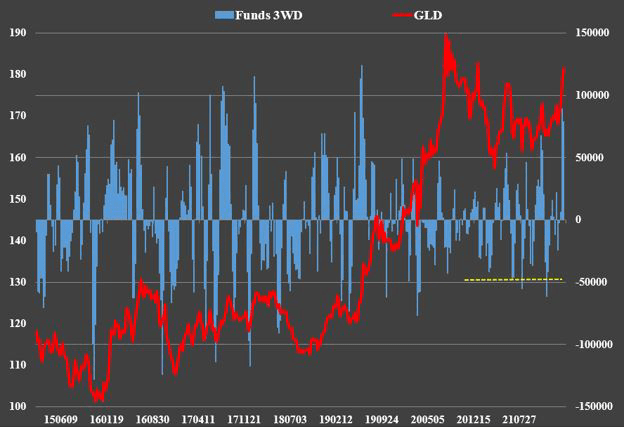
It should be no surprise that the Commercials raced to add shorts at the same rapid pace, and given the rise in price since March 1, they probably loaded up even more. These guys tend to be right at extremes.
Switching to fundamentals, we have been seeing signs of stress across asset classes in the market, courtesy of sanctions on both sides of the Ukraine situation. The spread between the overnight funding rate and the three-month interest rate blew out on Russia’s invasion of Ukraine to their highest level since March 2020. This is a sign of rising distrust between the banks. They’re increasingly concerned about counterparty risk. Why? Because many banks, especially Europeans, have debt exposures to Russian counterparts. What if they don’t get paid? U.S. banks are in turn exposed to European banks in the event that any of the latter run into trouble.
There is also stress in the commodity market. Producers use futures among other derivatives to lock in the price of their future sales. The problem is when the price of that commodity soars in the short-term, as we saw with multiple commodities like oil, nickel, and coal recently, those futures suffer steep losses that have to be covered by massive margin calls. This happened to Peabody recently. The issue is they need to pay the margin call today, but the proceeds from the sales don’t occur until months or years from now. This is a classic liquidity crunch. If the company has access to funding from relationship banks, this should not be a problem. But if they don’t, they risk bankruptcy. All of this contributed to Gold’s rise.
At the same time, inflation is soaring to its highest levels since 1982. The Fed is about to embark on a tightening cycle along with other global central banks while economic growth is sliding into recession.
The combination of economic recession, higher interest rates, and less liquidity are likely to lead to a deflationary shock soon. In such a scenario, precious metals and miners are likely to come under pressure along with everything else “in the short-term”.
All of this increases the odds of a significant pullback soon. In fact, Gold has the perfect set-up in place for a negatively divergent record high, whereby it hits a new record high in price but the lower high in the RSI and/or MACDs. Sure sounds like the perfect place for the Bullion Banks to drive prices lower when everyone else is maximum bullish.
BULLISH
This is a far simpler explanation. The trend is clearly up. At the same time, I believe confidence is fast eroding in the global financial and banking system, particularly in monetary policies and currencies. People are running to precious metals for both investment and insurance purposes.
We have been setting higher and higher lows since March 2021. What we lacked was the higher highs. That changed on February 18, when we broke the prior high of 1880. Then we took out the June 2021 peak of 1920 too. Now we’re testing the prior record highs at 2069 on a closing basis and the intra-day peak of 2089.
This upward trend must be respected until it’s broken. A new record high would signal that the trend is definitively up! But even though this would confirm the bull market and suggest higher highs are ahead, we might not see them in the short-term, for all of the reasons outlined above.
Gold could hit a negatively divergent higher high shortly and fall all the way down to 1780, where this latest rally started, without breaking the uptrend. That’s quite a fall!
If such a fall were to occur and it does break 1780, followed by a lower high anywhere below 2079-the current peak-then the risk is that 1675 will be broken next.
Now the probability of either of these outcomes is low at this point. A drop back below 1900 would be a warning sign. But as I said recently, unless that happens, the trend of higher lows and higher highs must be respected, and that trend is UP.
CONCLUSION
The trend in Gold is firmly higher. This does not rule out at least a short-term pullback from a negatively divergent higher high. In fact, this would help to ease the overbought and extreme bullish condition we’re currently seeing and create fuel for the next leg higher. Only a break of 1900 warrants caution, imho.
Editor’s Note: The summary bullets for this article were chosen by Seeking Alpha editors.
Be the first to comment