

SvetaZi/iStock via Getty Images
Investment Summary
From the Portfolio Manager’s Desk
June was another turbulent month for markets and equally as tough for equity strategies. Long only managers continue to get punished by their own mandates despite the market’s rewarding of fundamentals again.
The high-beta and growth trade has unwound itself leading to strengths in alternative premia, whilst macro-drivers continue to stretch up commodities over the past 3 months. The valuation spread historically enjoyed by low-beta strategies has returned in 2022, driven by a factor rotation out of growth. The value factor is again displaying positive risk premium over growth stocks since January of this year. The gap has narrowed but remains in situ, as seen below.
Exhibit 1.
S&P 500 Value (blue) vs. S&P 500 Growth (red) Jan-June FY22.
Valuation spread has returned for value strategies as Treasury yields push past 3%, factor rotation out of growth.
Data: Updata Analytics. Image: HB Insights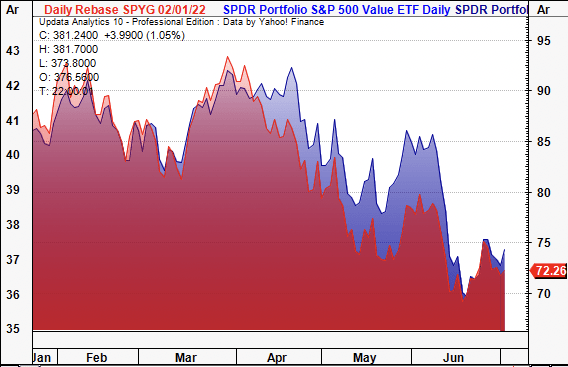
Meanwhile, talks of inflation continue to dominate the narrative. Whilst there’s good reason to fear the economic fallout, data shows trends might be reversing. Firstly, the US 5y forward inflation expectation rate is priced at 2.08% whereas the US 5y break-evens are at 2.6%. US TIPS have diverged from the long end of the curve starting at UST 20yr’s (Exhibit 3), suggesting market pundits aren’t pricing duration. Both Copper (Sep 22 expiry) and Brent Crude futures also appear to have peaked in March, with the former returning to its December 2020 levels at time of writing. Each are key indicators of industrial pricing activity, and there appears to be some macro divergence in current inflation prints and future expectations.
A significant drawdown in each of these metals signals a cooling of inflationary pressures into FY23, by estimation. With forward looking data pointing to lower pricing in key inflation indicators, questions then begin to arise on the length and strength of central bank tightening regimes. For equities – particularly medical technology (“medtech”) industry – this means the potential for a re-rating as the market continues its focus on long-term cash compounders.
Exhibit 2.
Copper and Brent Crude Futures trending down of March high’s, key indicators of industrial pricing activity
Image: HB Insights Data: Updata Analytics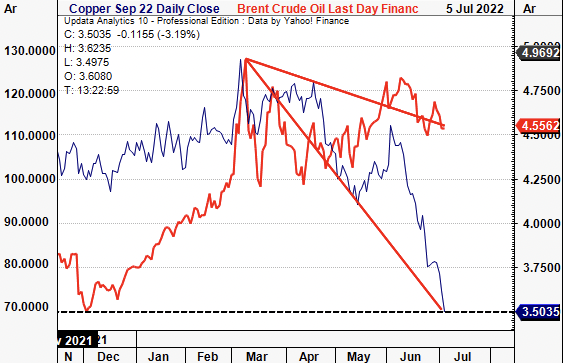
Moreover, the stock/bond correlation has been at the center of investment debate after the June roll-down. This was completely a rates-driven story, by estimation. Yields at the belly and long-end of the curve have curled up in 2022. However Treasuries have also faltered leading to a significant uptick in the correlation between the pair. This also looks to have peaked in the short-term and may have even reversed.
Long-bias ETFs tracking the longer-end of the curve have also curled up toward the end of June. Both US TIPS and US 20+ Year Treasuries appear to have wound back up towards May levels as the correlation to stocks narrows again. Moreover, the market is increasingly pricing in the likelihood of some type of recession. The question now, with the short-term looking weaker, is it time to buy long-dated bonds? This is important in our allocation decisions on equities and in particular on individual stocks.
Exhibit 3.
Stock/Bond covariances narrowing again, recession being priced in for short term – long-dated bonds looking more attractive.
Note the divergence between US TIPS and the long-end of the curve (UST 20yr) suggesting inflation expectations are tighter
Image: HB Insights. Data: Updata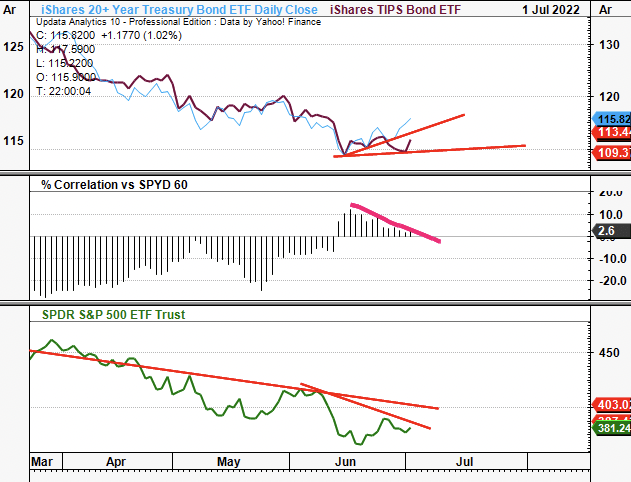
However, the rapid nature of these latest moves in bonds and equities seems to have magnified the small spike in covariances, as seen below. Taking a step back, there’s good data to suggest this small blip is likely to correct after a shortish period, and is already showing signs of doing so.
Exhibit 4.
Velocity of downward legs looks magnified from current correlation spike
Yet, the current jump in covariances has already begun to normalize
Image: HB Insights. Data: Updata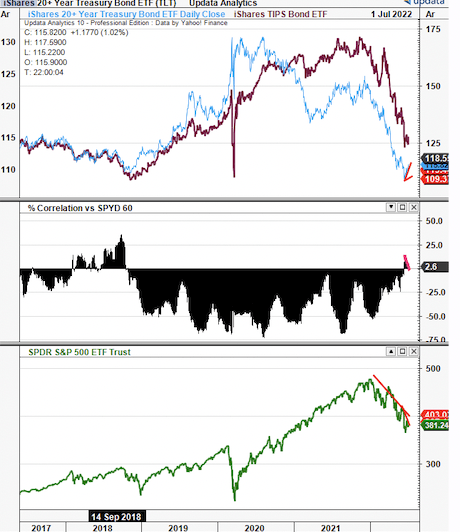
Nevertheless losses continue and the covariances between the traditional equity/fixed income portfolio means there’s little room to hide in 2022.
Balanced portfolios have outperformed watermarks and retained both strategic and tactical alpha last quarter. In particular, those portfolios with a weighting to alternatives received equity returns uncorrelated to traditional equity markets.
For instance. the 60/40 portfolio incurred its worst 1st half in decades amid the correlation trends shown above. From the period 2 Jan-1 July 2022, it’s incurred a ~21% drawdown (ongoing) with standard deviation of 11.7%. Unsurprisingly this has delivered a -3.8 sharpe and similar sortino ratio. It is down ~21% YTD.
Meanwhile, an equal weighting across 5 asset classes – including commodities and alternatives – realised a 0.59% return in the same time, with standard deviation of just 6%. The smoothing of returns ensured just a -3% drawdown and retained a sharpe and sortino ratio of 0.13 and 0.18 respectively.
Exhibit 5.
Balanced portfolios with alternatives exposure have outperformed in 2022
Alternatives have been the key differentiator for diversified net-longs
Image: HB Insights Portfolio Research. Data: PortfolioVisualizer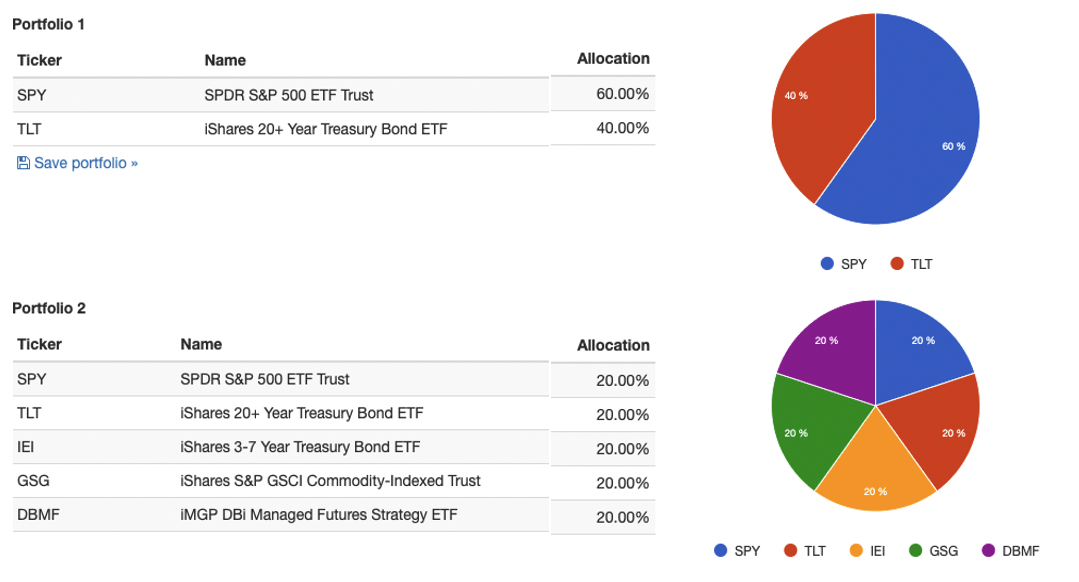
Lower drawdown, positive return, flattened returns
Image: HB Insights Portfolio Research. Data: PortfolioVisualizer
In terms of products and funds, managed futures were the star, alongside other trend following and commodity-based strategies. ETF’s tracking managed futures and various active management strategies illustrate this performance, as seen below. In particular, trend following strategies (managed futures) have jumped in relative strength to the SPX whilst delivering outsized premium year to date. This reaffirms our argument that low-beta performance also offer investors increasingly stable equity returns in this current volatility cycle.
Exhibit 6.
Alternatives continue to strengthen vs equities, offer outsized premia YTD
Image: HB Insights. Data: Updata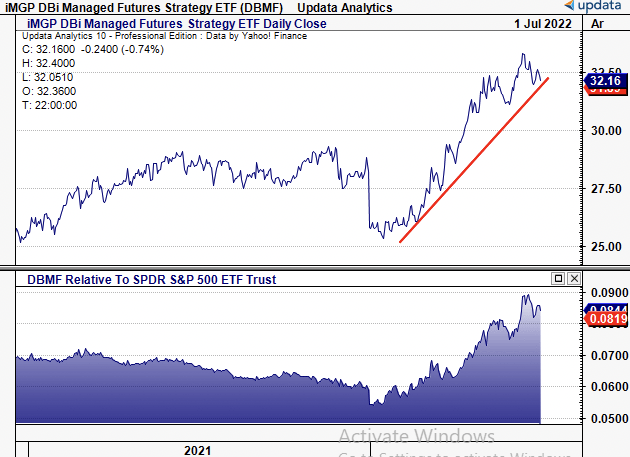
Low-Beta solutions still providing meaningful diversification benefits, particularly on the tactical side as quality dries up
Image: HB Insights. Data: Updata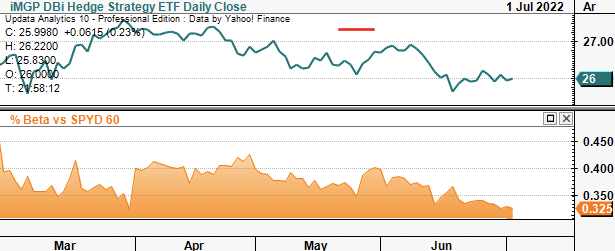
This information is incredibly important to our thesis on STAAR Surgical Company (NASDAQ:STAA), outlined below this summary. We took a hard data approach with STAA to examine its macro-credentials of will stand up in the forward looking regime. Net-net, STAA presents with quantitative risk and return characteristics that position it well into the forward looking regime. We note its repeated history of earning surprises and strengthening bottom-line fundamentals. Extra consideration should be given to STAA’s qualitative factors that are not discussed in this particular report.
Investment Thesis Summary
As the asymmetry in risk assets continues to widen, the talk now turns to companies with the macro-economic credentials to absorb impeding headwinds on the horizon. STAA fits this bill on various counts by our estimate.
Exhibit 7. STAA 12-month price action
Data & Image: Updata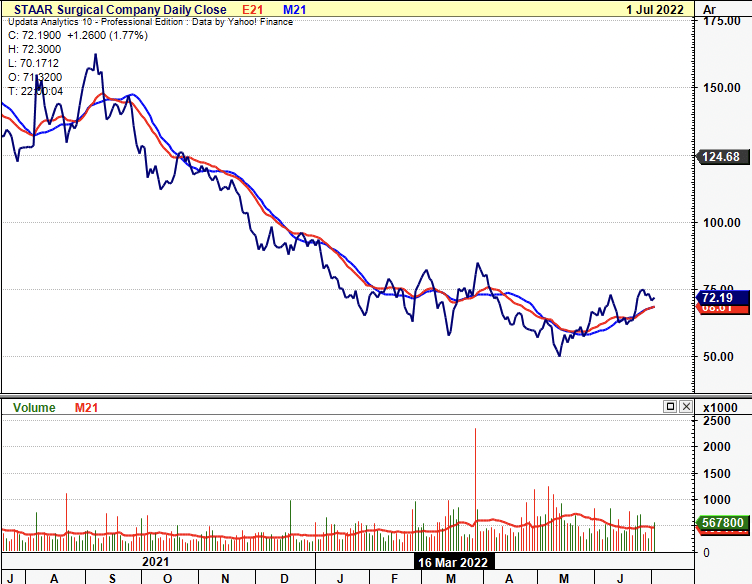
Investors are now positioning to absorb macro-specific risks, and thus profitability, fundamental momentum and earnings quality are paramount. In that vein, here we demonstrate STAA justifies its inclusion into a long-bias, equity focused portfolio, to position for the future. On a number of fronts, we rate STAA a buy and price the stock at ~$98 per share on a blend of inputs.
A focus on bottom-line fundamentals
The growth trade is well and truly exhausted and investors are now focused on factors of quality and profitability, our findings show. As such, the priority is on bottom-line fundamentals, and our modeling indicates these factors continued to drive equity returns in medtech during June. This is important in STAA’s case, given its fundamental momentum to date, and looking ahead.
Exhibit 8.
HB Insights quantitative factor modeling, June 2022
Data: HB Insights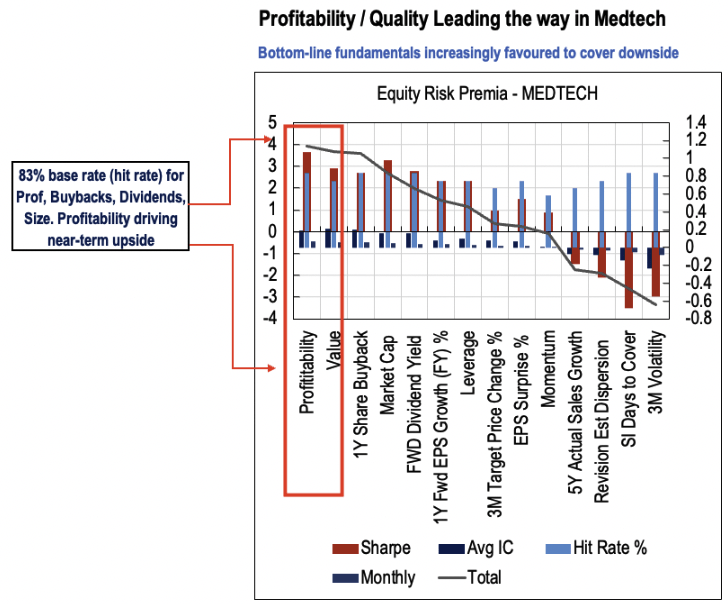
Earnings have compounded at ~50% per year until FY18-Q1 FY22 for STAA following consecutive gross profit and operating income growth over this time. Gross margin widened by ~80bps YoY and 160bps QoQ in Q1 FY22 due to a higher ICL sales mix. Meanwhile, operating income has increased by CAGR ~73% in the last 3-years. Both operating income and FCF have been seasonal during these years, however, operating margin has lifted from the red to ~20% in its last earnings.
Whilst seemingly low, the growth in operating margin is what’s tangible here. First, it demonstrates an uptrend in operating efficiency to carry forward. Second, it provides ample headroom to lift margins further amid an inflationary regime. Operating income came in at ~$12 million in Q1, a 60% gain from Q1 FY21. As a catalyst, roughly 50% of operating income came from the time of the US EVO marketing investments. These will now occur in Q2 and Q3 of FY22 as FDA approval occurred on March 25.
Exhibit 9.
Data: HB Insights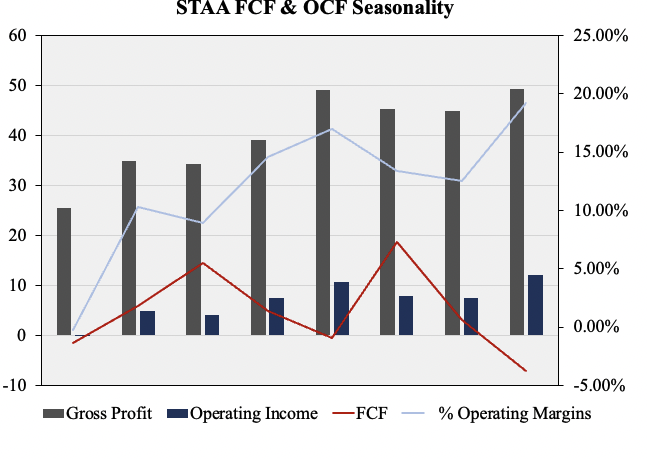
The impulse effect of this operating momentum is seen further downstream in STAA’s financials. As a result of incremental growth to operating margin, the company’s averaged a ~1x quarterly operating leverage and 2.4x earnings leverage since FY21. We’d consider these safe numbers. Recent trends illustrate each $1 growth in sales could ratchet STAA’s earnings up by 6-14x.
Exhibit 10.
STAA Operating & Earnings Leverage has crept up throughout the pandemic off a steady base
Data: HB Insights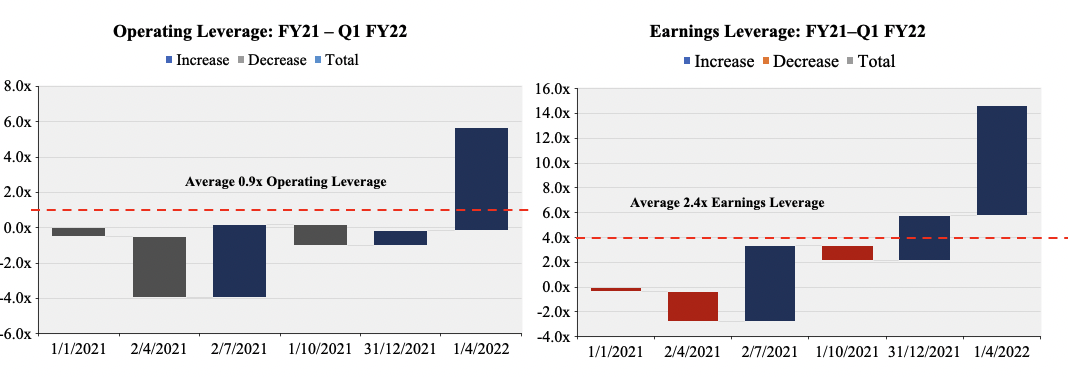
Consequently, profitability measures have also firmed up in recent periods for STAA. ROA came in at 8.7% at the last print, up from -0.1% n FY20, whereas ROIC has increased by ~7% geometrically over the past 5 years and was 15.7% in Q1. Importantly, the spread of ROIC off the company’s WACC has been consistent over the past two years as well. Recently, it had 2.7x turns above its WACC from ROIC, well above comparable peers. This is a bullish indicator in our estimate seeing as investors have turned to profitability measures in medtech to separate the winners from the losers.
Exhibit 11.
Data: HB Insights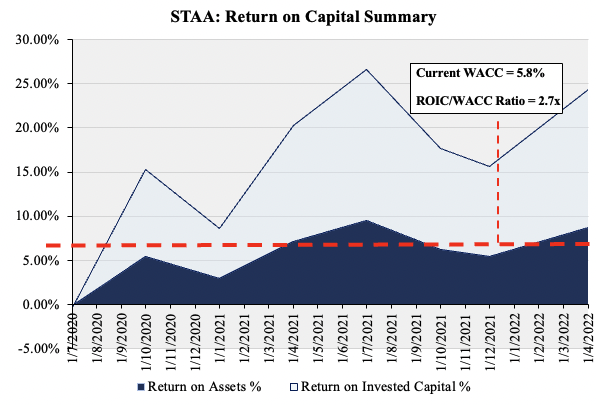
Tangible value flow
Given that investors have shifted focus onto bottom-line fundamentals, the case strengthens for STAA. Three-year FCF growth has normalized at ~36% for STAA and it’s grown its tangible book value by CAGR 26.5% in the same time. As a result, it’s also grown FCF/share incrementally to ~$1.15 per share from Q2 FY20 to Q1 FY22. We’ve forecasted the company to deliver 28% and ~27% YoY growth in revenue for FY22 and FY23 respectively, although this sits secondary to movement down the P&L.
More importantly, our investment strategy looks at a company’s ability to compound cash. We’ve folded in envision this to carry through to ~$50 million in FCF by 2023, resulting in another $1.22 in unrealized FCF/share by FY23, and that’s where the value proposition is in STAA. A 194% cumulative gain in FCF/share from before the pandemic (Jan-FY20′) to FY23, in our estimates. That kind of tangible value creation for shareholders is a differentiating factor in this investment debate.
Exhibit 12.
Data: HB Insights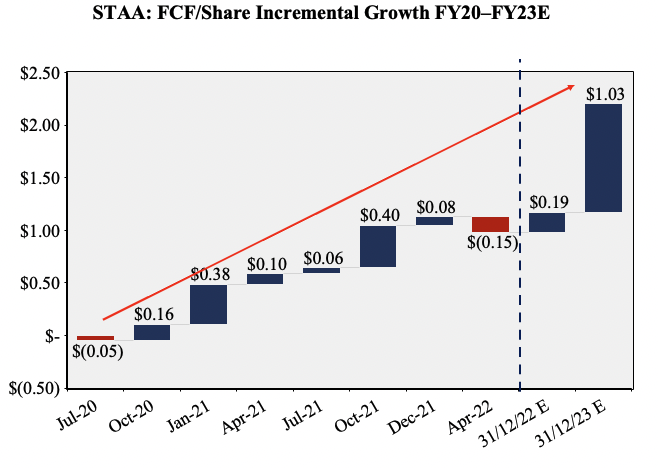
Looking ahead, we’d envision this to drive further share price appreciation into the coming years, by estimation. We firmly believe the market will continue rewarding growth in bottom-line fundamentals over top-line growth into this period, supporting the case for STAA. Within balanced and/or diversified portfolios, this is incredibly important. Should the market reward cash-rich companies with quality earnings, investors need to focus on a switch to short duration value/quality factors, and shift away from long-duration growth. With STAA’s tangible value flow set to expand (we define tangible value flow as FCF/share and EPS growth), this weighs in on factors of valuation and implies further share price appreciation in our modeling.
Exhibit 13.
Data: Updata, HB Insights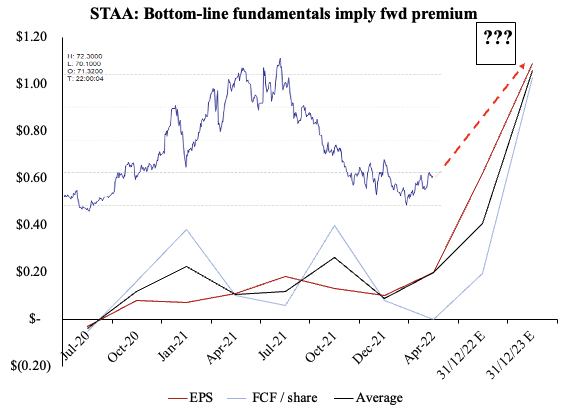
The question now is, how can we be rest assured STAA will continue at this cadence? One way to gauge this is to examine working capital management over the periods to date. Even throughout the pandemic, STAA managed to maintain a grip hold over the balance sheet and have freed up liquidity from working capital. Each of days sales outstanding and days inventory outstanding have narrowed by ~30 days and 50 days to 64 days and 116 days respectively.
As a result of its efforts the cash conversion cycle has decreased from 177 days to 115 days since January 2020, meaning there is less cash tied up in working capital. This cash can and will be reinvested immediately back into operations to generate more ROIC and ROA, effectively winding up the torque on the flywheel. With the trend in cash conversion continuing in 2022, there’s good probability further cash will be freed up from the working capital cycle.
Exhibit 13.
Data: HB Insights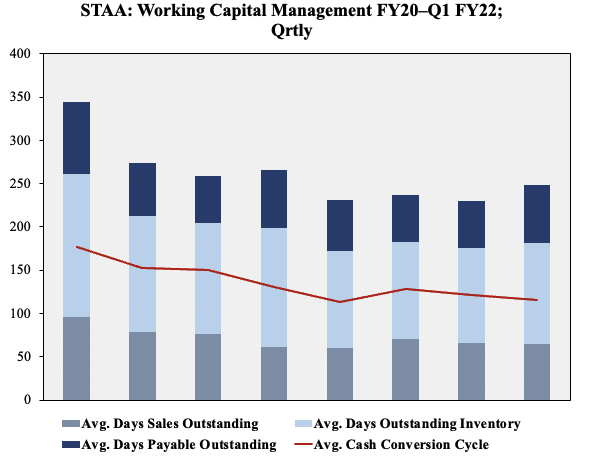
Effectively we now have an investment debate that is tilted heavily bullish by the company’s propensity to weather the impeding macroeconomic risks being priced in by the market. STAA fundamentally demonstrates its inclusion into an equity focused, long-biased portfolio. Price objectives and technical studies should then round out the picture.
Valuation
Shares are trading at ~77x forward P/E below 5-year normalized 150x P/E. The STAA share price is also priced at 129x FCF and investors enjoy a ~1% yield on this. STAA trades at 12.5x book value, illustrating management’s value add above the sector median’s 2.62x. Shares are also trading at a substantial premium to names chosen as comps for this analysis. The question is, if the premium is warranted.
Exhibit 14. Multiples & Comps
Data: HB Insights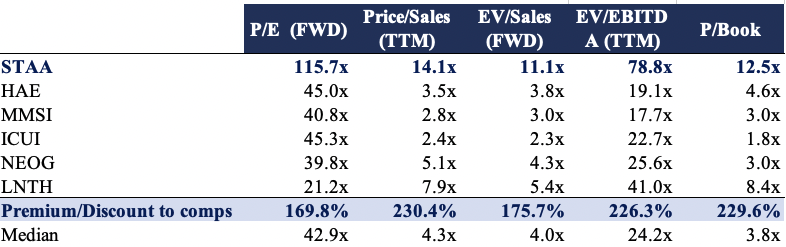
The stock is also trading at a substantial premium to its 4-year normalized values. Normalized multiples are often a cleaner forecasting tool and assigning a composite made of STAA’s 4-year normalized multiples recognizes a median price target of $96 per share. Given the breadth in data distribution there is less confidence on the average $135 price target seen below.
Exhibit 15. Normalized valuation projections
Data: HB Insights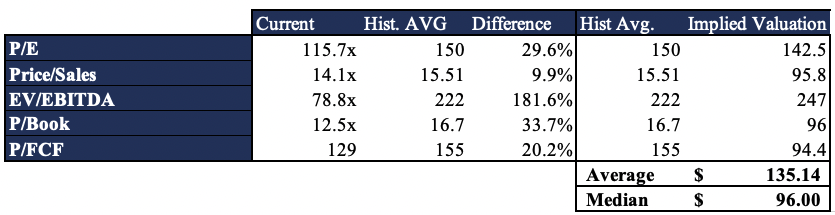
Using a set of unambiguous measures to gauge the market’s psychology behind the stock is equally as important in this climate. Point and figure charting, to remove the noise of time, reveals a number of buying thrusts at the ~$50 level up to current market prices for STAA. The upside target at $73 has been activated and we are now looking towards a $100 per share upside target based on this analysis.
We’d need prices to break above the resistance lines shown in red below for greater confirmation to that $100 level. Irrespective, this price action appears somewhat bullish and additional technical factors confirm the same, as discussed below. Nevertheless, a composite of these factors see’s us price STAA at $98, seeking a return objective of ~30% to that level.
Exhibit 16.
Upside targets to $100 but needs to break through inner resistance line for confirmation
Data: Udata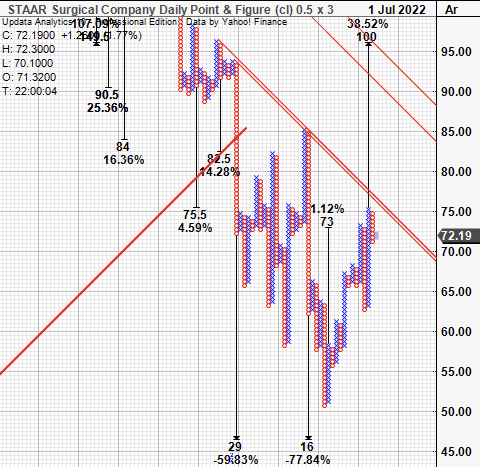
Technical Studies
On the charts, shares have punched up back above the cloud and are now testing support at the upper bound of the cloud. The lag line looks to have breached through cloud support as well helping to confirm the trend. On balance volume (“OBV”) has curled up out of a longer-term downtrend and now suggests bullish momentum in unison with momentum. Both OBV and momentum studies suggest there’s been buyers to the current levels and that STAA is still catching a strong bid.
Order breadth is fairly narrowed and the option chain is shallow on both sides of the quote. OI is heavily distributed around the $75-$85 strike in calls and $65-$75 on the put side. However, risk is contained as there’s little-to-no risk trades on offer either OTC or directly from brokers (no turbo long type products for instance).
Exhibit 17.
Back above cloud support, buyers at current levels and trend indicators confirming uptrend
Data: Updata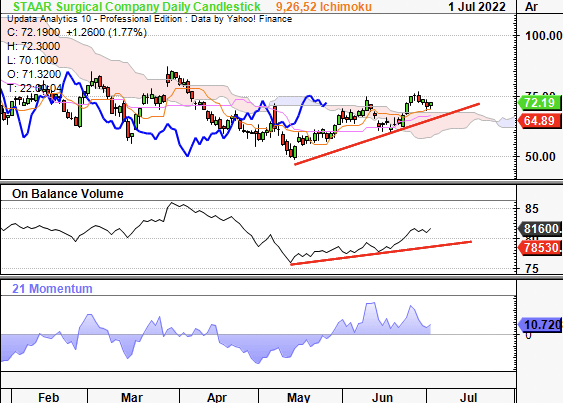
This price action is bullish by estimation, and this chart and trend indicators imply further upside is probable. There’s also been divergence in MACD in June and RSI has strengthened in unison with other trend indicators. We’re confident STAA has found its ranging lows and selling activity looks to have somewhat exhausted. It tells us that investors are paying a relative premium for quality factors (in line with previous findings).
Exhibit 18.
Further confirmation of bullish momentum and forward price action
Data: Updata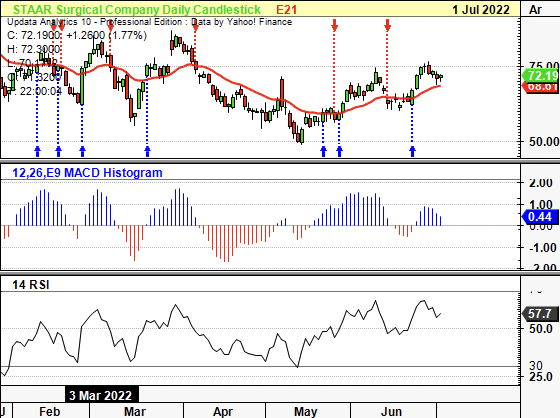
In short + Positioning
Over the past 6 months, our advice to clients has been similar to as follows. With STAA, the recommendations are largely the same. In view of the macro-regime, we advocate clients to position ~20-30% of their portfolios to reflect the potential distributions of the global economy. That includes recession risk, inflation pressures, and a shortening up of duration on the equity side, just to name a few. As such, ~1/3-1/5 of investor portfolios should carry securities with a 20-30% margin of safety.
STAA fits the bill here. Even if earnings, sales and/FCF fell by another 20% (worst case scenario) there’d still be adequate cover over this downside. Plus, its valuation would still standout against peers. The remaining ~66% should be positioned as if the Fed will in fact deliver on its promises of a soft landing. STAA also fits the mold here too — we’ve priced it with ~30% upside potential, but we had distribution up to $222 in our valuation modeling.
A quick evaluation of STAA’s inclusion into a balanced cross-asset portfolio (Exhibit 5) reveals the setup still beat the SPX this YTD, with drawdown of ~5.5% and loss of -2.5% since 2 January 2022. Results of the mini-study are displayed below.
Exhibit 19.
Portfolio statistical summary — STAA inclusion (Short/turnover constraint)
Data: HB Insights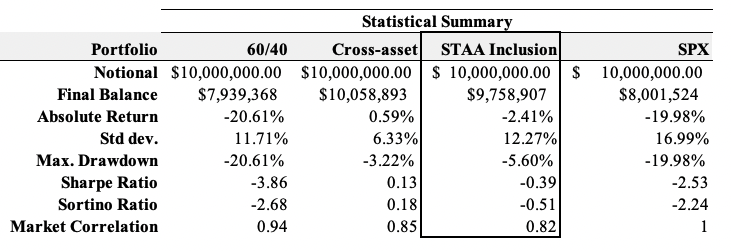
Based on all of these factors discussed in this report, we rate STAA buy, PT $98 on blend of valuation inputs, seeking ~30% return objective.
Be the first to comment