

ALLVISIONN/iStock via Getty Images
First of all, I’ve been bullish on SPDR S&P 500 Trust ETF (NYSEARCA:SPY) as recently as July 18th. I called for a summer rally. But that was a near-term timing call, which I reversed to short recently. There are many troubles on the horizon, near-term, intermediate-term, and most importantly longer term. This is not a buy-and-hold market, and you simply can’t ignore these fundamental changes. So, here is the context of the current situation.
The Context – Phase 1 selloff
First, to understand the context, the Fed made its hawkish point in November of 2021 after it admitted the “transitory inflation” outlook mistake. Thus, starting in January of 2022, the market started to price increasingly more aggressive monetary policy tightening for 2022, which reached a peak hawkishness point on June 16th, with the expected Federal Funds rate at 3.66% for 2022. Consequently, the S&P 500 had what I define as a Phase 1 bear market selloff (liquidity shock) of 24%, which bottomed exactly on June 16th at the peak Fed hawkishness point.
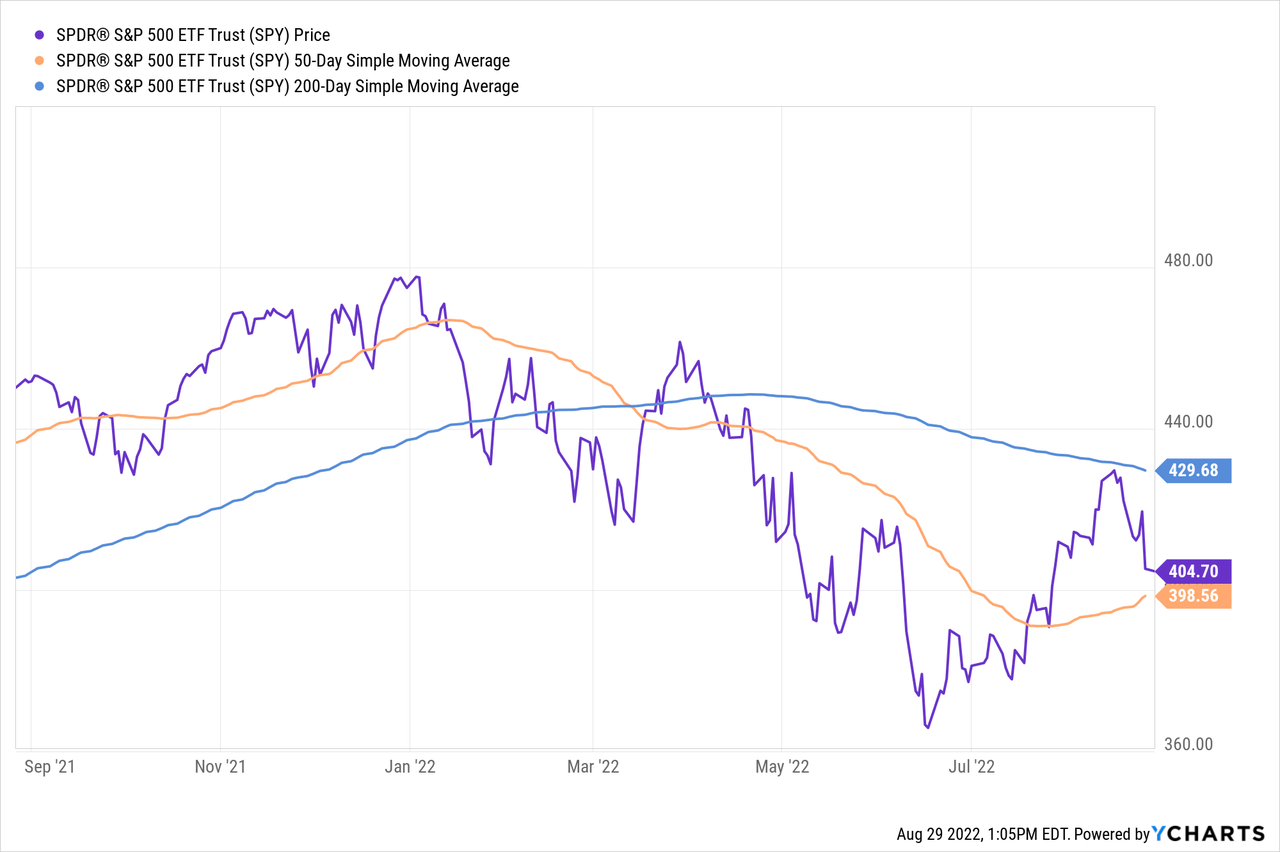
The subsequent bear market rally was based on the anticipated Fed’s modest dovish turn – or less aggressive monetary policy tightening as the CPI inflation peaks. The rally ended as the Fed Chair Powell ruled out the dovish pivot on Aug 26th and promised “rates higher for longer” and “some economic pain to come.” Here is the SPY chart for context:
The near-term troubles to come
1. The Phase 1 Part 2 selloff – based on the 2023 monetary policy tightening expectations.
The Fed Chair Powell was very clear that the inflation mandate is the priority, and interest rates would have to rise higher, and stay at a high level for longer, to slay the inflation expectations. The immediate implication is that the Fed is likely to be more aggressive in 2023 than currently expected – which translates into a higher probability of a Phase 1 – Part 2 Fed-induced liquidity shock selloff. In other words, the market still has to adjust for anticipated monetary policy tightening in 2023.
I show in the GAV S&P500 Outlook that the market currently expects the Fed to tighten to 3.80% by April 2023 and to start cutting the rates by November 2023 to 3.54%.
Global Academic View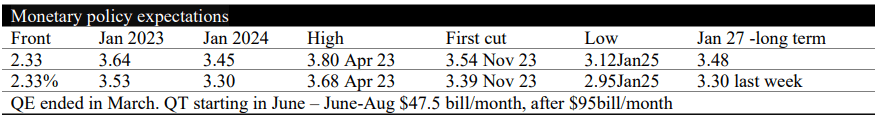
Note, the April 2023 Federal Funds futures contract peaked on June 14th at 4.10%. It looks like we are headed towards this mark as the market starts pricing a more aggressive Fed in 2023.
The key point – the expectations of a more aggressive Fed in 2023 will cause more liquidity-based selling, which could push the SPY towards the June lows.
2. The Fed will double the QT in September
As noted in the Table above, the Fed is set to double the balance sheet contraction, or Quantitative Tightening (QT), from $47.5 billion a month to $95 billion a month. As a result, a more aggressive QT will only accelerate the liquidity-based selloff.
The intermediate-term troubles to come
3. The Phase 2 recession-based selloff
The Fed’s admission that “some economic pain” is necessary to lower the inflationary expectations means a recession likely is coming. In fact, the Fed is set to invert the 10Y-3mo yield curve spread in September, after the next FOMC meeting. Currently, the 10Y-3mo is at 0.22%, near zero, but it will invert as the Fed increases interest rates in September either by 50bpt or 57bpt.
Global Academic View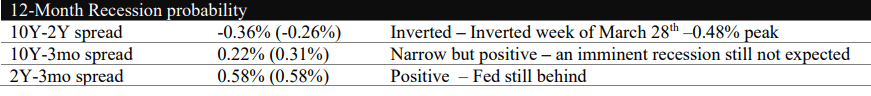
The inverted 10y-3mo spread, the Fed’s preferred recession indicator, will likely lead to a recession within 12 months. Note, the 10Y-2Y yield curve spread is deeply inverted, and it has first inverted in March. This only confirms that the Fed-induced recession is coming, which will negatively affect the corporate earnings and contract the valuation multiples – and, thus, likely take the SPY below the June lows.
The long-term troubles to come
4. The unfolding trend of deglobalization
Most long-term investors have been conditioned to hold through short-term and intermediate term “troubles.” However, the long-term fundamentals have changed, and there is no guarantee that the long-term U.S. stock market uptrend will continue to hold. In fact, most international markets have been in a long-term range already. This is not a buy-and-hold environment.
Specifically, the high inflation of the 1970s has been reduced via the policy of globalization. Global outsourcing of production has increased the labor pool, lowered the cost of production, and significantly and continuously expanded the supply capability to satisfy an “insatiable” demand in the developed world. Furthermore, the boom in global trade has significantly and continuedly boosted corporate sales and GDPs. As a result, we had the globalization-based goldilocks – high growth with low and stable inflation.
The rise in global populism after the 2008 global financial crisis culminated in 2016 with the U.S. elections and Brexit, with an accelerated trend of de-globalization, and the trend of global polarization and the great decoupling of the U.S. and China as international trade partners.
The Russian invasion of Ukraine is also part of the unfolding trend on de-globalization, where the conflict will not only be in the economic arena, but also involve real physical altercation.
As a result, over the long-term, we can expect overall higher inflation to persist due to global supply chains adjustments and chronic shortages of commodities, and also lower growth due to less international trade. This a classical stagflationary environment, which will result in more frequent recessions. The stock market is likely to be in a neutral long-term trend with the alternating deep selloffs and sharp rallies. Thus, market timing will be very important.
Implications
There are many real issues for the stock market over the short term, intermediate term, and long term. Over the short term, the Fed’s expected monetary policy tightening in 2023 continues to support further liquidity-based selling. Second, over the intermediate term, a recession is likely coming, with more recession-based selling. Finally, over the long term, the unfolding trend of deglobalization will be stagflationary and cause more frequent recessions. Thus, investors can’t simply ignore the unfolding bear market and continue to buy-and-hold. Global fundamentals have changed.
Thus, I continue to rate SPY as a SELL, even after the large selloff since my recent sell rating on Aug 15th.
Special SPY considerations
The SPDR S&P 500 Trust ETF (SPY), which tracks the S&P500 (SPX) (SP500), has been down by over 4% over the last week. This was a broad-based selloff, with all sectors down except the Energy Select Sector SPDR ETF (XLE). As previously explained, this is likely a Phase 1 Part 2 liquidity-based selloff, and the broad participation to the downside supports the thesis that we could revisit the June lows, even before the Phase 2 recession-based selloff takes place.
SelectSectorSPDR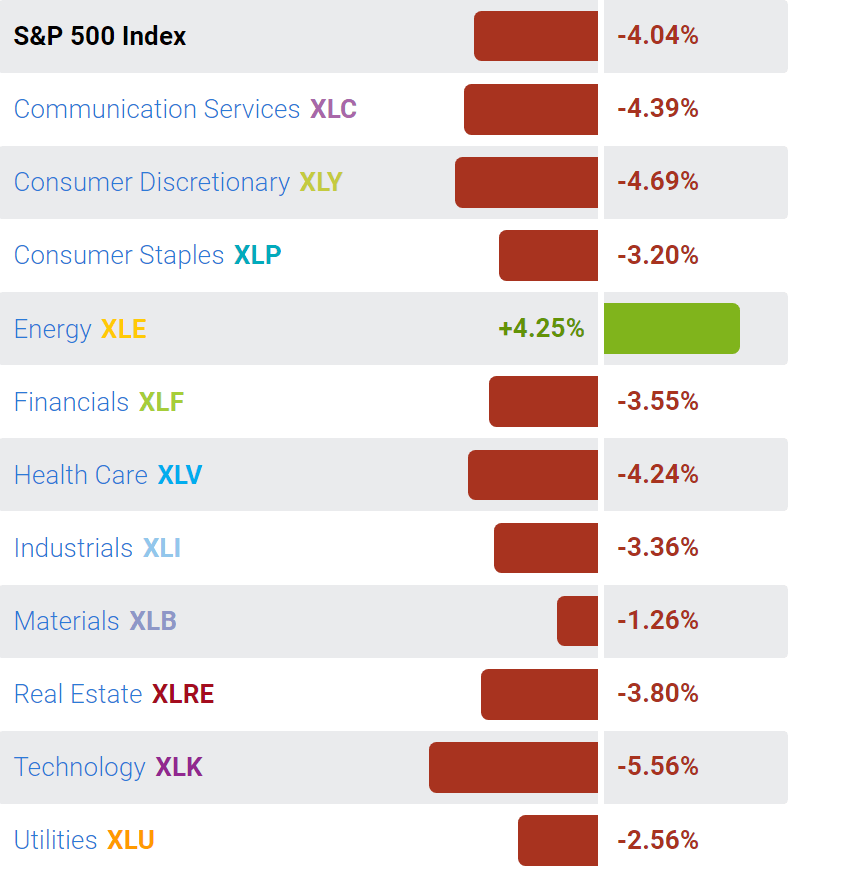
Be the first to comment