

Mike Powell/DigitalVision via Getty Images
Traders, market makers, hedge funds and bots look for contrarian moves like a technical bounce after a big selloff in the market (NYSEARCA:SPY). The big question is not “if” but “when” do we get the bounce? The simplistic answer is when price stops going down, because the sellers are exhausted and the traders and shorts rush in to buy for the move back up. Naturally the copy cat bots jump in and do the same. It’s a no-brainer and the bots have no brains. Luckily we do and we should see the bounce faster than the bots and jump in before them for the ride back up to resistance.
There is no magic in seeing the start of the bounce up. You just have to be proactive, spot the Supply drying up and catch the first glimpse of Demand coming in to start the technical bounce. If you are a “tape reader”, you will see it happening on the real time candlesticks. Or, if you are like me, you will see it in the chart signals. If you have a friend on a trading desk, maybe he will text you and let you know. Our 20-day bar chart for Demand and Supply tips us off. Leading indicators on the chart signals also put us in a proactive mode, ready for the start of the technical bounce.
We may not even need these signals, when we see a surprising bit of good, fundamental news pop up on our computer. For example, an end to the war in the Ukraine would create a tremendous bounce. A more likely scenario might be some good earnings reports in July, indicating that the consumer is still spending, despite inflation and high gasoline prices. Consumers want to get out and enjoy life after COVID and they have the money to do it. That recession isn’t until next year at the earliest. The pinch of higher prices and interest rates is still only a pinch, not as painful as an unemployment check.
Unfortunately, right now the SPY is walking around lost in the desert of no real news, like lots of earnings reports that will be coming out in July. Not only is there a lack of good news, some companies may pre-announce bad news. After all, they have the revenue numbers booked, probably already know the earnings and are looking for some optional, internal event to meet expectations when they announce. They know right now if earnings will be a disaster and they may give the analysts a heads up. That will take price down in the next couple of weeks, before earnings are announced.
We don’t expect Tuesday will start the week off with any bounce. More than likely, we will see pent-up selling from overseas due to the Monday Juneteenth holiday closing of the markets in the U.S. celebrating the end of slavery. Further, the daily chart shows that we are still in a short term selling cycle that may last until the July 4th holiday. Then we could see the start of a bounce that accelerates as earnings are reported in July.
We publish a daily update on the SPY, but it is difficult to see the trend when you try to parse the day to day fluctuations in the SPY. To be ready for the technical bounce, we like to look at the weekly and monthly charts, because the signals are more reliable. If the daily chart has any value, it is as a leading indicator to the weekly chart. Of course, for day traders, the daily chart is their long term chart, but not for us.
Here is the daily chart and you can see all the signals are down and the SPY is just waiting for some good news to start the technical bounce from deeply oversold.
SPY Daily Chart In Free Fall (StockCharts.com)
On the chart above, you can see price is in a free fall, with four days with opening gaps down in the last seven trading days. Price pauses on two days at weak support levels. Next stop is $348 and we think that is a strong support level where we expect a bounce, fueled by July 4th holiday optimism and the July earnings report. We are looking for a bounce from ~$350 to ~$390 by the end of July. Of course, we will watch the signals to tell us and they make our decisions, not our expectations for the next bounce. The first indication of the start of a technical bounce will appear on the signals of this daily chart.
Below is the weekly chart and it has the advantage of eliminating the emotions and false starts of the daily chart. The daily chart is for traders and the weekly chart is for investors. The weekly has the advantage of more reliable signals and the disadvantage of being late.
SPY Weekly Chart Negative Gap Down (StockCharts.com)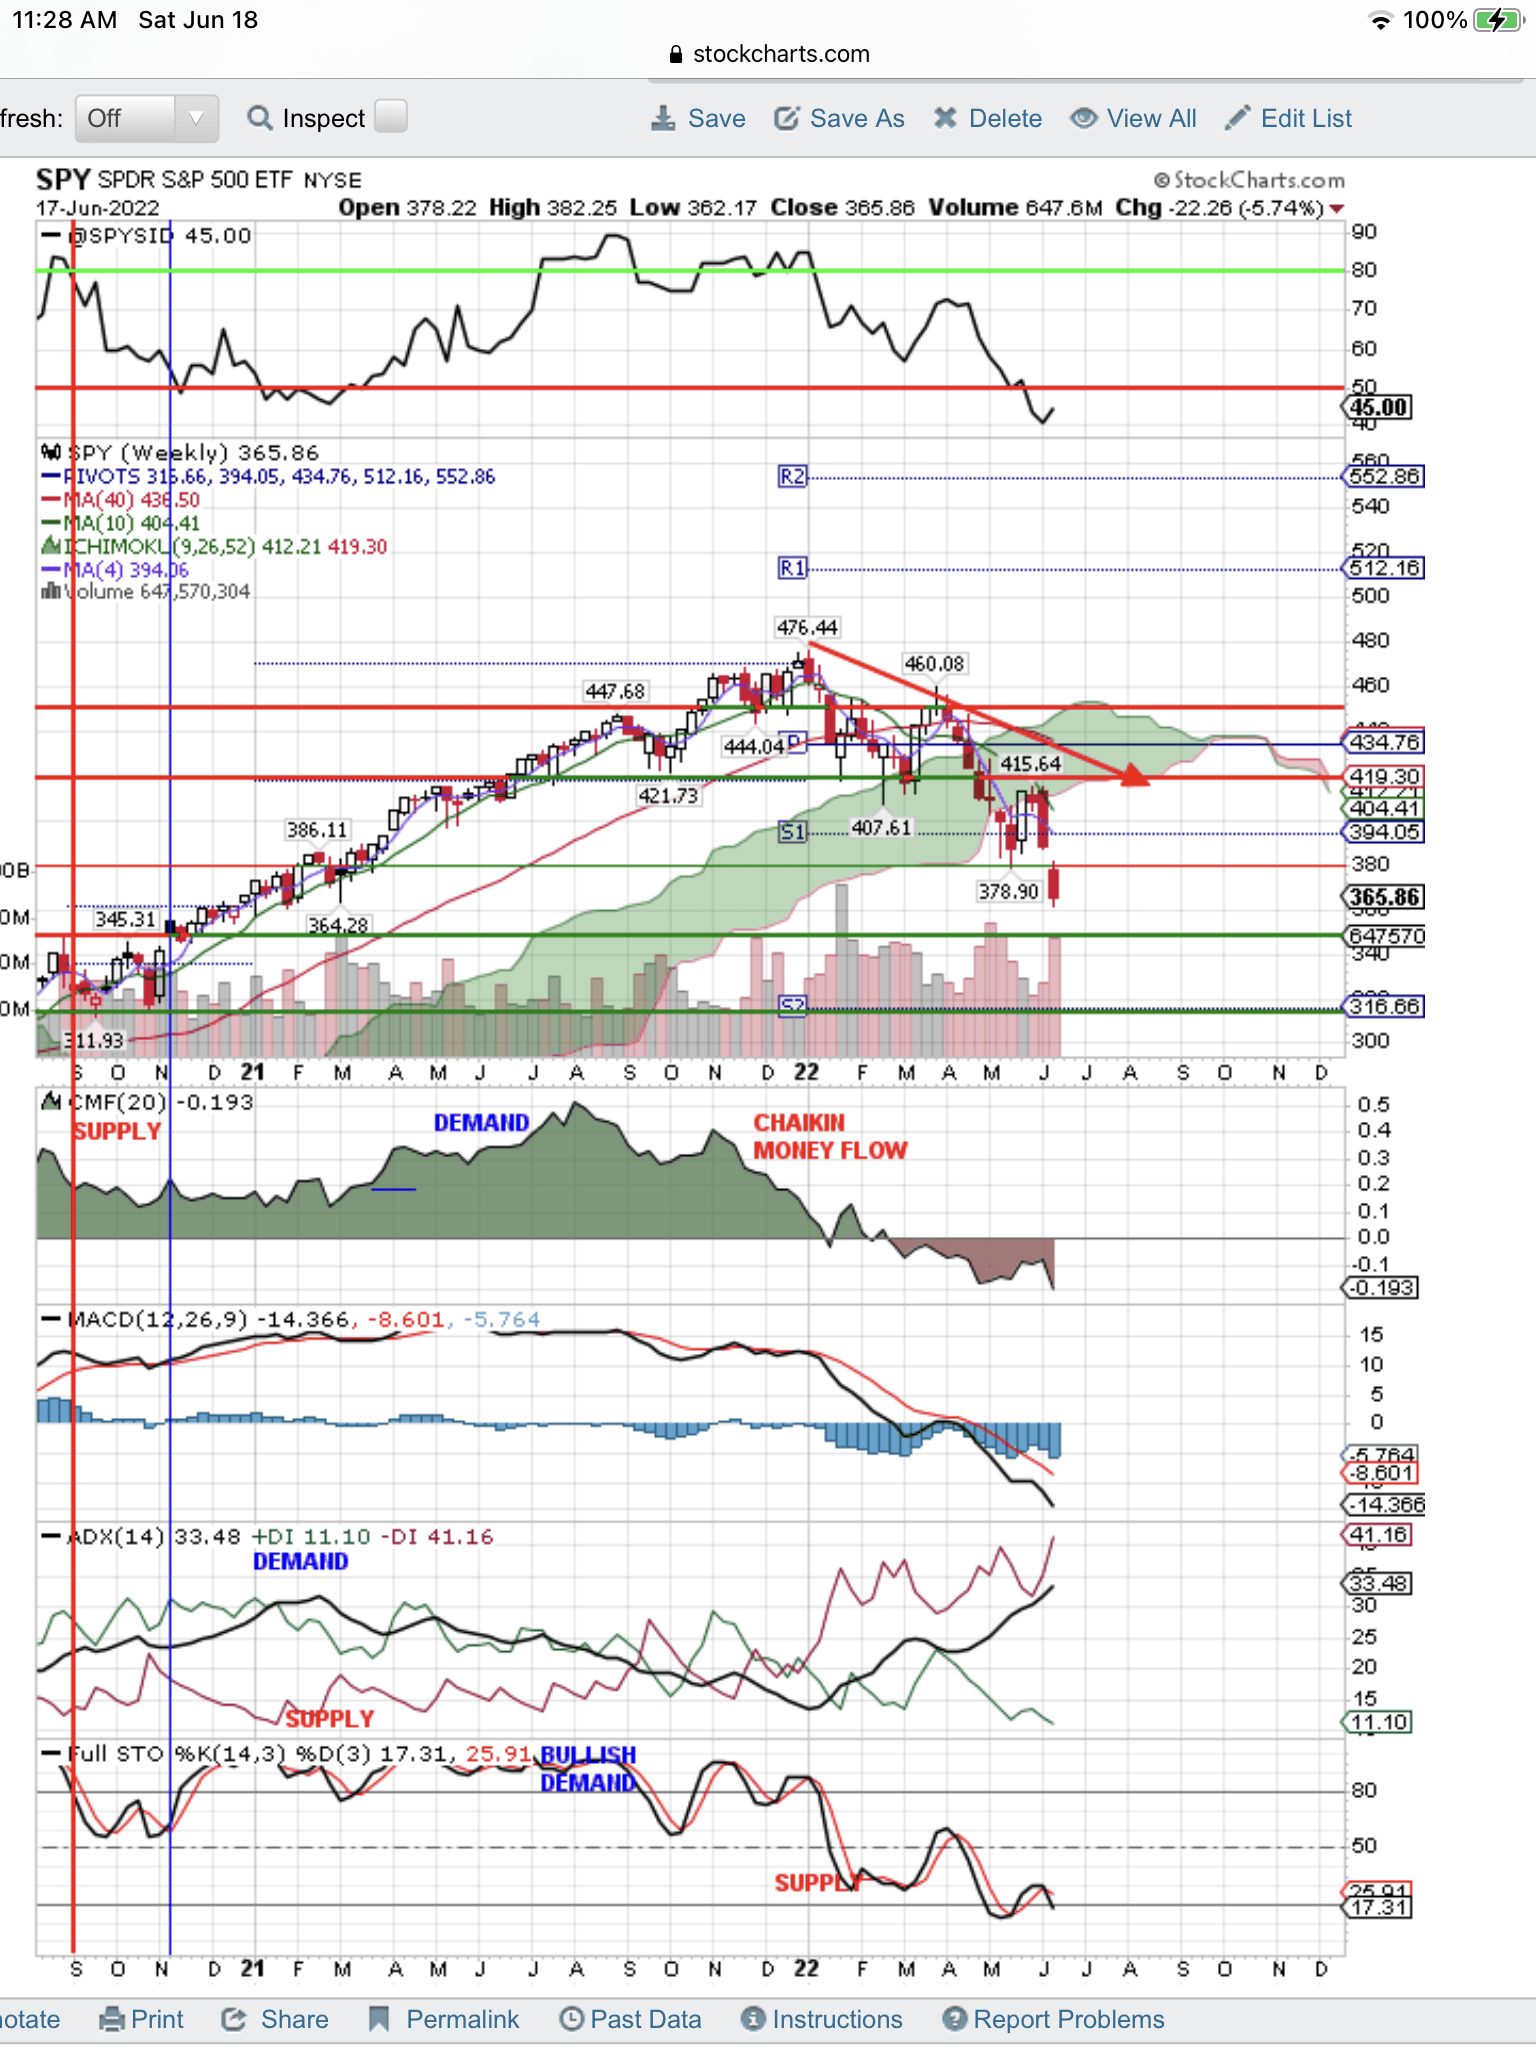
Look at the gap down in price this past week. There is no other gap like this on the chart. This, along with the extreme indicators of Supply on the chart, are a setup for a technical bounce. Usually gaps are filled and a strong technical bounce, fueled by July earnings reports, may do the trick. After all, we are getting closer and closer to a bottom, even though there is no sign of a bottom yet. We can see the market is extremely oversold and where the bottom might be on the chart. However, we will wait for it to actually happen.
At the top of the chart is our longer term, proprietary Sell Signal. It uses both fundamentals and technicals. Right now, our short term signal is also a sell. We will change to a buy to catch the short term, bounce up. Stay tuned.
Conclusions
Bear market bounces come up short, as we saw on the last technical bounce. All of that will change when the market has a bottom in place. However, there is no sign of a bottom yet. The SPY knows all the bad news from the Fed, the war, oil, inflation, and supply chain disruptions. That is why we have a bear market. It knows technology is out and value is back. High PEs and PEGs are coming down. The market is rotating into recession-proof stocks. When it sees any or all of the negative factors improving, we will have the start of the next bull market. My guess is the next bull appears in 2024. Meanwhile, we are waiting for July earnings reports to trigger a bounce in the SPY and fill the shocking gap down in price. The bottom of this bear market is getting closer. The consumer and earnings will be the last things to fall. The SPY is the leading indicator of what the economy is in for, as the Fed brings inflation back down to 2%. That may not happen until 2024.
Be the first to comment