

SeanShot/iStock Unreleased via Getty Images
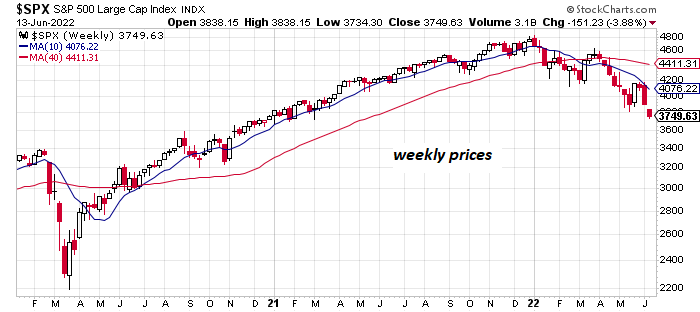
A common definition of a bear market is a 20% stock market decline. By that standard, the S&P 500 crossed that Rubicon yesterday (June 13) for the first time since the pandemic crash in March 2020 as the market’s drawdown reached nearly -22%.
Whatever you call, the market trend of late is clearly negative. But that’s old news. The S&P 500’s directional bias has been clearly pointing down for several months, and so anyone who’s surprised by the recent tumble hasn’t been paying attention.
How close is the market to a bottom? That’s the critical question, as it always is when the market slides. But the standard answer still applies: no one knows in real time, although we can use some analytics to guesstimate how near we are to a bottom.
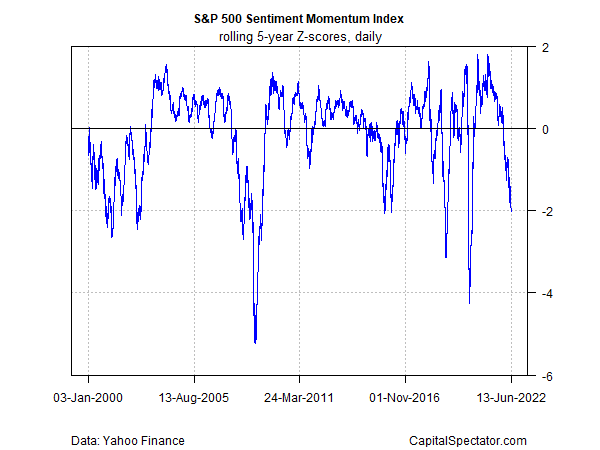
One way to estimate an answer is by monitoring an aggregate of several proxies via CapitalSpectator.com’s S&P 500 Sentiment Momentum Index (for details, see this summary). The index (cited in Z-scores) is currently posting its lowest reading since the pandemic initially triggered a sharp correction in the spring of 2020, leaving the index at roughly -2 standard deviations, twice as deep since our April update. It’s clear that the market is closer to a bottom. Whether this is the actual bottom, alas, can only be determined with hindsight. Keep in mind that the sentiment data below shows that while -2 is a relatively low mark, the S&P has managed to go deeper and so the potential for more selling can’t be dismissed. That said, it appears that the bulk of the downside is behind us. On the other hand, conservative investors may want to wait until we see some upside trending behavior to call a bottom. By that standard, it’s still too early to go fishing.
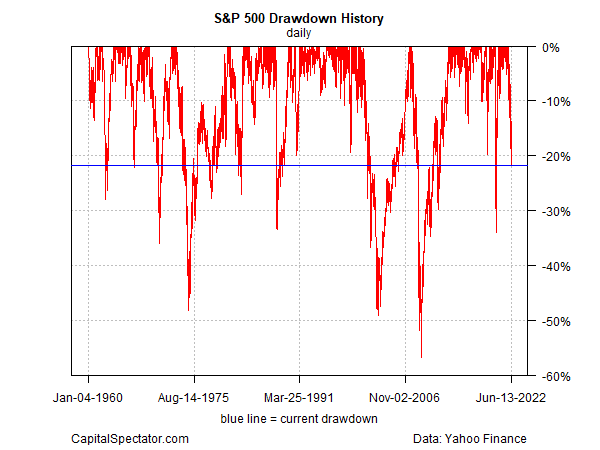
For another perspective on how the market correction stacks up vis-à-vis history, consider the drawdown chart below. The current peak-to-trough decline for the S&P 500 fell to nearly -22% yesterday. The slide is no longer a garden-variety correction, although we’re still well above the steepest drawdowns reached in the past 60-plus years. In other words, there’s still precedent for further deterioration.
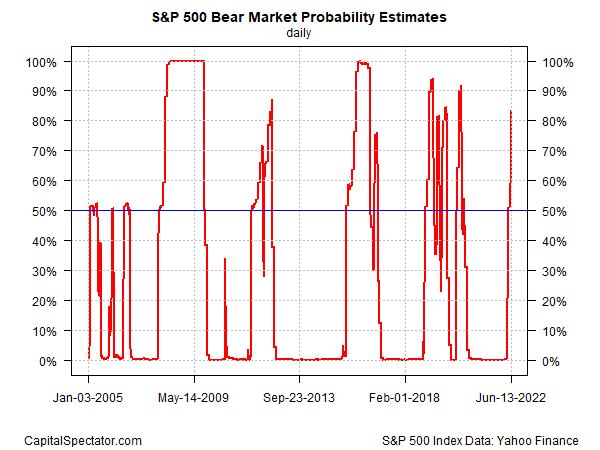
Using a Hidden Markov model (HMM) clearly shows that the S&P 500 has entered bear-market terrain. This indicator has been hinting at no less recently, inching above the 50% probability mark (just barely) in early May, jumping to 59% by the end of last month, and then surging to 83% at yesterday’s close. (For some background on how the analytics are calculated in the chart below, see this primer.)
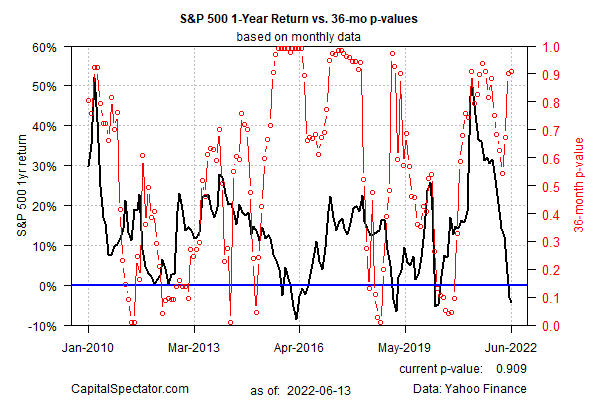
Applying another econometric model to estimate so-called bubble risk shows that this indicator started rebounding in April, effectively warning of a resumption in elevated crash risk. The indicated then jumped to a clear high alert last month, and remains so as of yesterday’s close. (See this 2014 post for some background on the methodology).
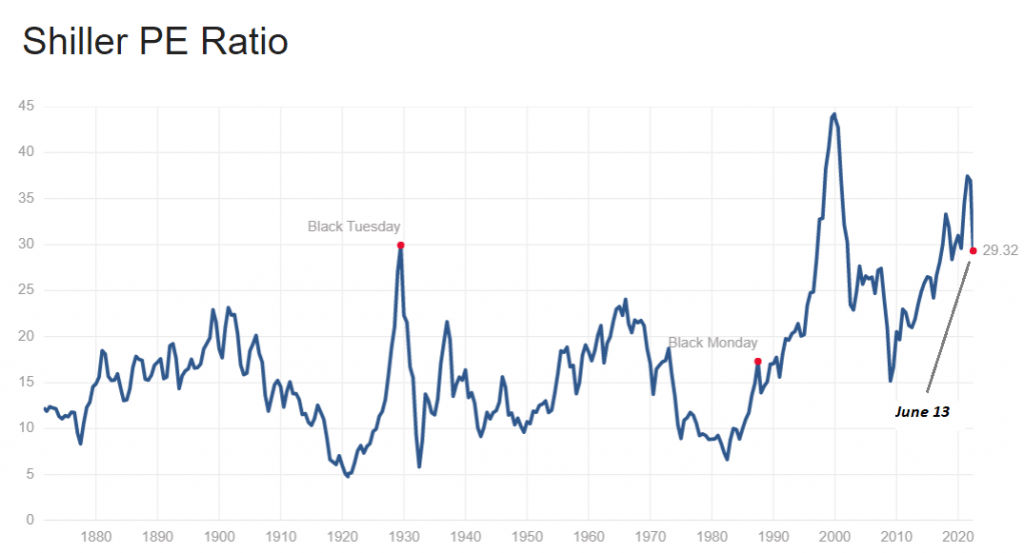
Unsurprisingly, the recent market decline has taken some of the froth off of valuation, although the S&P is still well above levels that can be considered reasonably valued, based on the CAPE ratio.
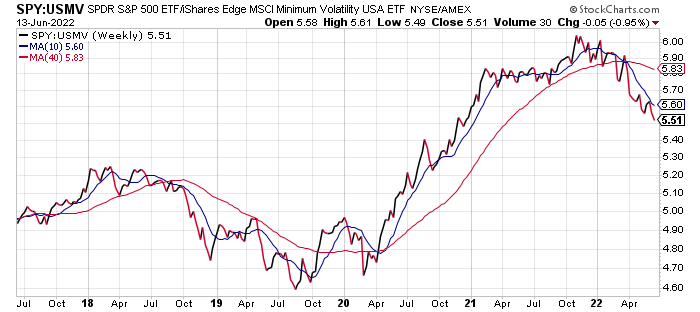
Finally, the ratio for a pair of US equity ETFs continues to suggest that the recent return of risk-off sentiment for stocks continues. Comparing the relative performance of the S&P SPDR (SPY) to iShares MSCI Minimum Volatility (USMV) indicates that market sentiment remains defensive (ratio is falling). When this ratio begins to stabilize and turn higher, that shift will provide a possible early sign that the tide is starting to turn in favor of the bulls again. For the moment, however, such a change is nowhere on the immediate horizon.
Editor’s Note: The summary bullets for this article were chosen by Seeking Alpha editors.
Be the first to comment