

valiantsin suprunovich
After stabilizing in late-June/early July, the US stock market has continued to rebound. The S&P 500 appears on track to post its fifth straight weekly advance, based on trading through yesterday’s close (Aug. 16). Encouraging, although all the risk factors that unleashed a powerful run of selling in the first half of the year are still lurking. That includes high inflation, rising interest rates and elevated geopolitical tension vis-à-vis Russia and China. But for the moment, the trend is friendly, leaving the crowd to decide if this is a bear market rally or the start of a new extended bull run.
In a sign of the times, two of Wall Street’s titans outline opposing views. Morgan Stanley strategists predict that the current rally is only a temporary bounce that will soon give way to bearish forces. JPMorgan disagrees, advising that the rally could run through the end of the year. “Is the rebound getting overdone, and should one go back into value style? Not yet, in our view,” write Mislav Matejka and his team at JPMorgan.
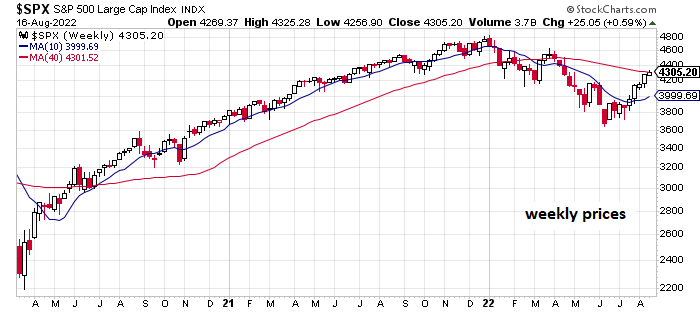
For additional perspective, let’s update our monthly review of a suite of metrics and charts, starting with a weekly view of the S&P 500 Index. The obvious conclusion, there’s a rally unfolding, and it appears to have staying power for the near term, based on the assumption that the upside momentum still looking potent.
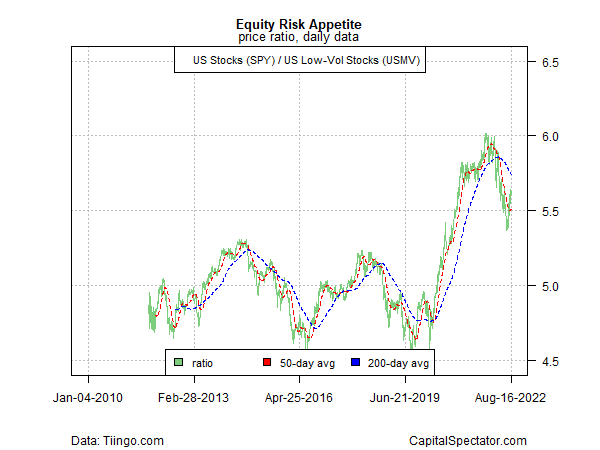
Another encouraging sign: the ratio for a pair US equity ETFs that is a proxy for estimating the trend in the market’s risk-on/risk-off sentiment evolution. The recent rebound in this indicator implies a recovery for risk-on, although the bounce is still in its early stages and has a long way to go before repairing the damage unleashed earlier in the year. Let’s see if this recovery in recent weeks can endure. In particular, I’ll be watching to see how this ratio fares after the Labor Day Holiday for assessing if the summer optimism fades along with the embrace of vacations, barbecues and beachwear.
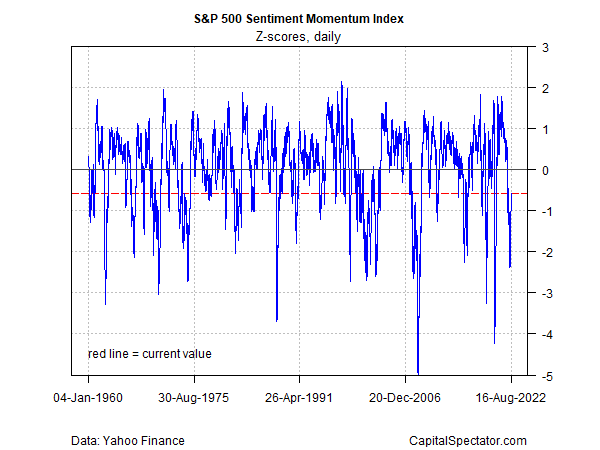
Next up is a metric that provides context for assessing market volatility via CapitalSpectator.com’s S&P 500 Sentiment Momentum Index (for details, see this summary). Last month’s update reported that the market’s correction to date was the steepest since the spring of 2020, which suggested that “odds look reasonable to play a near-term bounce in the market.” A month later, the market is moderately higher, although the overall bias is still net negative, based on this indicator (i.e., below zero). Without a sustainable bull run, the case for another leg up looks less compelling relative to this point in the previous update.
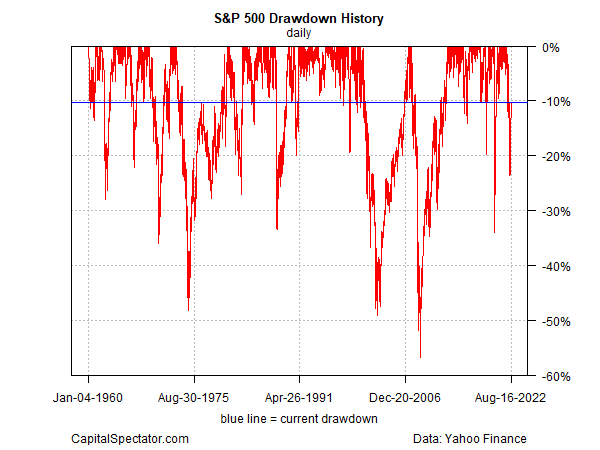
A similar profile is found in the S&P 500’s drawdown, which has recovered from a relatively steep -20%-plus a month ago to a garden-variety -10%.
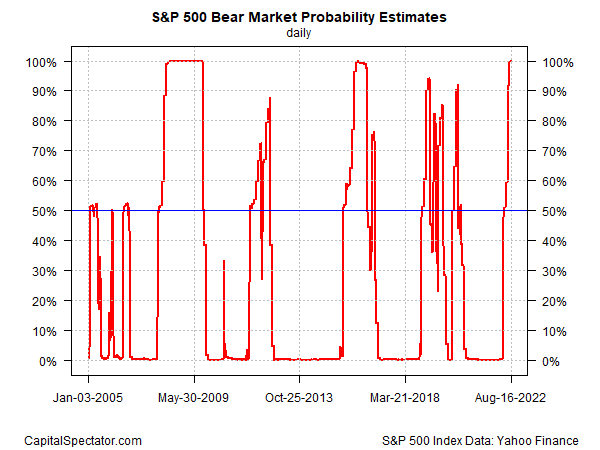
A darker view continues to resonate via the Hidden Markov model (HMM), which still indicates that the S&P 500 has entered bear-market terrain. This indicator first hinted at a bear-market signal by rising above the 50% probability mark in early May. The latest reading is 99.7% (Aug. 16), just fractionally below last month’s update. (For some background on how the analytics are calculated in the chart below, see this primer.)
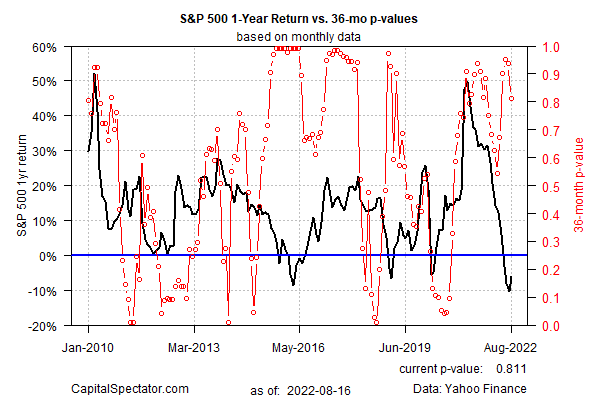
Meanwhile, bubble risk for the S&P 500 has receded modestly after the recent spike. (See this 2014 post for some background on the methodology).
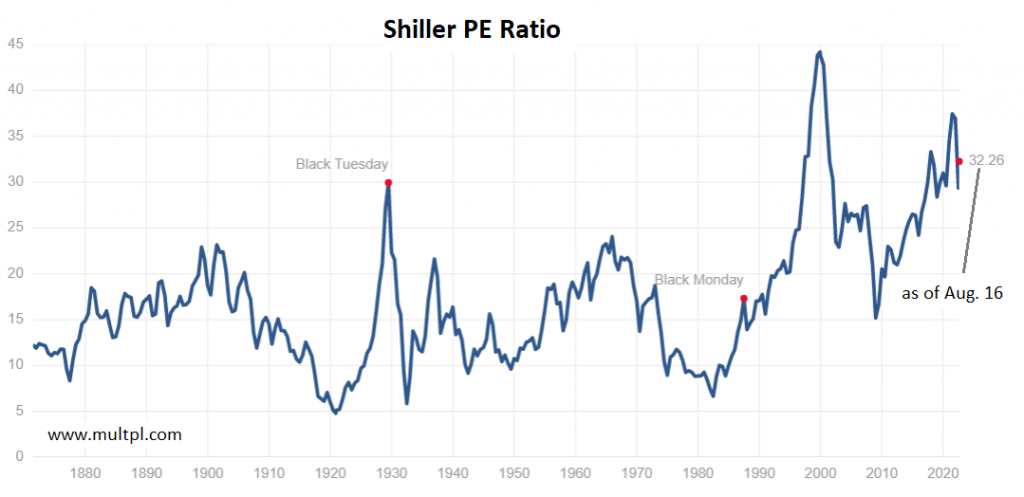
Finally, market valuation remains elevated, based on the Professor Robert Shiller’s Cyclically Adjusted PE Ratio (CAPE Ratio), a.k.a Shiller PE Ratio. The market’s tumble in the first half of the year cut the ratio moderately, but the recent bounce in the S&P 500 lifted this valuation metric, indicating that market valuation remains close to the previous peak.
Editor’s Note: The summary bullets for this article were chosen by Seeking Alpha editors.
Be the first to comment