

US Stock Market Key Points:
- The S&P 500, Dow and Nasdaq 100 close with losses amidst low trading volume
- Investors are coming to terms with the idea that the Fed is fully committed to curb inflation even at the cost of economic pain
- All eyes are on tomorrow’s Consumer Confidence and NFP data on Friday
Most Read:Strategy Webinar: USD Majors, Gold, Oil, Stocks Technical Outlook
Fed Chairman Jerome Powell unleashed a powerful message at the Jackson Hole Economic Symposium on Friday by delivering a loud and clear hawkish statement that generated shockwaves across markets. The Central Bank’s commitment to curb inflation, even at the expense of an economic slowdown, tempered the anticipated pivot that some investors were waiting for, prompting traders to recalibrate their expectations about the tightening cycle. This sparked a brutal sell-off in risk assets.
Today, as investors continued to digest the Fed’s message, major US indices fell sharply at the cash open, but trimmed losses as the session progressed. The absence of major data on the Economic Calendarand low liquidity (UK markets were closed) affected the outcome. At the closing bell, the Dow Jones ended with a loss of 0.57%.
The S&P 500 closed 0.67% lower at 4,030. The Energy Sector advanced 1.54% amid higher crude oil prices. The West Texas Intermediate (WTI) closed above the 200 Day MA today, opening the door for a more bullish price move. With the Jackson Hole symposium in the rearview mirror, investors appear to be focusing on other catalysts such as the OPEC+ comments indicating that a possible supply cut could be considered if the Iran nuclear deal were to be restored. The oil cartel is scheduled to meet again on September 5th.
WTI Daily Price Chart
Light Crude Oil Futures- WTI Daily Chart Price Prepared Using TradingView
In terms of sector performance, Information Technology led the declines dragged by fears of tighter monetary policy. In this context, the Nasdaq 100 closed with a loss of 0.96%. It is noteworthy to mention that the tech index is now marginally trading below the 100 Day Moving Average. Staying below that level would likely keep the sellers in control.
Nasdaq100 Daily Chart
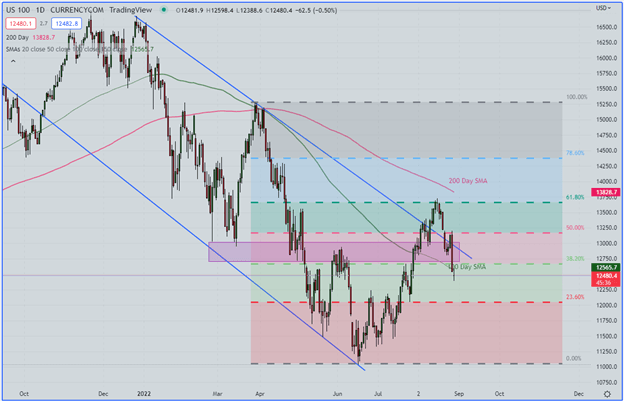
Nasdaq 100 Daily Chart Prepared Using TradingView
Also of interest is the latest Commitment of Traders (COT) report on net positions in S&P 500 futures contracts. As of Tuesday, August 23, ahead of the Jackson Hole Economic Symposium, the report revealed that speculators were still accumulating bearish bets on the index at a rapid clip, a sign of waning confidence in the stock market’s recovery. It will be interesting to see how this week’s positioning changes following the Fed’s hawkish message at the summit.
S&P 500 Daily Chart and Commitment of Traders Report
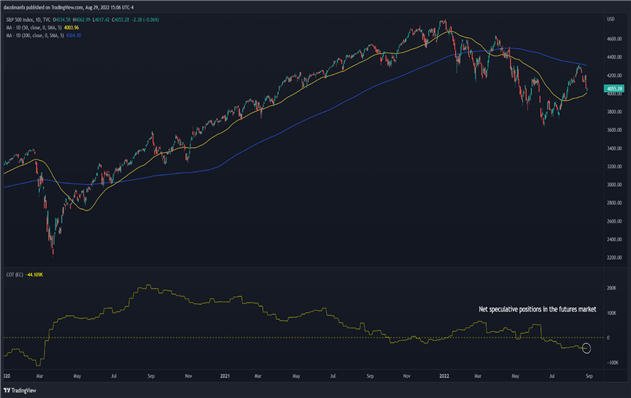
Source: TradingView
Looking ahead, the consumer confidence survey, the ISM data and the August non-farm payroll release will steal the spotlight this week. These reports are expected to provide valuable information on the state of the economy, setting the stage for volatility to remain elevated.
EDUCATION TOOLS FOR TRADERS
- Are you just getting started? Download the beginners’ guide for FX traders
- Would you like to know more about your trading personality? Take the DailyFX quiz and find out
- IG’s client positioning data provides valuable information on market sentiment. Get your free guide on how to use this powerful trading indicator here.
—Written by Cecilia Sanchez-Corona, Research Team, DailyFX
Be the first to comment