

Indices Talking Points:
- Tomorrow brings monthly options expiration and of late, that’s meant more volatility for stocks.
- US equities have held below resistance this week after a Tuesday breakout quickly pulled back. The S&P 500 opened today’s session right at a key support and put in an early-session bounce, helping to form a short-term falling wedge formation.
- The analysis contained in article relies on price action and chart formations. To learn more about price action or chart patterns, check out our DailyFX Education section.
Recommended by James Stanley
Get Your Free Equities Forecast
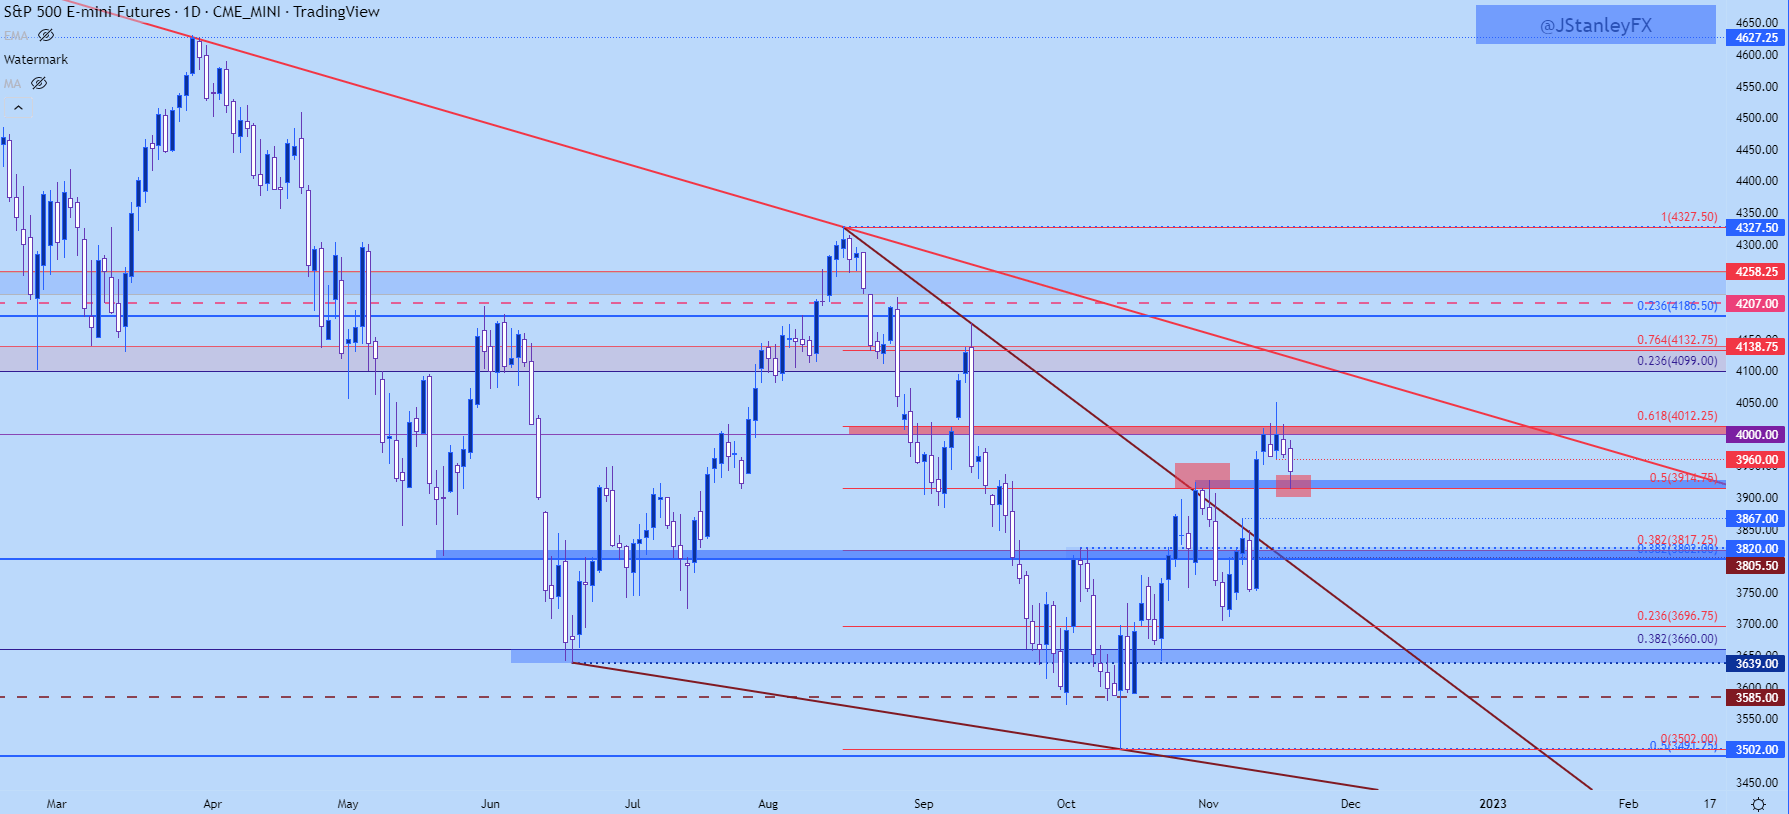
US equities started today’s session on their back foot after futures had sold off overnight. By the time equity trading opened in the US at 9:30 AM ET, the S&P 500 had already started to dig into a key support level at 3915, which is the 50% marker of the August-October move. This is the same study from which resistance has shown, as the 61.8% Fibonacci retracement of that move plots at 4012 and along with the 4k psychological level, makes up a resistance zone that’s been in-play all week.
This zone came back into the picture last Friday, as stocks continued their surge after the Thursday CPI release. As I had written in this week’s forecast, this retained bullish breakout potential as it was a higher-high on the heels of the higher-low that had set earlier last week.
There was a bit of breakout at that zone on Tuesday, but that was cut short on news of a missile landing in Poland as a quick shot of risk aversion entered the picture. And even though that was priced-out elsewhere, the S&P 500 has just continued to obediently stick below that resistance zone and that’s led to this morning’s pullback which landed right in a spot of support at prior resistance.
S&P 500 Daily Price Chart
Chart prepared by James Stanley; S&P 500 on Tradingview
S&P Shorter-Term
There have been a series of lower-highs develop since that move on Tuesday, and there’s been lower-lows, as well, although it hasn’t quite been even.
This makes for a falling wedge formation with support holding right at that prior spot of resistance that was in-play ahead of the Fed earlier this month. And given OpEx, which can keep volatility rolling through tomorrow’s close, this keeps the door open for a bounce move with focus on a re-test of the 4k zone. The 3960 spot can act as shorter-term resistance as this is an area of prior support that came into play later in today’s session. And if bulls can stretch, there’s a bigger zone of resistance sitting overhead around the 4100 level, as looked at in this week’s technical forecast.
On the underside of price action, if sellers can force a breach of 3915, next support on my chart is around 3867, after which the familiar zone comes back into the picture around the 3802-3820 zone.
Recommended by James Stanley
Building Confidence in Trading
S&P 500 Four-Hour Chart
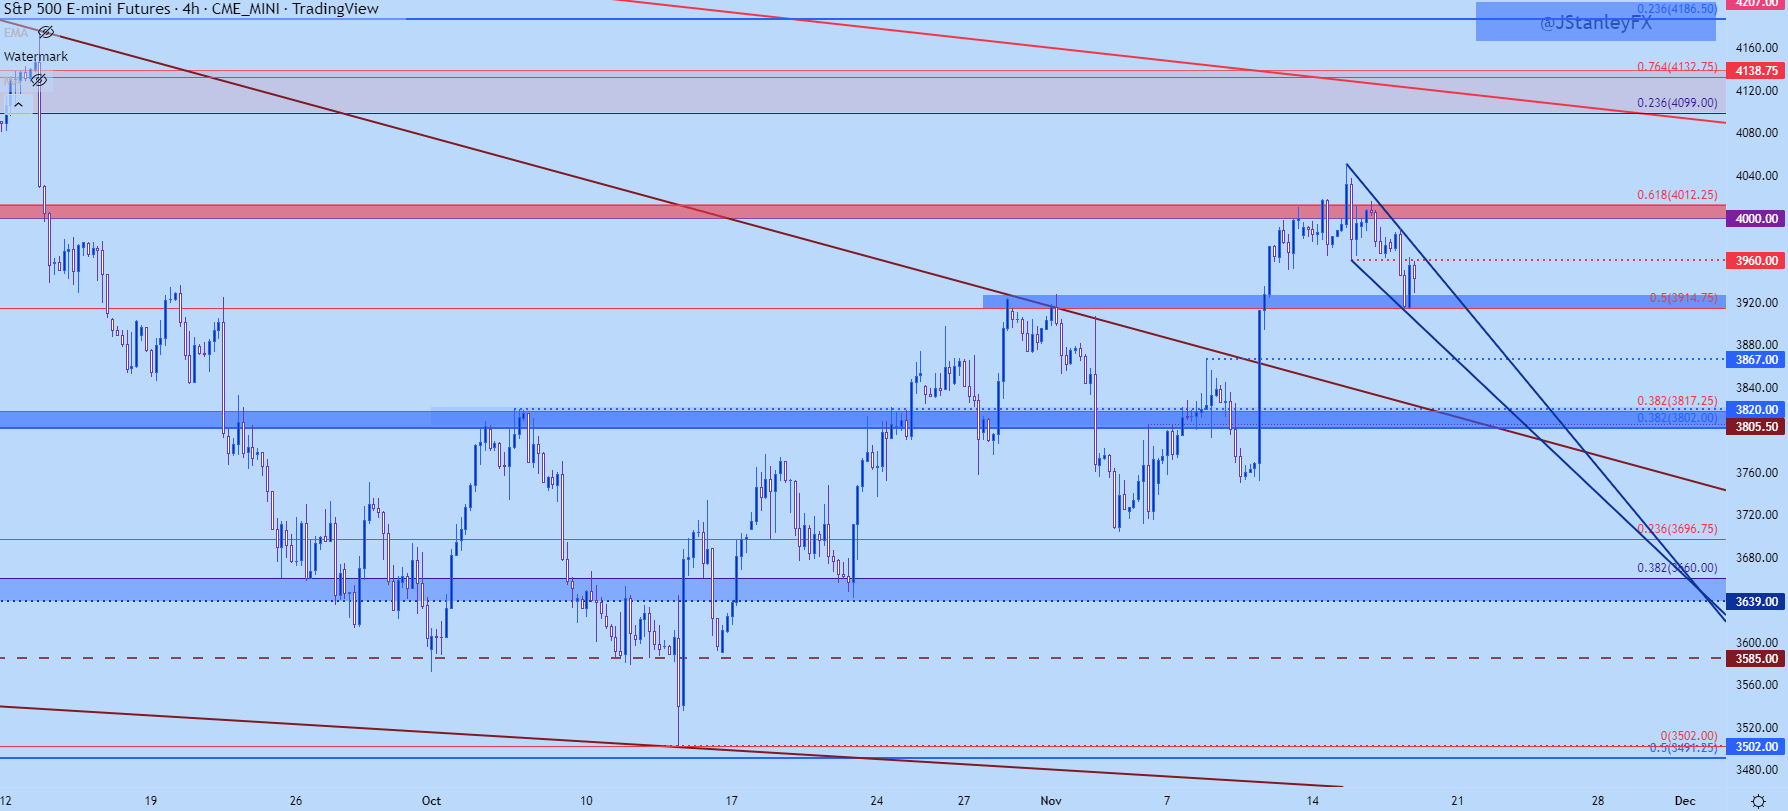
Chart prepared by James Stanley; S&P 500 on Tradingview
— Written by James Stanley, Senior Strategist, DailyFX.com & Head of DailyFX Education
Contact and follow James on Twitter: @JStanleyFX
Be the first to comment