

S&P 500 OUTLOOK:
- U.S. stocks start the weak with large losses, dragged down by worries that the rapid spread of the omicron variant will dent economic activity and slow the global recovery
- The S&P 500 falls 1.14% at the market close, with cyclical and reopening stocks taking the biggest hit
- The development of a double top pattern in the S&P 500 daily chart points to further downside over the near term
Most read: Euro Technical Analysis – Looking to Sell Rallies in EUR/GBP, EUR/JPY, EUR/USD
U.S. stocks fell Monday on growing worries that the coronavirus pandemic will undermine economic activity and weaken the global recovery, exacerbating supply chain snags and thus inflation.Concerns that President Biden may not be able to get his “Build Back Better” agenda passed by the Senate also seemed to weigh on sentiment.
At the market close, the S&P 500 retreated 1.14% to end the day at 4,568, but well above the session low of 4,531. Meanwhile, the Nasdaq 100 sank1.1% to 15,627, its lowest level since early December. The Dow Jones also suffered heavy losses, dropping 1.23% to 34,932, as traders rushed to trim positions in economically sensitive stocks that may be negatively affected by the worsening healthcare crisis outlook.
The recently discovered COVID-19 Omicron variant has become the main source of anxiety for investors, as the heavily mutated strain is spreading like wildfire around the world with cases doubling within 1.5 to 3 days in areas of community spread, according to the World Health Organization.
Although preliminary data suggest that omicron may be milder than Delta, its greater transmissibility is likely to steepen the infection curve, accelerating hospitalizations during the winter months in the northern hemisphere, a situation that may overburden the healthcare system andmake tighter restrictions necessary to contain outbreaks.
Many European countries have already adopted stricter control measures, introducing draconian travel restrictions and social curbs at the height of the holiday period to fight the surge in virus counts. The Netherlands has even gone a step further, becoming the first EU member to re-enter a multi-week nationwide lockdown, shutting down non-essential stores, bars, and restaurants until January 14th.
The U.S. is a few weeks behind Europe in terms of omicron spread, but scientists expect a similar pattern to develop heading into January. This means one thing: stringent mitigation rules are likely to be reimposed on this side of the Atlantic, perhaps on a state-by-state basis or, in the worst case, at the federal level if hospitals begin to become overwhelmed.
The prospects of new lockdowns or tough business restrictions should weigh on the U.S. equity market in the near term via the sentiment channel, with cyclical and reopening stocks most sensitive to a significant pullback before year–end, just as liquidity shrinks ahead of the holidays and creates a trading environment that can amplify market moves.
A large sell-off may become a good opportunity to buy the dip on stocks that have dropped too much too soon, but timing the bottom may be a difficult task amid increased pandemic uncertainty and looming monetary policy risks, so traders should exercise caution and follow coronavirus and Fed related news closely before diving in headfirst.
S&P 500 TECHNICAL ANALYSIS
The daily chart of the S&P 500 appears to show the development of a spooky bearish configuration: a double top pattern. This technical formation is validated once the price completes its capital “M” shape and breaks below its neckline, the lowest intermediate point dividing its two peaks. In our case, the neckline sits near the 4,500 psychological level. Should the S&P 500 fall below this key support, traders should brace for a significant pullback as this event could pave the way for a move towards the October low at 4,278. On the flip side, if dip buyers resurface and the index rebounds from current levels, the first resistance to consider is seen at 4,631, followed by the record high near 4,700.
S&P 500 TECHNICAL CHART
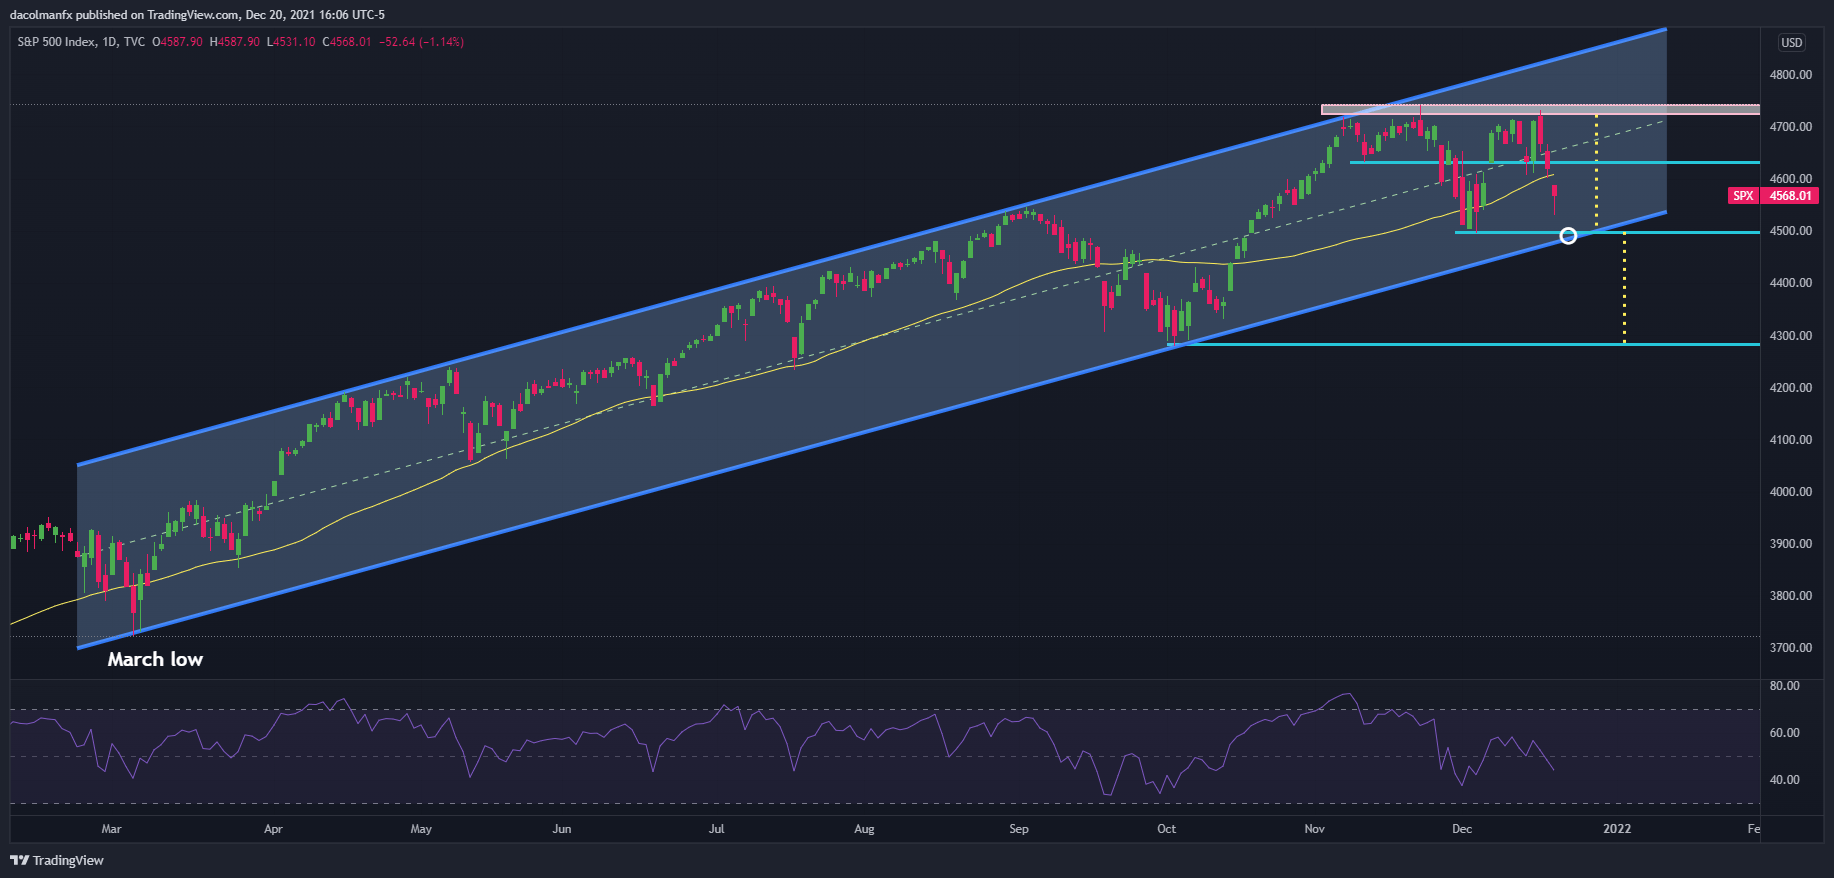
S&P 500 (SPX) Chart by TradingView
EDUCATION TOOLS FOR TRADERS
- Are you just getting started? Download the beginners’ guide for FX traders
- Would you like to know more about your trading personality? Take the DailyFX quiz and find out
- IG’s client positioning data provides valuable information on market sentiment. Get your free guide on how to use this powerful trading indicator here.
—Written by Diego Colman, Contributor
Be the first to comment