

S&P 500, NIKKEI 225, ASX 200 INDEX OUTLOOK:
- Dow Jones, S&P 500 and Nasdaq 100 closed +0.30%, +0.34%, and +0.16% respectively
- The June FOMC minutes showed that conditions have not been met for the Fed to start tapering
- The VIX volatility index stayed low. Crude oil fell for a second day amid supply uncertainty
FOMC Minutes, VIX, Jobless Claims, Oil, Asia-Pacific at Open:
Wall Street stocks climbed alongside the US Dollar after June’s FOMC meeting minutes was released. Without much surprise, the minutes showed that conditions of “substantial further progress” toward the Fed’s full employment and price stability goals have not been met to warrant scaling back its monthly asset purchases. The central bank also reiterated the view that the recent rise in inflation might be “transitory”, although price levels are rising faster than expected. The S&P 500 and Nasdaq 100 indexes both closed at all-time highs.
The energy sector was lagging behind on Wednesday as crude oil prices fell for a second day amid uncertainties surrounding output hikes fromOPEC+. The American Petroleum Institute (API) reported a large 7.98-million-barrel draw in crude inventories for the week ending July 2nd, underscoring strong demand for fuel as the summer driving season peaks. This also marks a 7th consecutive weekly fall in US stockpiles, which may provide some support for oil prices.
Market volatility remained subdued as the VIX index extended lower to the pre-pandemic perch (chart below). This may provide a backdrop for large price swings if today’s initial weekly jobless claimsdata delivers a big surprise. Investors are anticipating 350k unemployment claims to be filed last week. A lower reading may strengthen Fed tapering stimulus prospects and thus lead the US Dollar higher, whereas the opposite may do the reverse.
Volatility Remains Subdued
Asia-Pacific markets are mixed at the beginning of Thursday’s trading session. Futures in Japan, Hong Kong, South Korea, Malaysia and Thailand are in the red, whereas those in mainland China, Australia, Taiwan, Singapore are in the green.
Japan’s Nikkei 225 index looks set to extend lower after falling 0.96% on Wednesday. Stocks in Tokyo are under selling pressure as investors mull gains in new coronavirus cases in Japan caused by the Delta variant of the Covid-19 virus. A stronger Japanese Yen may also weigh on equity market performance as it makes the country’s exports more expensive to overseas buyers.
Looking ahead, ECB monetary policy meeting accounts lead the economic docket alongside initial weekly jobless claims data. Find out more from DailyFX economic calendar.
Looking back to Wednesday’s close, 8 out of 11 S&P 500 sectors ended higher, with 66.1% of the index’s constituents closing in the green. Materials (+1.01%), industrials (+1.00%) and healthcare (+0.62%) were among the best performers, whereas energy (-1.72%) trialed behind.
S&P 500 Sector Performance 30-06-2021
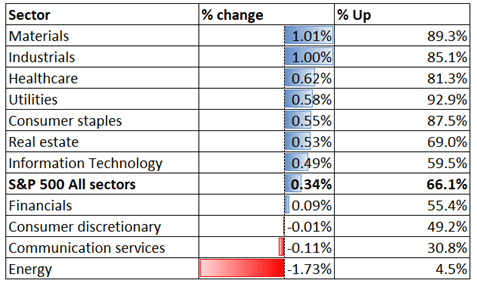
Source: Bloomberg, DailyFX
S&P 500 IndexTechnical Analysis
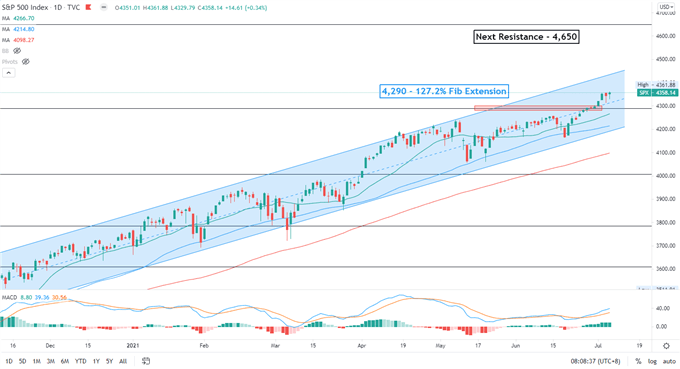
The S&P 500 index breach above a key resistance level at 4,290 and thus opened the door to further upside potential. The next key resistance level can be found at 4,650 – the 161.8% Fibonacci extension. The overall trend remains bullish-biased as prices continue to trend higher within a “Ascending Channel” formed since November.
S&P 500 Index– Daily Chart
Nikkei 225 Index Technical Analysis:
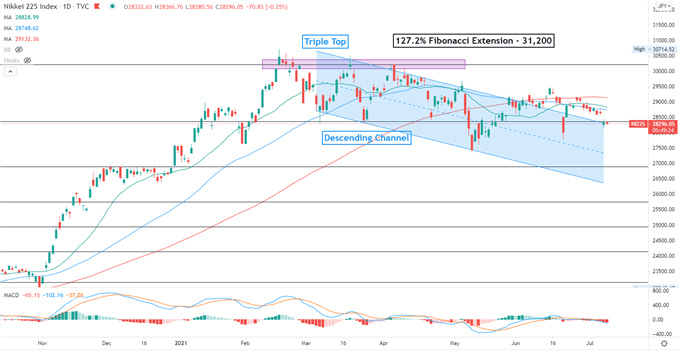
The Nikkei 225 index failed to breach the 100-day SMA line and has since entered consolidation. The index is testing the ceiling of the “Descending Channel” for support, breaching which may open the door for further losses. The MACD indicator formed a bearish crossover and trended lower, suggesting that bearish momentum is dominating.
Nikkei 225 Index – Daily Chart
ASX 200 Index Technical Analysis:
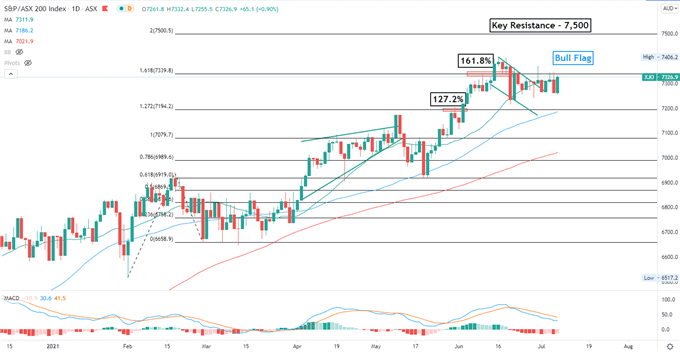
The ASX 200 index pulled back from its all-time highs and entered a technical correction. Prices have likely formed a “Bull Flag” pattern, which hints at further upside potential after a period of consolidation. Immediate support levels can be found at 7,200 – the 127.2% Fibonacci extension. The overall bullish trend remains intact as suggested by the upward-sloped SMA lines.
ASX 200 Index – Daily Chart
— Written by Margaret Yang, Strategist for DailyFX.com
To contact Margaret, use the Comments section below or @margaretyjy on Twitter
Be the first to comment