

US STOCKS OUTLOOK:
- S&P 500, Dow Jones, Nasdaq 100 lurch lower on Thursday, but finish the month with decent gains
- On a quarterly basis, all three indices suffer heavy losses
- In this article we look at the key technical levels to watch in the Dow and Nasdaq 100
Most read: Crude Oil Price Forecast – Volatility Here to Stay. What’s Next?
U.S. stocks lurched lower on the last day of the first quarter and month, falling for the second consecutive session on negative rebalancing flows and cautious sentiment after the Federal Reserve’s preferred inflation measure rose to the highest level since 1983.
When it was all said and done, the S&P 500 tanked1.57% to 4,530, while the Dow Jones sank 1.56% to 34,678. The Nasdaq 100, for its part, plunged 1.55% to 14,838, falling further below its 200-day simple moving average. All three indexes closed March with solid gains, but posted their worst quarterly performance since Q1 2020, following the January and February sell-off triggered by rising interest rates, geopolitical tensions, rising inflation and cooling economic activity.
Focusing on Thursday’s trading bias, the mood was slightly pessimistic after March Core PCE jumped to 5.4% y/y, its highest level in nearly 40 years. While broadening inflationary forces are a concern, the data did not initially elicit much of a market response as a steep pullback in oil helped calm some nerves. By way of context, WTI and Brent plunged more than 3% after the White House announced that it will release one million barrels of crude per day for the next six months from the country’s Strategic Petroleum Reserve to boost supplies and bring prices down.
Looking ahead, all eyes will be on Friday’s U.S. nonfarm payrolls report. Consensus expectations suggest that the U.S. economy created 490,000 jobs in March and that the unemployment rate fell a tenth of a percent to 3.7%, the lowest level in more than two years.
While a good jobs report will reinforce the need to withdraw accommodative policy aggressively in the coming months, it will also ease worries that the economy is headed for a recession. Lately, the steady flattening of the yield curve and the prospect of an inversion in the 2s10s stretch have raised the possibility of an economic downturn in the not-too-distant future, leading traders to become a bit more defensive. In any case, we will know more tomorrow, but one thing is clear: if the employment picture stays healthy, consumer spending is likely to remain supported, creating a tailwind for corporate earnings and thus the stock market.
DOW JONES TECHNICAL ANALYSIS
After failing to clear cluster resistance spanning from 35,210 to 35,300, the Dow Jones has begun to retreat towards a key floor in the 34,652 area. If sellers drive the blue-chip index below this support in the coming sessions, price could be on its way to test the 200-day simple moving average, followed by 34,095. On the flip side, if buyers return and push the index higher, resistance appears at 35,210/35,300, but a climb above this ceiling could pave the way for a move towards the February high near 35,825.
Dow Jones Chart prepared in TradingView
NASDAQ 100 TECHNICAL ANALYSIS
After losing its 200-day simple moving average, the Nasdaq 100 has accelerated its decline and broken below Fibonacci support at 14,901. If the bears retain control of the market in the coming sessions, selling pressure could intensify, triggering a larger selloff and exposing the 14,456 floor.
On the upside, if buyers resurface and spark a bullish reversal, initial resistance appears at 14,901, followed by 15,145, the 200-day SMA. If the Nasdaq 100 clears these barriers, bulls could launch on attack on 15,345, the 61.8% Fibonacci retracement of the November 2021/March 2022 decline.
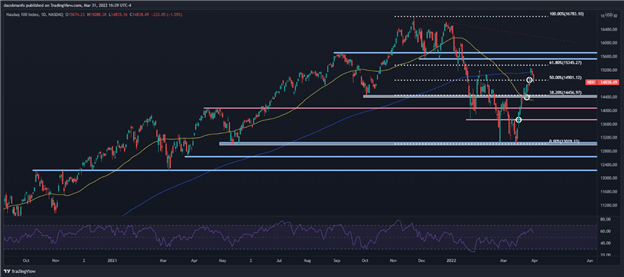
Nasdaq 100 (NDX) chart prepared in TradingView
EDUCATION TOOLS FOR TRADERS
- Are you just getting started? Download the beginners’ guide for FX traders
- Would you like to know more about your trading personality? Take the DailyFX quiz and find out
- IG’s client positioning data provides valuable information on market sentiment. Get your free guide on how to use this powerful trading indicator here.
—Written by Diego Colman, Contributor
Be the first to comment