

US STOCKS OUTLOOK:
- The S&P 500 and Nasdaq 100 lose ground at the start of the month, ending a three-day winning streak
- July manufacturing activity grows at the weakest pace in two years, signaling that the economy continues to cool
- The U.S. non-farm payrolls report will be a key price action catalyst for the stock market this week
Most Read: S&P 500, Nasdaq 100 and Dow Jones Forecast for the Week Ahead
U.S. stocks were subdued at the start of August, amid a somewhat cautious mood on Wall Street following the strong upswing seen recently in the space. After all the trading session’s gyrations, the S&P 500 retreated 0.28% to 4,119, stalling near a key technical resistance zone and ending a three-day winning streak. The Nasdaq 100, meanwhile, edged down 0.06% to 12,941, but the pullback in Treasury yields limited weakness in the technology sector.
Although upside momentum appears to be fading in the equity universe, it is possible that this is just a temporary respite after the blockbuster gains of the past few weeks. By way of context, stocks surged last month, with the S&P 500 up 9.11%, its third best July in history. This may bode well for short- term returns from a seasonal standpoint. While past performance is not indicative of future results, when the index rises in a “midterm year” in July, August is up 77% of the time on average, based on data going back to 1928.
Focusing on other catalysts, the economy continues to weaken, raising recession risks and complicating the outlook for risk assets, such as stocks and cyclical commodities. July ISM manufacturing data released this morning confirmed this assessment by showing the slowest pace of expansion in factory activity in two years.
While weaker manufacturing output is concerning, given that the sector accounts for approximately 12% of U.S. GDP, there was a bright spot in the July ISM survey. According to the report, the gauge of prices paid for materials used in the production process plunged 18.5 points to 60.0, the fourth largest decline on record. Easing input costs, if sustained, could translate into lower CPI numbers in the coming months, paving the way for the Federal Reserve to adopt a less hawkish policy stance sometime this fall.
Looking ahead, the earnings season will remain in the spotlight this week, although there are important risk events on the economic calendar worth paying attention to, such as the July nonfarm payrolls report due for release on Friday. Although a lagging indicator, the employment survey can provide valuable insight into the health of the labor market and hiring dynamics amid rapidly slowing economic growth.
S&P 500 TECHNICAL ANALYSIS
The S&P 500 has rallied aggressively over the past few weeks, rising more than 13% from its June’s lows, a sign that market sentiment may be on the mend. After the recent advance, the index seems to be approaching the 4,160/4,175 band, a key ceiling in play. If buyers manage to clear this hurdle decisively in the near-term, bullish momentum could accelerate, setting the stage for a move towards channel resistance and the 200-day moving average around the 4,300 area.
On the flip side, if sellers return and spark a bearish reversal, initial support appears at 4,065. If this floor were to be taken out, traders should prepare for the possibility of a pullback towards 4,065, near the 50-day simple moving average.
S&P 500 TECHNICAL CHART
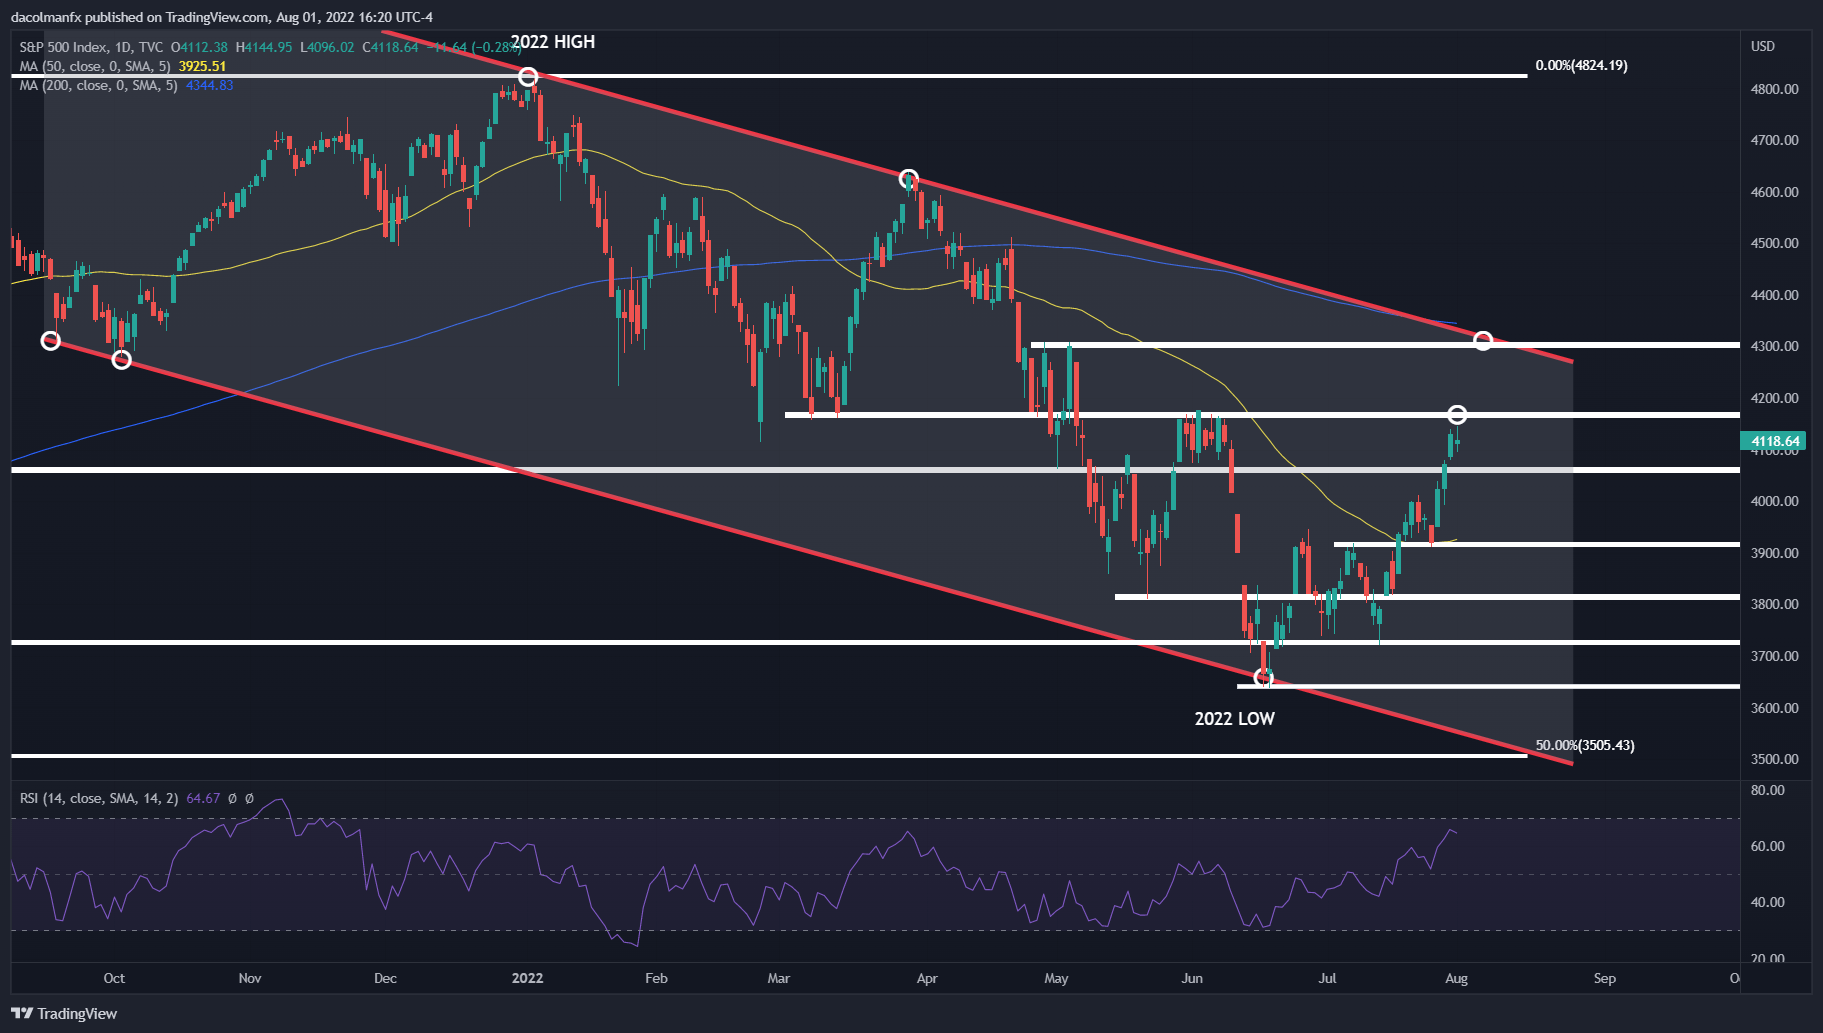
S&P 500 Technical Chart Prepared Using TradingView
EDUCATION TOOLS FOR TRADERS
- Are you just getting started? Download the beginners’ guide for FX traders
- Would you like to know more about your trading personality? Take the DailyFX quiz and find out
- IG’s client positioning data provides valuable information on market sentiment. Get your free guide on how to use this powerful trading indicator here.
—Written by Diego Colman, Market Strategist for DailyFX
Be the first to comment