

Gearstd/iStock via Getty Images
Thesis
Recent price corrections have brought tech valuations to a more reasonable range. The iShares Semiconductor ETF (NASDAQ:SOXX) has historically been traded at a premium relative to the overall market. For example, back in March 2022, SOXX was trading at a P/E of about 31.5x and SPDR S&P 500 Trust ETF (SPY) at about 26.5x according to Yahoo Finance data. However, recent corrections have brought SOXX P/E to the current level of 15.45x, about a 17% discount from the S&P 500’s 18.4x.
And you will see next that the discount from the NASDAQ 100 index, represented by the Invesco QQQ ETF (NASDAQ:QQQ), is even larger. To wit, SOXX suffered a total loss of 18.6% YTD and QQQ about 22% as you can see from the following chart. Combined with earnings changes, the valuation of SOXX now stands at 15.45x and QQQ at 22.01x, a discount of almost 30%.
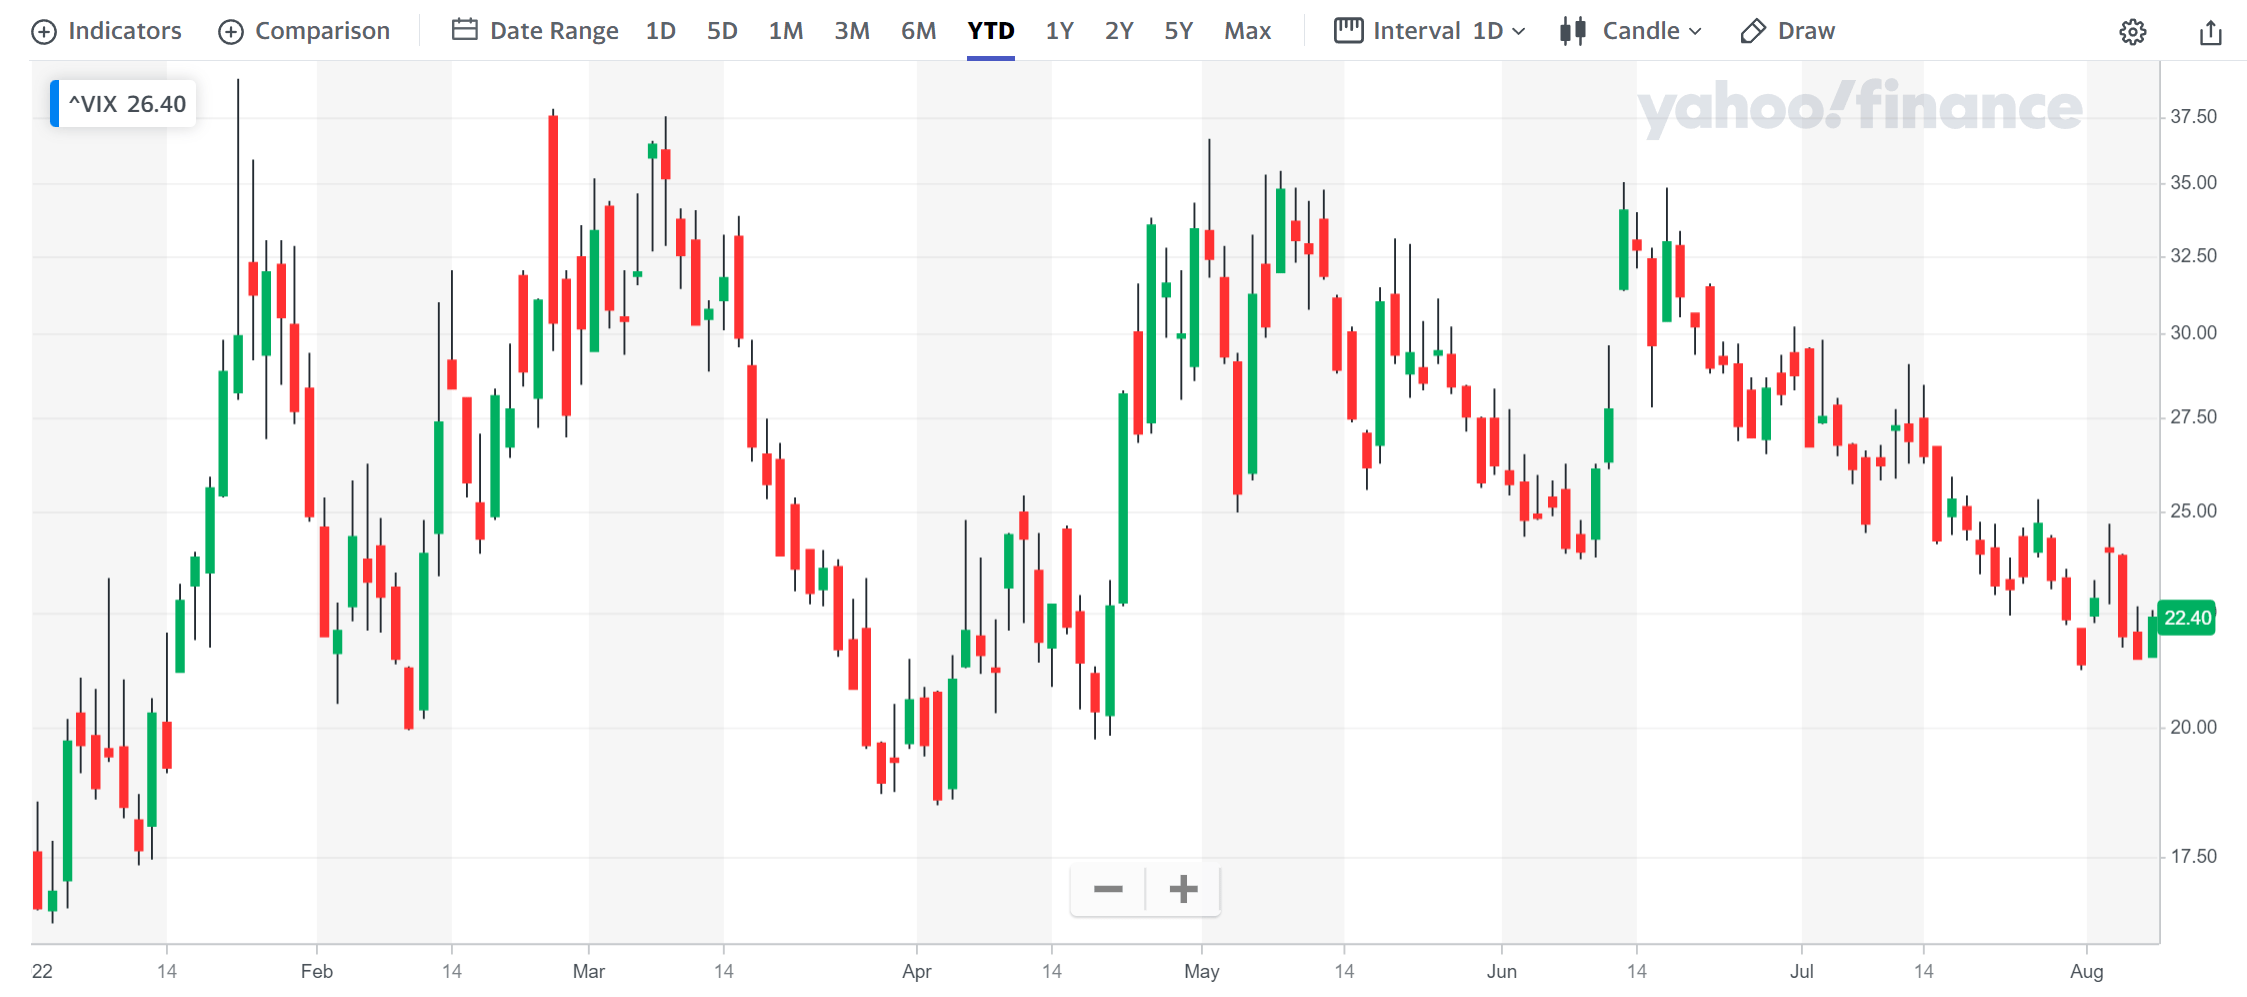
Besides the valuation compression, the volatility has also become much quieter recently, adding another reason for considering a heavier bet on the tech sector. As you can see from the second chart below, the volatility index has subdued substantially YTD, decreasing from the 30+ level routinely seen at the earlier part of the year to the current level of 22.4x. To provide broader context, a volatility of 30 is at the top 93% percentile of historical volatility. While 22 is at about 71% percentile. The major reason for the quieter volatility is Fed’s recent rate movements and comments, which are consistent with market expectations and also provide clarity for the near term. And as detailed in our earlier article, when volatility is high, it’s a good idea to hunker down and vice versa.
Against this backdrop, we will look at the pros and cons of SOXX and QQQ more closely next.
Seeking Alpha Yahoo Finance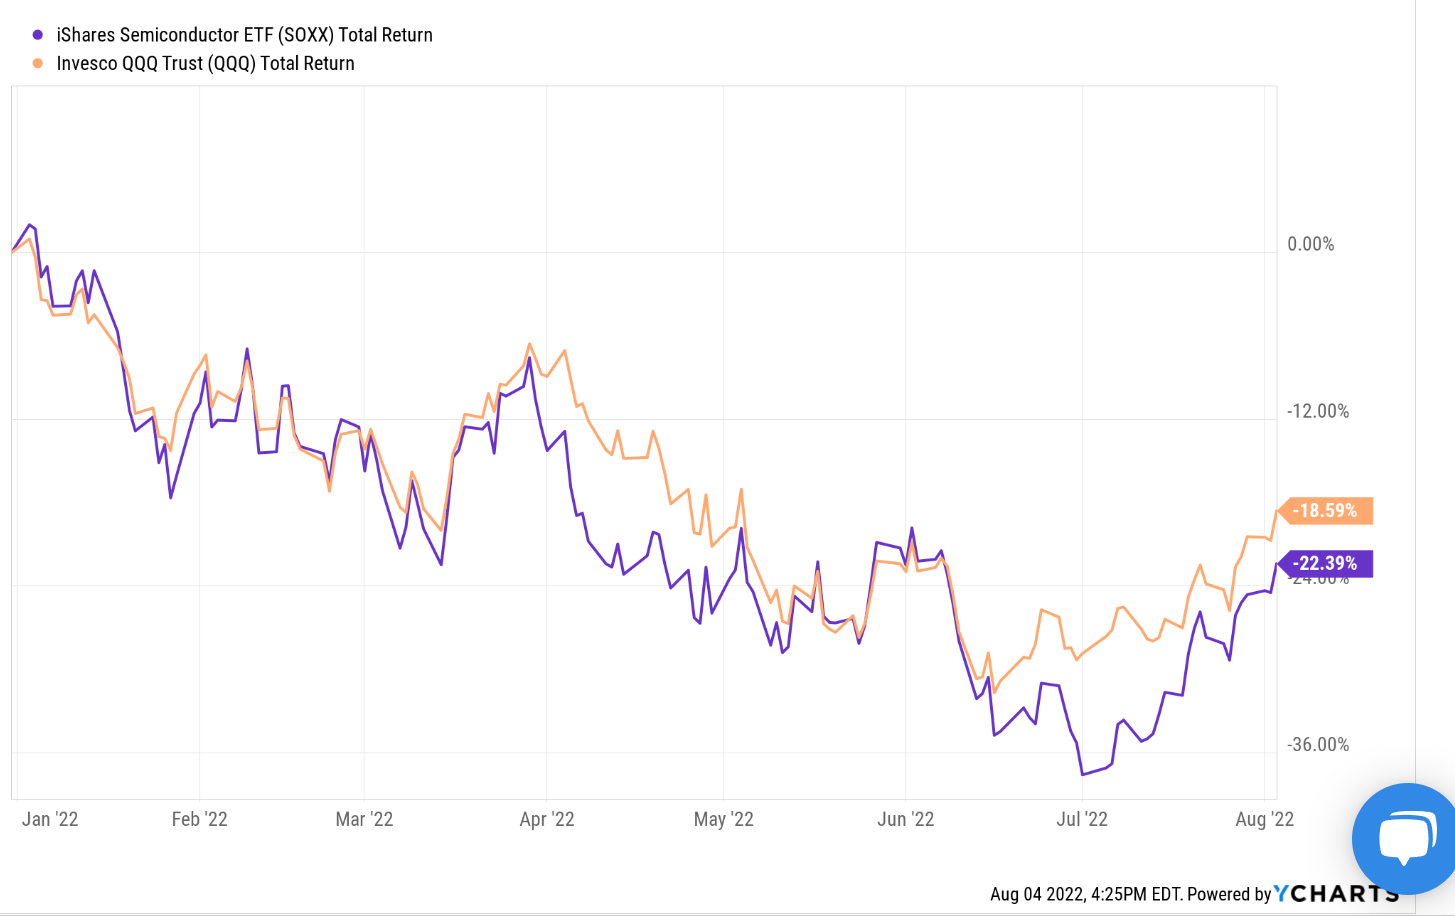
SOXX vs QQQ: basic information
QQQ needs little introduction. It is one of the most popular funds tracking the Nasdaq-100 Index. However, as aforementioned, many investors are unaware that QQQ is not a pure-tech play because the NASDAQ 100 index tracks the largest NON-FINANCIAL companies listed on the Nasdaq and many of these companies are not tech companies. I will table this for now and come back to this point later.
SOXX, in contrast, is a pure tech play completely concentrated in the semiconductor sector. As detailed in the fund description:
The iShares Semiconductor ETF seeks to track the investment results of an index composed of U.S.-listed equities in the semiconductor sector. It provides exposure to U.S. companies that design, manufacture, and distribute semiconductors and targeted access to domestic semiconductor stocks. It is used to express a sector view.
Source: ETF.com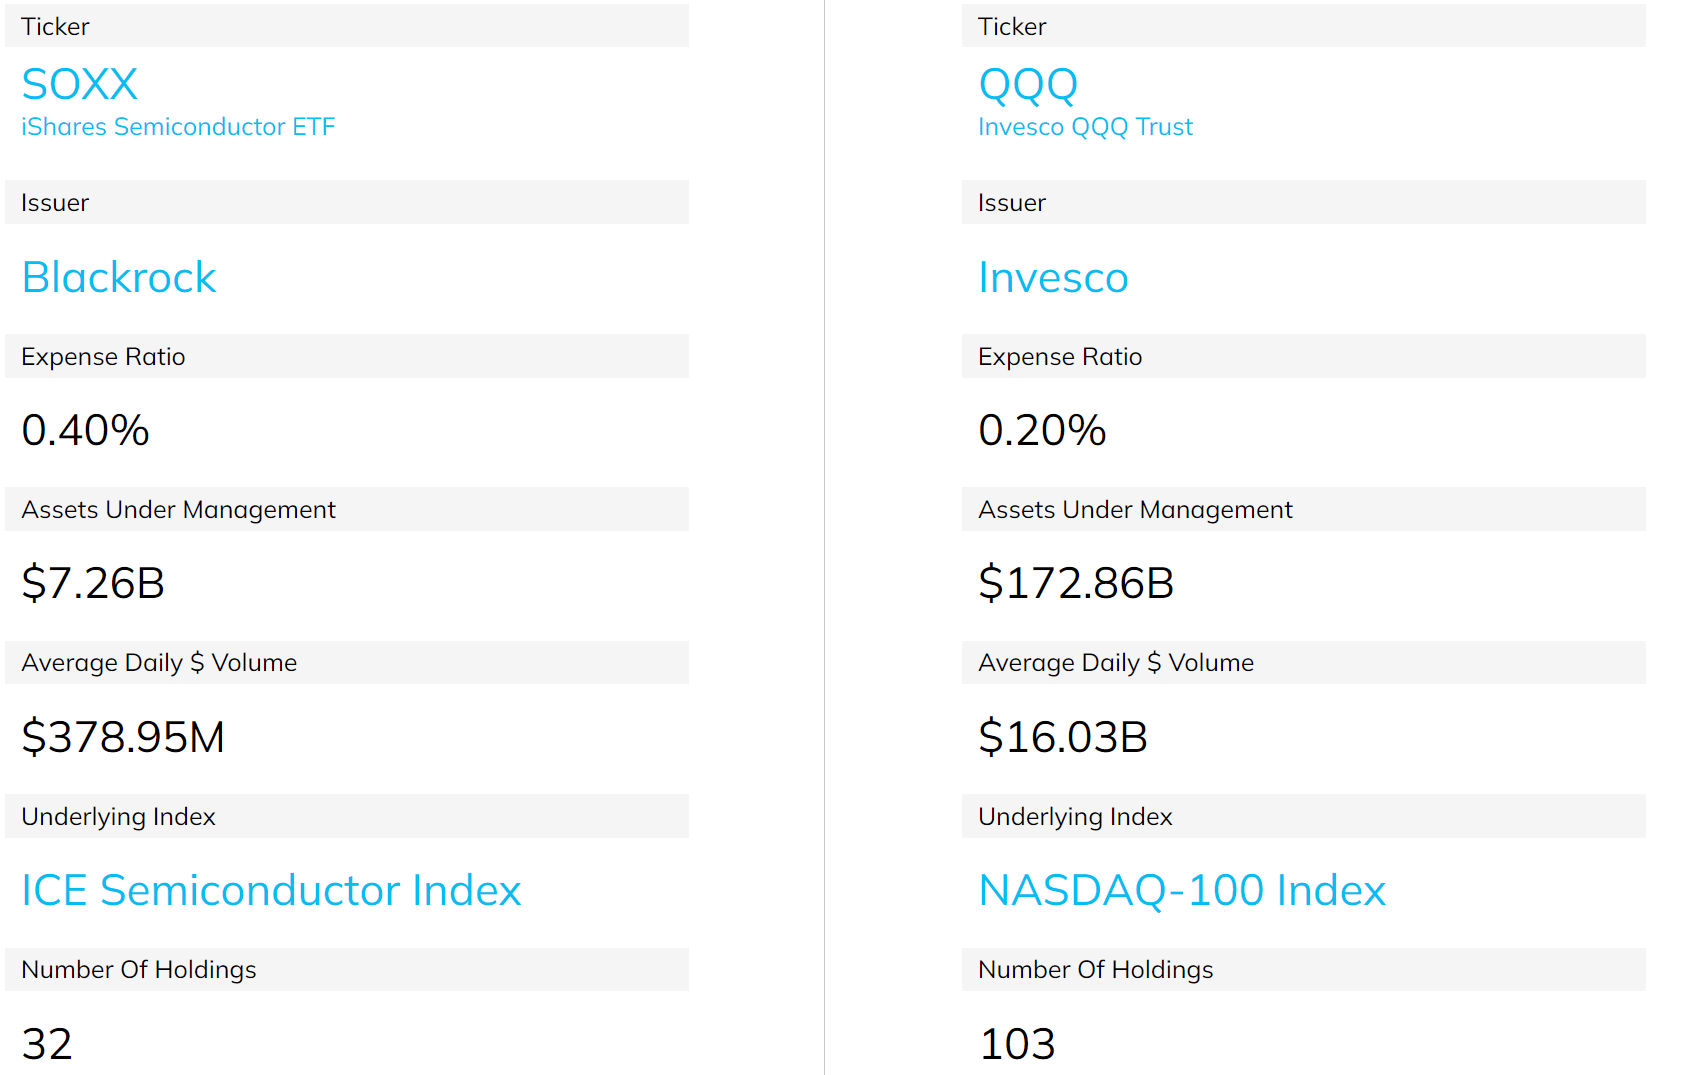
SOXX vs QQQ: Past performance and risks
Both the SOXX and QQQ funds have delivered handsome returns in the past as you can see from the chart below. SOXX has delivered an annual return of 10.12% since its inception in 2022, and QQQ has delivered a slightly higher CAGR of 11.5%. Both outperformed the S&P 500 by a good margin of about 2% to 3%.
When compounded over the past decade, such an alpha has accumulated into a sizable difference in total return. With dividends reinvested, SOXX has delivered a total return of 720% and QQQ more than 930%, far higher than the S&P 500’s 525%.
Although the downside is their price volatilities. We’ve already seen a glimpse of their price volatility in the short term in the previous section already in the past year. As you can see in the long term, both SOXX and QQQ have suffered much larger volatility than the S&P 500 too. And SOXX in particular has suffered by far the largest volatility. In terms of standard deviation, it’s 27% is almost double that of the SP 500 (14%) and has also been higher than QQQ by about a whole 8%. In terms of worst-year performance, SOXX suffered a 51% loss (which will take more than a 100% rally to breakeven), which was 10% more than QQQ and 14% more than SP 500. And finally, in terms of maximum drawdown, SOXX’s 62% maximum drawdown (which takes a 163% rally to break even) is truly nerve-wracking. In contrast, both QQQ and SP 500 were in the 50% range.
And next, we will see that the root cause of the volatilities is in their fundamental indexing methods.
Portfolio Visualizer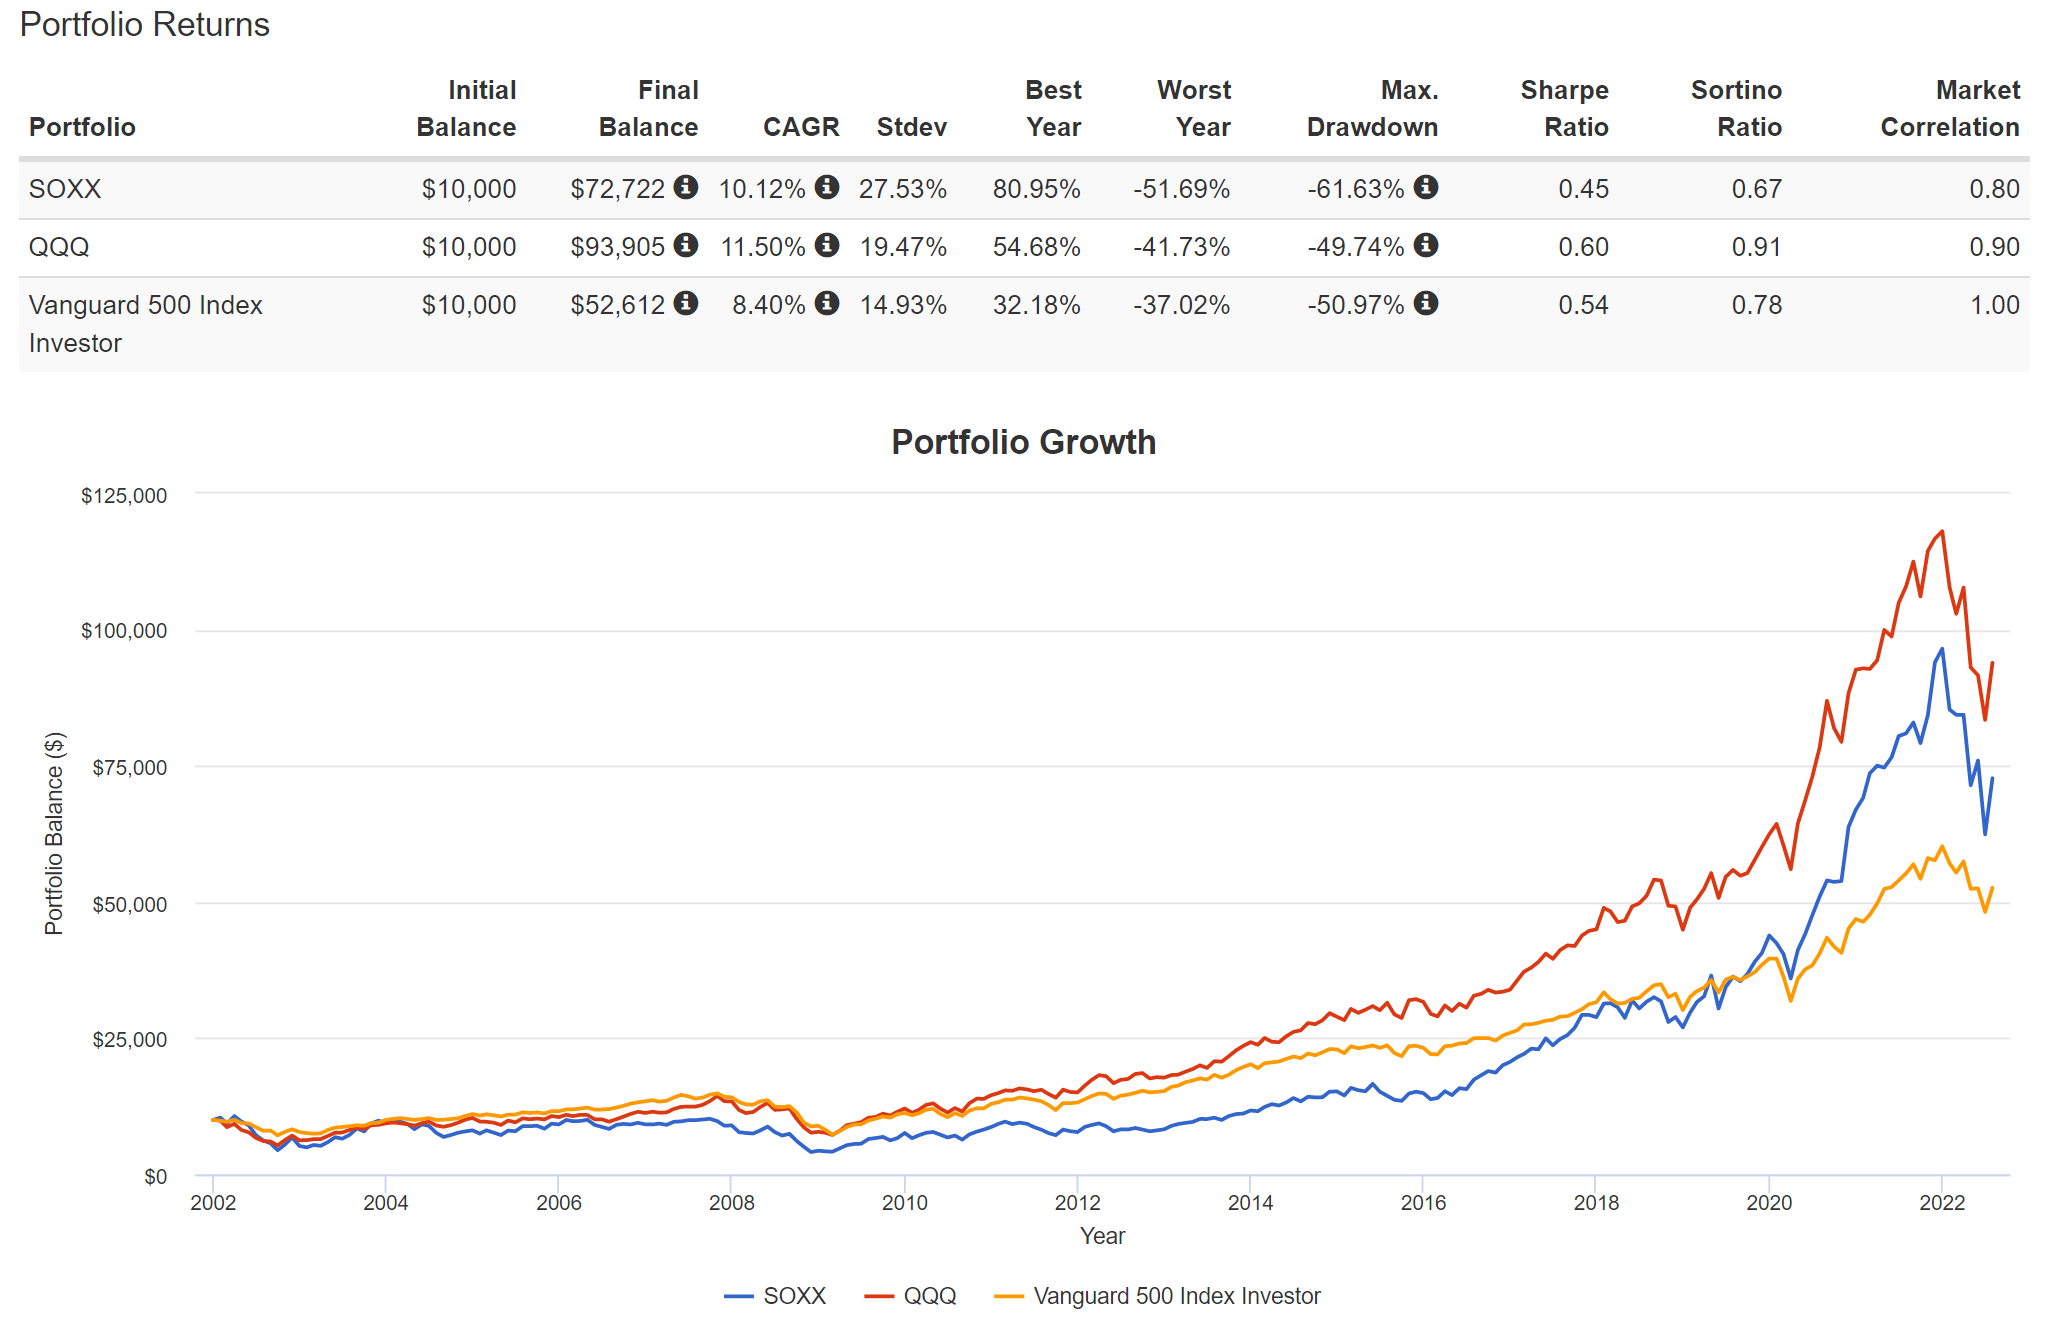
SOXX vs QQQ: More concentrated bet on Tech
As aforementioned, QQQ tracks the largest NON-FINANCIAL companies listed on the Nasdaq and many of these companies are not tech companies. As you can see from the chart below, information technology represents 49.8% of QQQ’s total assets, followed by communication services at 17.7%, and consumer discretionary at 14.9%. Admittedly, some of the companies in communication services and consumer discretionary are also tech companies. Nonetheless, information technology only represents a minor majority of the farm. Note that QQQ also holds a good portion of consumer staples, healthcare, industrials, and utilities.
SOXX and QQ fund fact sheets
SOXX, in contrast, is a pure tech play. The fund is completely invested in the tech sector, especially the semiconductor sector. As you can see, it invests more than 79.1% of its total assets in semiconductor stocks and more than 20.6% in semiconductor equipment. Furthermore, its holdings are also more concentrated. SOXX holds a total of 32 stocks and QQQ about 100.
You can also see the concentration and composition more vividly by looking at their top ten holdings. One of their top 10 holdings overlaps: Nvidia (NVDA). But NVDA represents an 8.3% allocation in SOXX, in contrast to only 3.28% in QQQ. Also note that QQQ’s top holdings include stables like Costco (COST) and PepsiCo (PEP), while all SOXX holdings are semiconductor stocks.
To me, this is key for SOXX’s long-term performance. It places concentrated bet one of the most innovative sectors: information technologies. For this reason and the current valuation, I see favorable odds for SOXX to keep outperforming S&P 500 in the long term. I also see good odds for it to outperform QQQ too, as to be detailed next.
But again, before we turn the page, investors need to be aware of the volatility risks and to pick the right fund for their timeframe and risk tolerance.
Source: ETF.com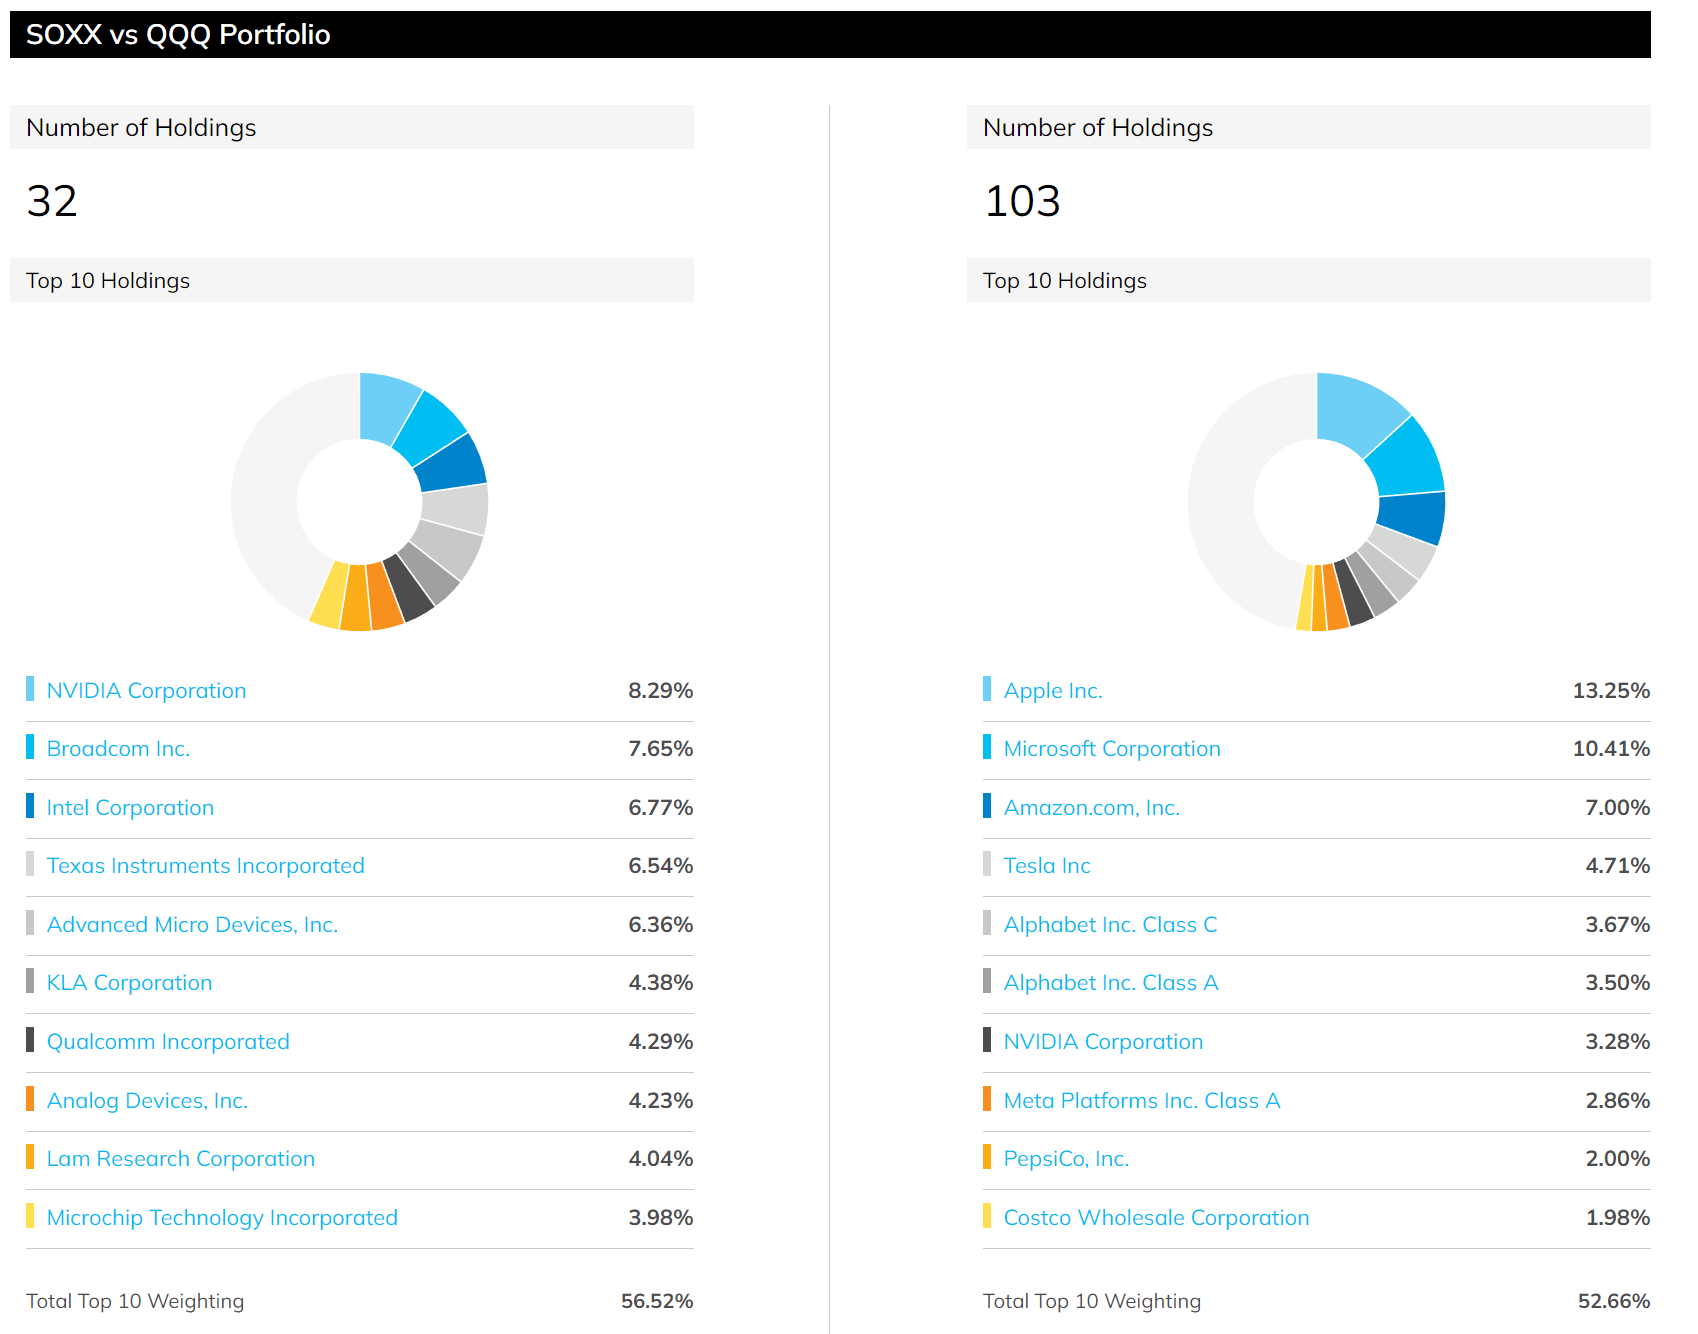
SOXX vs QQQ: valuation comparison
As aforementioned, SOXX has historically been traded at a premium relative to both S&P 500 and QQQ because of its growth potential. However, recent price corrections have brought its valuation to a discount. SOXX’s current P/E of 15.45x is ~17% discounted from the S&P 500. And as the next table shows, the discount from QQQ is even larger.
The price-to-earnings ratio of SOXX is 15.4x only, below QQQ’s 22.0x by about a whopping 30%. Other metrics paint the same picture. The price-to-cash flow ratio of SOXX is 19.5x, below QQQ’s 22.8x by about 15%. And price-to-book value ratio of SOXX is 7.13x, below QQQ’s 8.93x by about 20%, despite SOXX’s higher ROE of 46% vs 40% of QQQ. Finally, do not be alarmed by SOXX’s higher price-to-sales ratio. Its price-to-sales ratio of 6.23x is higher than QQQ by about 35%, but its net margin is higher by 90%.
Author
Final thoughts and risks
There are good reasons to start considering the tech sector now. QQQ has never been a bad choice with its low fee, broad market representation, and excellent liquidity. However, more aggressive investors with a long timeframe might want to consider SOXX also given the valuation correction and the quieter volatility ahead. SOXX has historically enjoyed a valuation premium over the overall market. But its current is ~17% discounted from the S&P 500 and about 30% from the QQQ.
Finally, risks. If you recall from an earlier chart, SOXX charges an expense ratio of 0.4%, and QQQ charges a lower expense ratio of 0.2% only. The extra fee will always create a drag on SOXX (0.2% per year). Also note that SOXX also has a much higher turnover ratio than QQQ (32% vs 8.9%), which might have tax implications for some accounts.
Seeking Alpha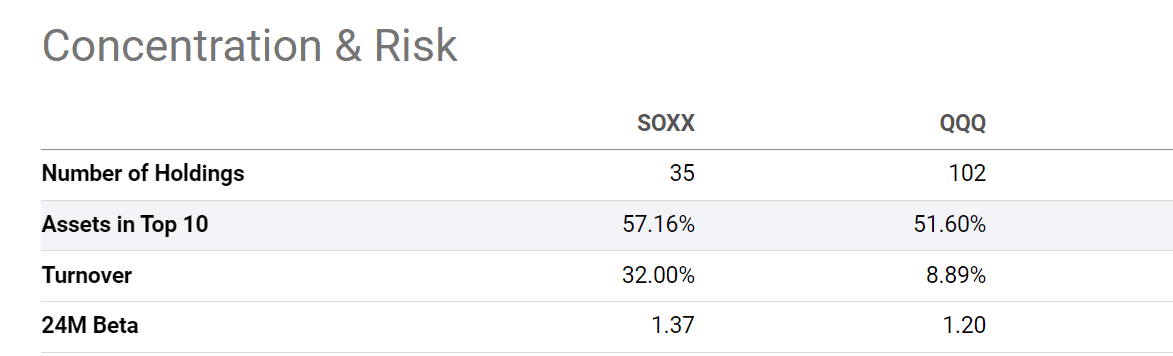
Be the first to comment