

RAND ANALYSIS
- USD/ZAR steady on the back of strong commodity prices
- Local outlook remains grim
- FOMC minutes scheduled tomorrow
ZAR FUNDAMENTAL BACKDROP
After a tempestuous week last week, the rand has opened up slightly stronger against the U.S. dollar; primarily buoyed by rising commodity prices but more specifically South African linked commodities such as platinum, gold and iron ore which are all trading higher today.
GET YOUR Q3 RAND FORECAST HERE!
LOCAL CHALLENGES ESCALATE
From the South African perspective, COVID-19 concerns remain while vaccine rollouts have been slower than initially expected. While cases are steadily rising, the country remains in lockdown alert level 4 which could be prolonged if the current trajectory persists.
Politically, discussions about the former President Jacob Zuma’s incarceration has flooded local headlines with question marks over the capacity of the current President Cyril Ramaphosa and the judicial system to follow through on the imprisonment of Mr. Zuma.
An additional dent to investor confidence has been the case of Rio Tinto announcing force majeure over local mining company Richards Bay Minerals (RMB). This is largely due to the local community extorting the mining companies which at its worst led to the death of an RMB employee. This could have a contagion effect on other businesses which may contribute to rand weakness long-term.
ATTENTION ON FOMC THIS WEEK
Upcoming risk events are slim relative to last week’s bombardment of high impact announcements. Tomorrow, the Federal Market Open Committee (FOMC) minutes (see calendar below) will be a key focus for dollar crosses (including USD/ZAR) which could provide some guidance on tapering, and the disposition of Fed officials on potential interest rate adjustments. Volatility is likely to build up pre-announcement which could extend should any surprises arise from the meeting.
USD/ZAR ECONOMIC CALENDAR
Source: DailyFX economic calendar
TECHNICAL ANALYSIS
USD/ZAR DAILY CHART
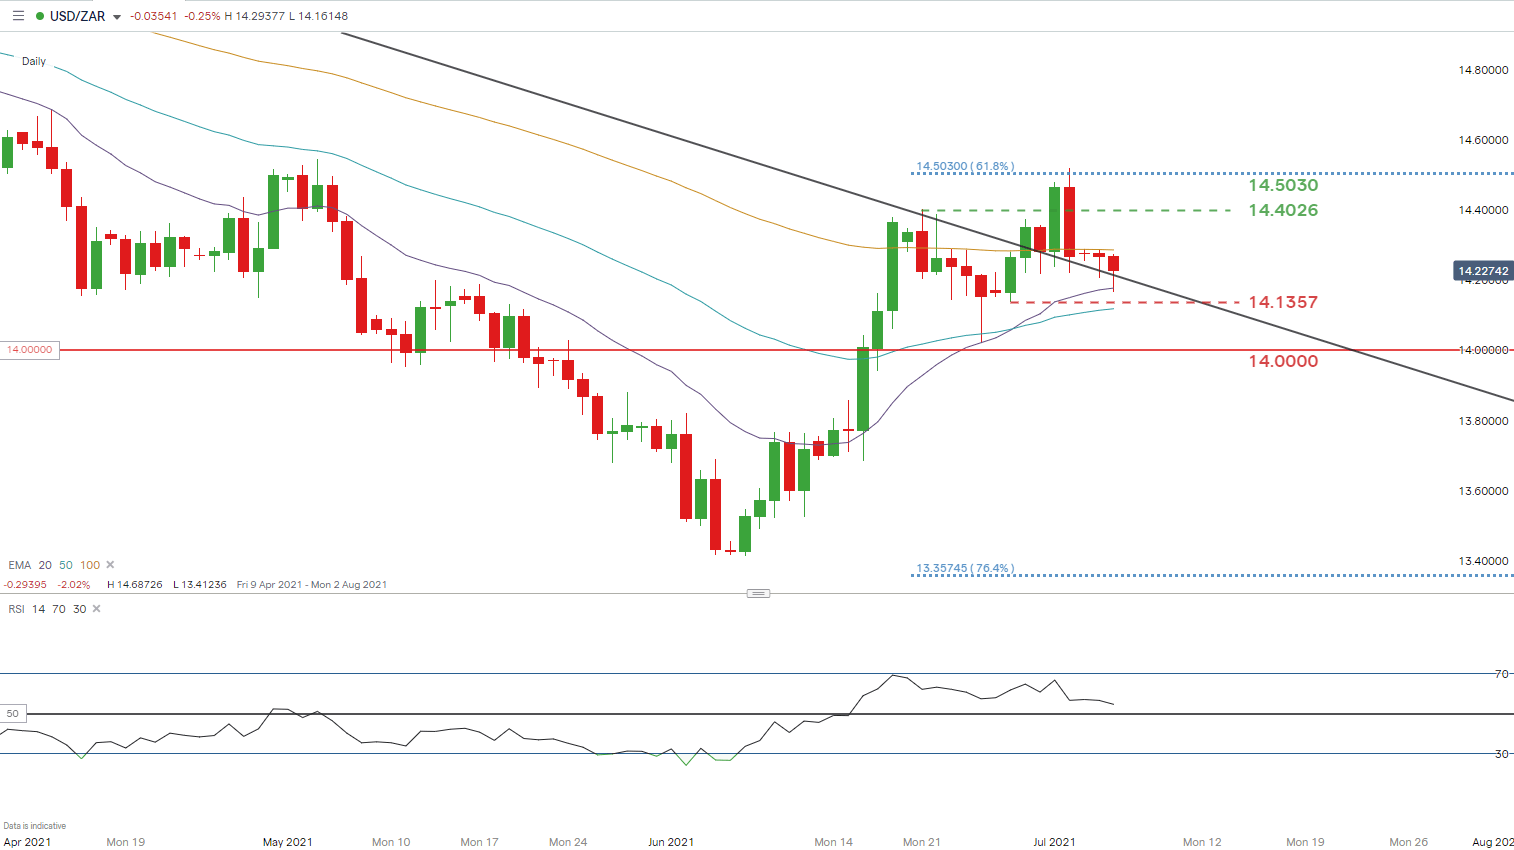
Chart prepared by Warren Venketas, IG
USD/ZAR briefly peaked above the long-term trendline resistance zone (black) which quickly pulled back closing slightly below the zone last week. A close above this level may have prompted a bullish start to the week.
Price action seems to be reverent of the 100-day EMA (yellow) as resistance and 20-day EMA (purple) as support since Sunday’s open. A break above or below these respective areas could give traders a short-term directional bias.
The Relative Strength Index (RSI) shows slowing upside momentum which is contradictory to price action which illustrates higher highs for the same period. This could suggest bearish divergence supported by the recent pullback by rand bulls. Should this continue, 14.1357 will serve as initial support with the 14.0000 psychological level the subsequent target.
Bulls will monitor prices should break above the 100-day EMA take place. If so, the recent swing high will come into focus at 14.4026.
— Written by Warren Venketas for DailyFX.com
Contact and follow Warren on Twitter: @WVenketas
Be the first to comment