

Software AG (OTC:SWDAF) [ETR: SOW] hosted its annual Capital Markets Day on February 5 and provided an update on progress made in 2019 as well as further insights into its 2020 outlook and medium-term targets. The management tone was very upbeat celebrating the bumpy ride in 2019. They further explained that 2019 was a foundation year needed to generate momentum in 2020 and subsequently producing double-digit growth in the following years. Generally, there was a lot of hope in the management’s speech and it seems that the turnaround is just around the corner, after years of lackluster growth.
The stock jumped more than 15% on that day to €33 recovering losses from the unexpected 2020 margin cut, which caught the market by surprise with stock tumbling by -14% (please see our article “Software AG: 2020 Guidance Caught The Market By Surprise, Stock Down -14%“). The stock stayed on that level just before the overall market selloff amid COVID-19 fears, pushing the stock down by -13% from its all-time high value. We believe this overall market setback is temporary with COVID-19 having only a limited impact on SOW operating performance, providing a good buying opportunity into the growth story of Software AG.
2019 was a year of a ramp-up for a big shift; 2020 building momentum
In 2019, the newly appointed management board hit a reset button with the primary focus on breaking inefficient structures and laying the foundation for future growth. According to CEO Sanjay Brahmawar, the key focus areas were:
1) Product re-bundling – given complex product structures the number of products sold separately was overwhelmingly high (more than 1000) which hindered overall sales efforts as well as any cross and upselling opportunities.
2) Salesforce setup – re-aligning sales force in North America for future SaaS and subscription push, which essentially resulted in firing the majority of salespeople and rehiring new ones, leaving the North American region running on existing customer relationships in 2019.
3) Preparation to the business model switch – the introduction of new KPIs and internal reorganization to better track and account for the upcoming shift towards SaaS and subscriptions, which are partially driven by new IFRS standards requiring different accounting for subscriptions. In fact, subscription-based contracts (i.e., on-premise deployment, pro-rata payments) will be split into two parts: 1) with 1 year cancellation period – such contracts will be booked on a pro-rata basis with no discrepancy between sales and cash flows and 2) without cancellation period – such contracts will be artificially split into license and maintenance part in the profit and loss statement, although clients will be paying on a pro-rate basis – this will result in a significant mismatch between IFRS sales figures and actual cash inflows. According to the departing CFO Arnd Zinnhardt, this was the main reason why the company introduced new bookings KPI, to better track the underlying growth irrespective of contract type (i.e., SaaS, subscriptions (with or without cancellation) and licenses, which will be selectively sold to customers). In essence, bookings are defined as the normalized 3-year commitment of a customer independent of the deployment model and payment structure.
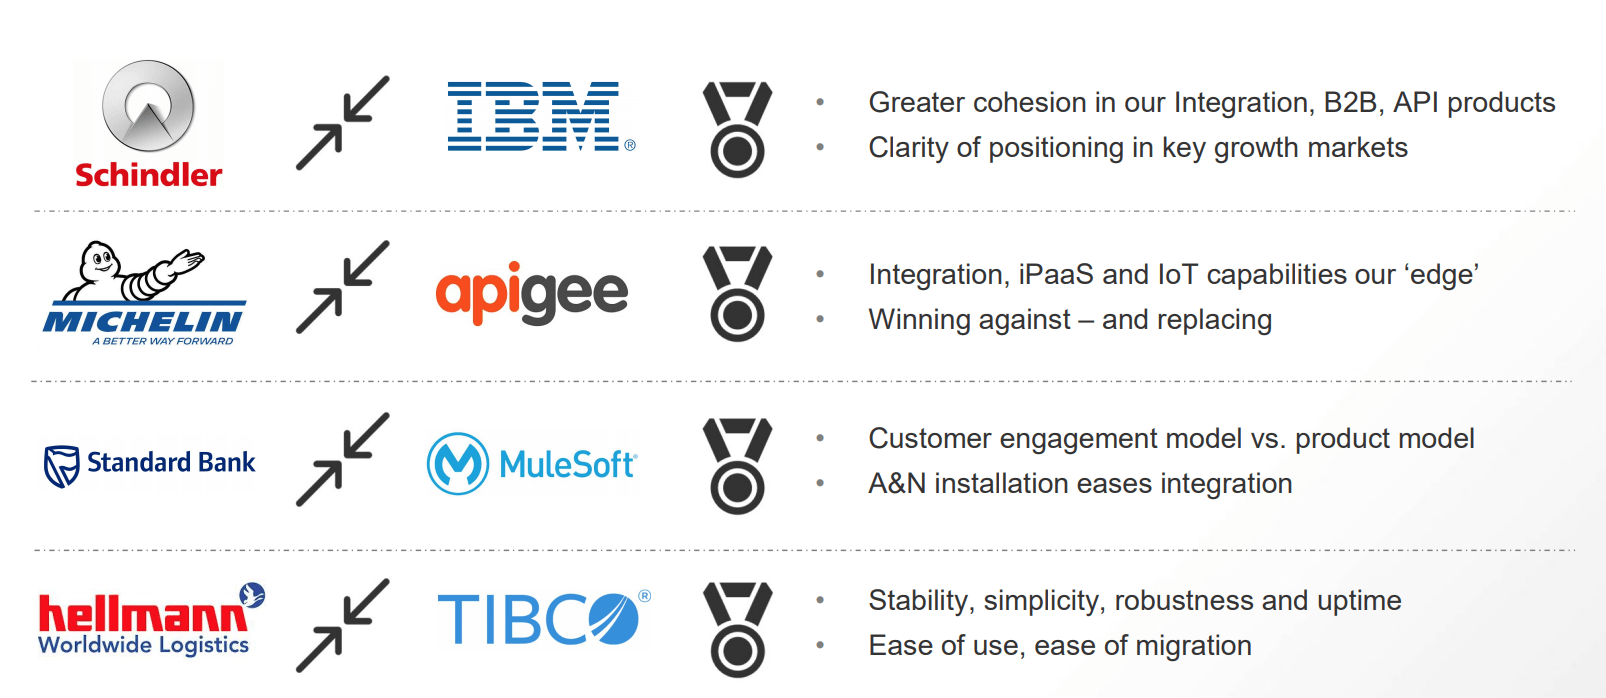
Backed by new marketing efforts and transparent product portfolio (i.e., product re-bundling) some major customers selected Software AG over its competitors. Those should bring some attractive (usage-based) revenue streams in the coming years, which is further demonstrated by an increased deals pipeline in the main growth areas: 1) classic DBP grew 3x and 2) IoT 6x. We note, however, that the company’s pipeline includes both rated (i.e., qualified) and unrated deals with a historical conversion of c. 30% (i.e., pipeline to sales).
The management looks very confident in the future, which is demonstrated by its strong booking growth guidance for 2020 of around 22% for the total Digital Business Platform portfolio: split into 10% to 15% growth in the classic DPB and 40% to 60% growth in the IoT.
The management emphasized that they don’t expect any customer attrition due to the business model shift, as they will offer 1-year cancellation period for new customers. We understand licenses will be offered only to A&N customers given its bulky products and customer structure. The major shift is expected in the Digital Business Model space (including IoT).
Chart 1: New logo wins backed by the product reshuffling
Source: Capital Market Day Presentation, Software AG
The major point of discussion was partnerships, in particular with Microsoft (NASDAQ:MSFT) and Adobe (NASDAQ:ADBE). Those partnerships will entail the sale of SOW products to Microsoft and Adobe – cloud products and driving the sub-sales. However, at this stage it is too early to make any meaningful assessment of those, presenting only a growth acceleration option once the critical mass will be achieved. In fact, the company expects to hit $1b in revenue by 2023 which translates into 3% CAGR, with partnerships being the major backbone of that growth, we reckon. This growth figure doesn’t seem appealing; however, we point out that SOW competes with declining Adabas & Natural business, which still accounts for 1/4 of the group’s revenue as well as c. 20% of the flat consulting business. This implies the major growth drivers are classic DBP and IoT, offsetting sluggish growth dynamics in those two.
Chart 2: Partnerships are growth accelerators going forward
 Source: Capital Market Day Presentation, Software AG
Deep dive into the transition phase
As we briefly discussed in our first article (“Software AG – Disastrous Stock Performance So Far – Fundamentally Undervalued“), switch to SaaS and subscriptions will have a profound impact on the group’s overall financial metrics. At that time, we lacked detailed information to make a better assessment of the underlying dynamics amid business model switch. However, (the departing) CFO Arnd Zinnhardt shared some of the key insights into the ongoing transition and we made an attempt to look at each of the KPIs. We highlight the following key assumptions for modeling purposes, aligned with the management expectations:
1) 2020 contract split of 50:50 between cancellable and uncancellable subscription contracts, which is expected to shift towards cancellable contracts subscriptions with a split of 80:20 by 2023 and resulting in only short-term sales dip.
2) Pure license sales should account for roughly 50% of total DPB revenue, (i.e. classic DPB and IoT), while subsequently sliding down to 11% by 2023.
3) We assume no material subscription sales in the Adabas & Natural with the model shift concerning only DBP clients.
4) Low customer attrition rate – we assume a 95% customer retention rate, which is also in line with the group’s historical levels.
Based on the aforementioned assumptions, we see the overall group’s revenue growth at 6.1% CAGR with the growth acceleration tilted towards the end of the transition phase (i.e., 2023). This is mainly explained by two factors:
1) North American salesforce restructuring – it usually takes 6 to 9 months for salespeople to generate their first sales. Given that the majority of salespeople were hired towards the end of 2019, we would expect to see first sales in H2 ’20 at the earliest with 2021 seeing their full impact
2) EMEA and APJ salesforce – as discussed later, SOW introduced additional investments into EMEA and APJ regions, to ramp up the sales capacity backed by double-digit growth last year. This suggests that 2020 is the year of investments with virtually no revenue from newly hired salesforce, with the full impact to be seen in 2021 and onwards.
Our assumptions imply that the full impact of the salesforce in all three regions should be visible in 2021-22 – the peak of the bookings (26.4-21.9%) and sales (15.4-18.6%) growth.
We point out that 2020 revenue declines by -1.8% which is mainly explained by the sale of the Spanish consulting business in the H2′ 20; however, the pure product revenue (excluding Consulting business) should stay flat and in line with the management expectations. As discussed later, the biggest revenue boost should come from the IoT segment, as it will also be less impacted by the negative short-term impact of the switch, given its already high share of subscription/SaaS revenue (c. 70%). Overall, we expect after 3 years subscription starts generating more sales than licenses driven by cross and upselling, as it is easier to sell incremental functionality with subscriptions as opposed to licenses.
This suggests that by 2023 the recurring revenue share (as a percentage of product revenue) should go up to 86% from 65% in 2019 and in line with the management’s expectations of 85-90%.
Chart 3: Overall top-line growth is expected to accelerate towards 2022-23
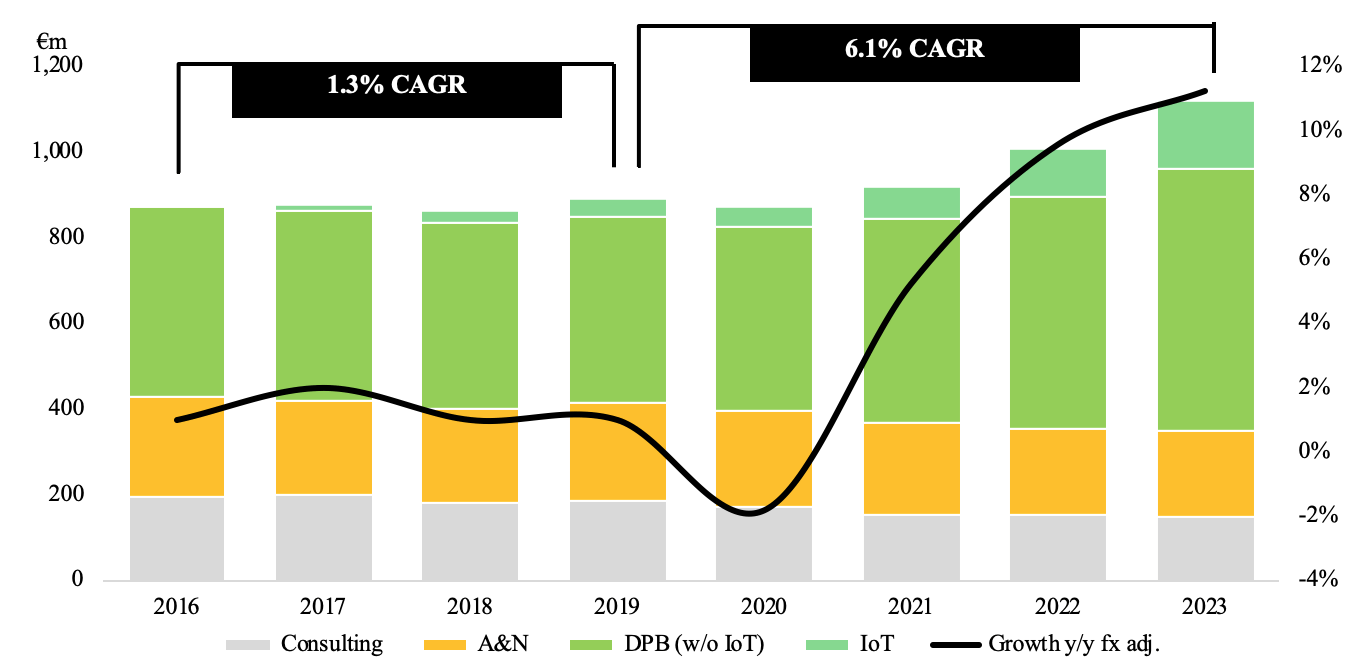 Source: Image created by the author with data from Software AG
Classic DPB should see the greatest performance disruption
The management is looking very optimistic in 2020, backed by a solid pipeline and increasing efforts from the newly formed salesforce in North America with bookings growth of between 10% and 15%. Going forward, we would expect bookings growth to accelerate even further to 18% in 2021 and 16% in 2022 while subsequently shifting towards 10-11% in 2023, as salesforce capacity in EMEA and APJ is expanding.
In terms of product split, SOW guides for 40% to 50% perpetual share (incl. license and maintenance) with a subsequent decline in the following years, while the share of subscriptions is set to see rapid expansion from the estimated 25% in 2019 to 80-90% by 2023. As indicated earlier, the management expects 50:50 split between subscription contracts with and without cancellation option, the former is mainly used to keep the customers who may have some reservations regarding the new (non-license) payment structure. Over time we should see a more rapid shift towards contracts with a 1-year cancellation option making around 70% of the total subscriptions. To show a more realistic development, we assume a 5% customer attrition rate, which is also in line with the management’s expectation and industry average.
Based on our growth assumptions and product split, we expect top-line growth of 9.2% CAGR (2019-23), with license revenue declining rapidly to €67m by 2023 from €151m in 2019 which translates in -18% CAGR. We point out that part of subscription revenue (i.e., contracts without cancellation options) is booked as licenses thereby softening its rapid decline. Stripping out the subscription share, the pure license drop would be much more pronounced at -37%. This accelerated license fall is compensated by the robust growth of subscription revenue (i.e., with 1-year cancellation option) at 31.3% as well as strong growth of maintenance revenue of 12.7%, stemming from maintenance sales of “fake” licenses (i.e., subscription contracts without cancellation option). As subscription sales build up, we see recurring revenue share climbing to 88% by 2023 compared to 72% in 2019.
This different IFRS treatment introduces some major disruptions between booked and realized (i.e., cash) revenues and is the major reason behind the gap between IFRS top-line growth of 9.2% and bookings growth of 13.5% over the same period.
Chart 4: Classic DBP starts to gain more traction
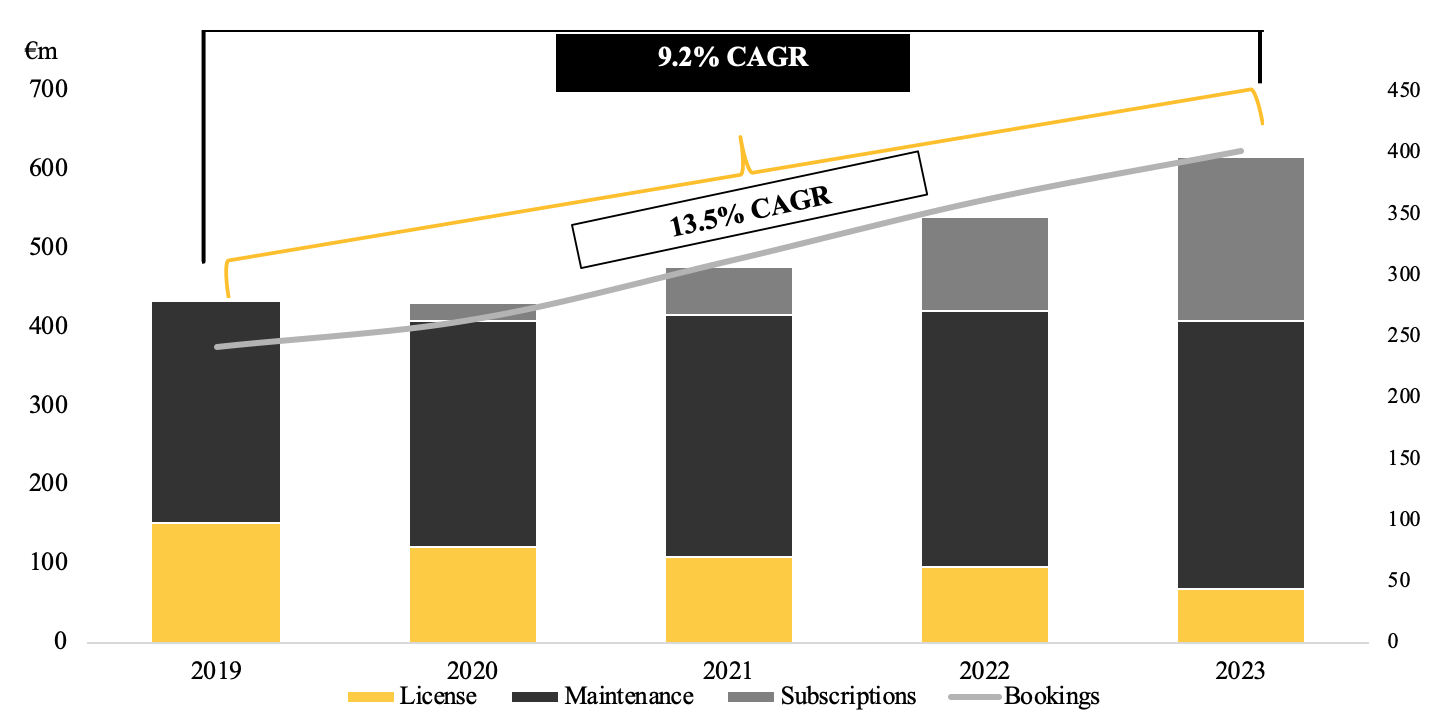 Source: Image created by the author with data from Software AG
In order to assess the different accounting treatment, we compared classic DBP sales development on an IFRS basis as well as on the actual booked or cash basis. The actual revenue dip in 2020 is much more pronounced at -6.8% whereas on an IFRS basis is virtually non-existent (i.e., -0.4%). However, in the following two years, the rebound of cash-based revenues is more striking with growth rates at 13.6% and 18.2% vs. 10.3% and 13.8%, respectively, and in 2022 we expect to see both revenues to converge at €540m. As mentioned, this discrepancy should impact both profitability margin as well as cash flows, which we discuss later in the article.
Chart 5: IFRS sales dip is not as pronounced as cash-flow based
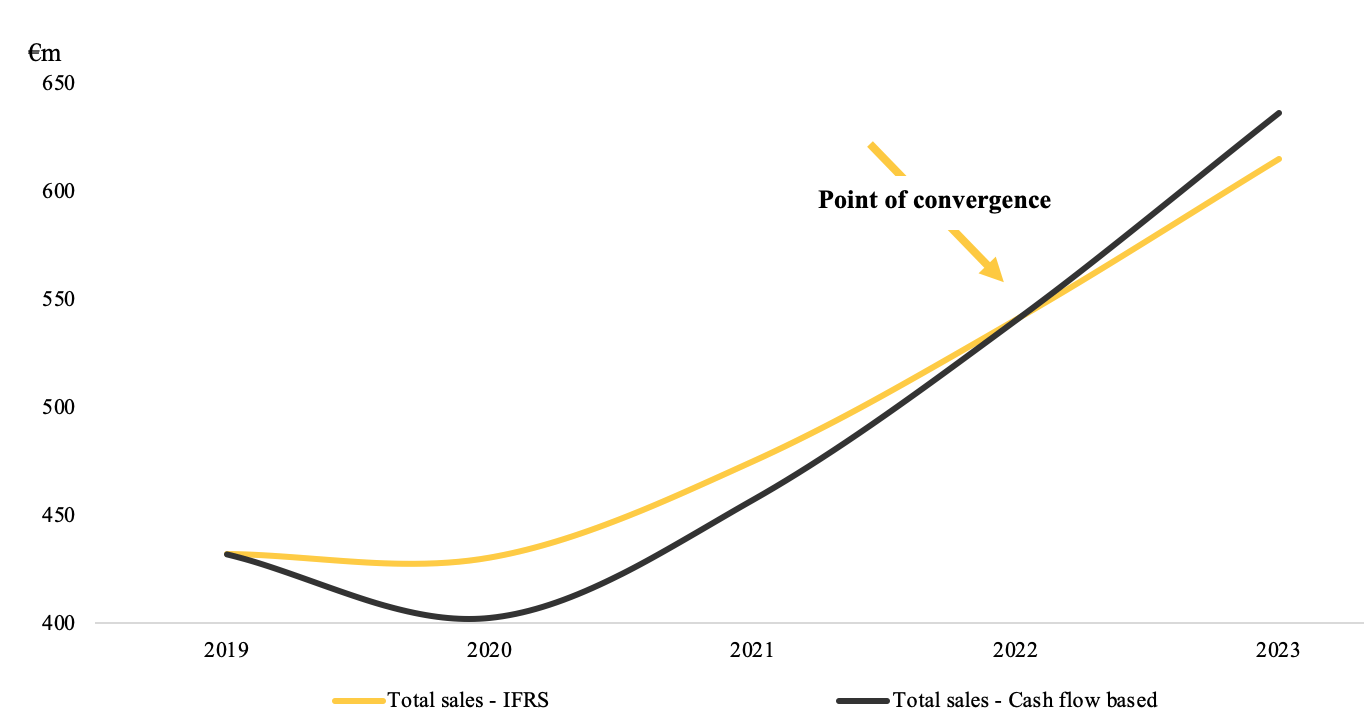 Source: Image created by the author with data from Software AG
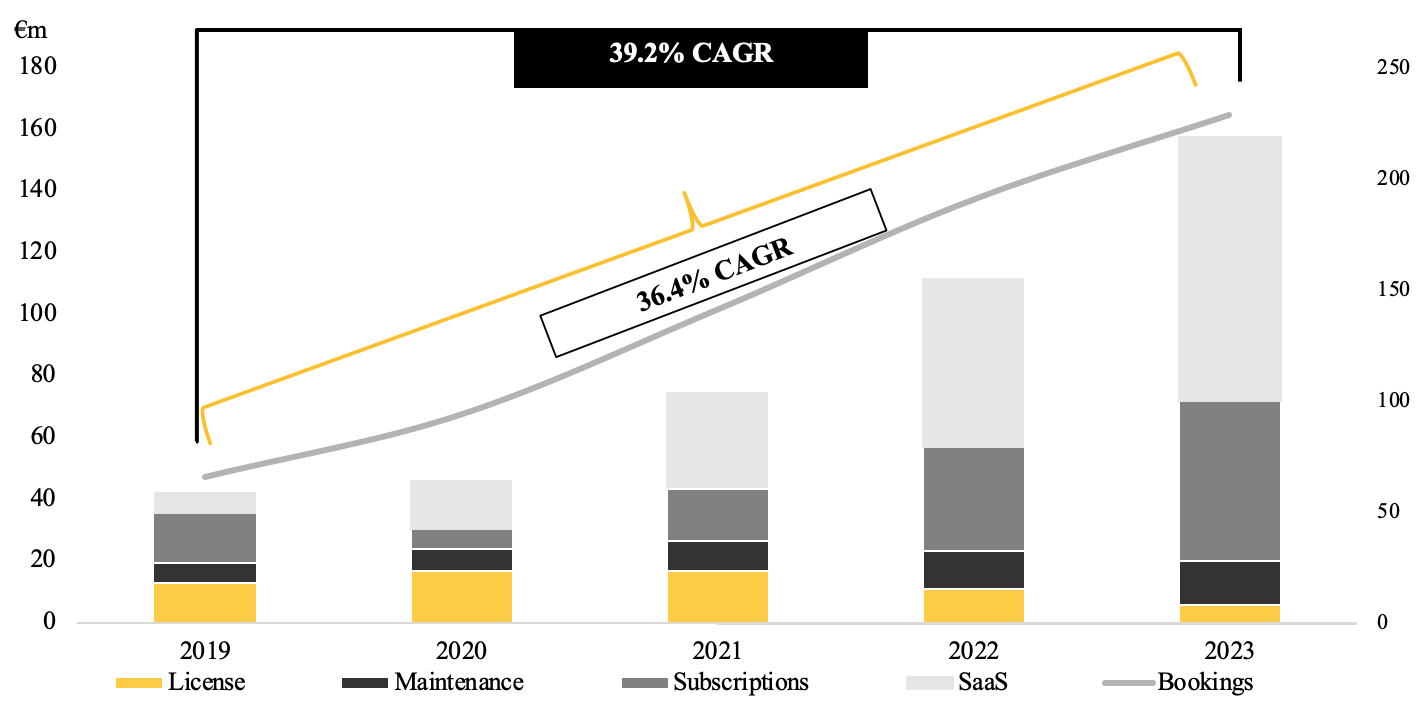
IoT should be the main growth driver with limited disruption in the financial metrics
Contrary to classic DPB, the business model transition, as well as IFRS accounting, should have a very limited impact on revenue growth. Being the key growth driver, we see sales picking up by 39.2% CAGR (2019-23) and roughly on the same level as bookings at 36.4%. The biggest revenue driver should be subscriptions and SaaS growth at 34.4% and 88.7%, respectively. Once again, the split between cancellable and non-cancellable subscription contracts should stand at 50:50 in 2020 while subsequently moving in favor of cancellable contracts, which is an industry-standard, we reckon. Based on a rapid accretion of subscription and SaaS sales, we see recurring revenue share rising to more than 90% by 2023 compared to 70% in 2019. Overall, the segment should be driven by expending sales force capacity in North America as well as EMEA and APJ regions and rising cross and upselling activities. We reckon, it gets easier to market existing clients different product features and offer them upgrades, since contract negotiations will be done on an annual basis, as opposed to licensing deals, where upgrades are harder to sell after license contract has been finalized.
Chart 6: IoT should see more rapid top-line growth
 Source: Image created by the author with data from Software AG
For the sake of completion, we also looked at IFRS and cash-based revenue development. As expected, the discrepancy is less pronounced compared to the classic DPB, where the customer conversion rate is not as high as of IoT clients.
Chart 7: Faster conversion to SaaS and subs with a less overall impact

Source: Image created by the author with data from Software AG
Additional investments burden mid-term profitability while boosting top-line growth
As mentioned in our last article (“Software AG: 2020 Guidance Caught The Market By Surprise, Stock Down -14%”), the management surprised the market with additional, unexpected margin dip of up to 900bps which is split into 1) transition impact of 350bps and 2) 500bps caused by additional investments, pushing adj. EBITA margin to 20-22% in 2020. On the Capital Markets Day, the company provided some further insight into those incremental investments of up to €50m, which are largely recurring (c. 80%) and front-end loaded (i.e., in H1 ’20) and are split into three categories:
1) Go-to-market strategy – with a total investment volume of €25m (50% of total) and further split into a) regions with €8m investments and is used to expand sales capacity in EMEA and AJP regions and are recurring (i.e., salespeople); b) marketing with c. €7m used to increase field marketing by 50% and build up the pipeline and are largely recurring; c) alliances & channels with c. €7m used to establish a dedicated sales team with the goal to further expand partnership networks and are recurring and d) customer success with c. €5m used to hire to new customer support personnel, and is recurring.
2) Product and R&D – with a total investment volume of c. €22m (40% of total) with the goal to further expand and re-bundle product offerings.
3) Culture and people – with the smallest investment volume of c. €5m (10% of total), and we reckon are largely one-off items.
As mentioned, these new investments came as a surprise, as the company never mentioned the need to further expand in a sales capacity in EMEA and APJ regions. On the Capital Markets Day, the management tried to explain that they aim to further benefit from increased levels of productivity in those regions, which recorded double-digit growth rates in 2019. We view this as a rather plausible explanation and this is the main pre-requisite for double-digit top-line growth in the coming years. However, we remain skeptical as to other surprising investments potentially disrupting the group’s profitability going forward. In fact, the management revised its mid-term (2023) margin guidance to between 25% to 30% from above 30%, reflecting those additional recurring investments.
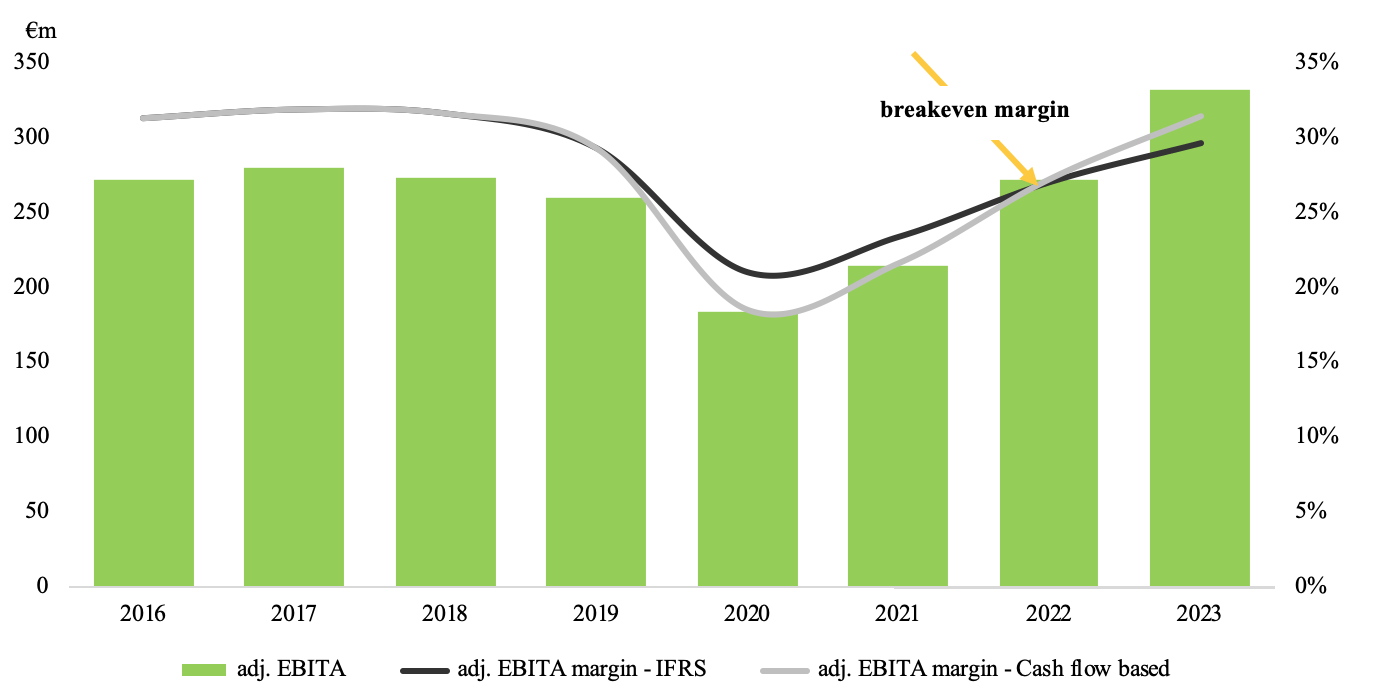
Putting our topline projections with mounting cost burden, we arrive at 21% adj. EBITA margin in 2020 and placing us at the mid-point of the guided range of 20% to 22%. In the following years, we see profitability levels to moderately pick up to 23.4% and 26.2% in 2021-22 while reaching 28.8% in 2023 – mid-point of the mid-term guidance.
As we mentioned earlier, different IFRS treatment of cancellable and non-cancellable subscription contracts introduces a mismatch between reported and cash-based financial figures. In order to better understand the impact, we compared reported and cash-based adj. EBITA margins. We see a considerable gap of 2.5% in 2020 (18.6% vs. 21%) while subsequently declining to reach a breakeven point in 2022.
Chart 8: Profitability follows top-line pattern
Source: Image created by the author with data from Software AG
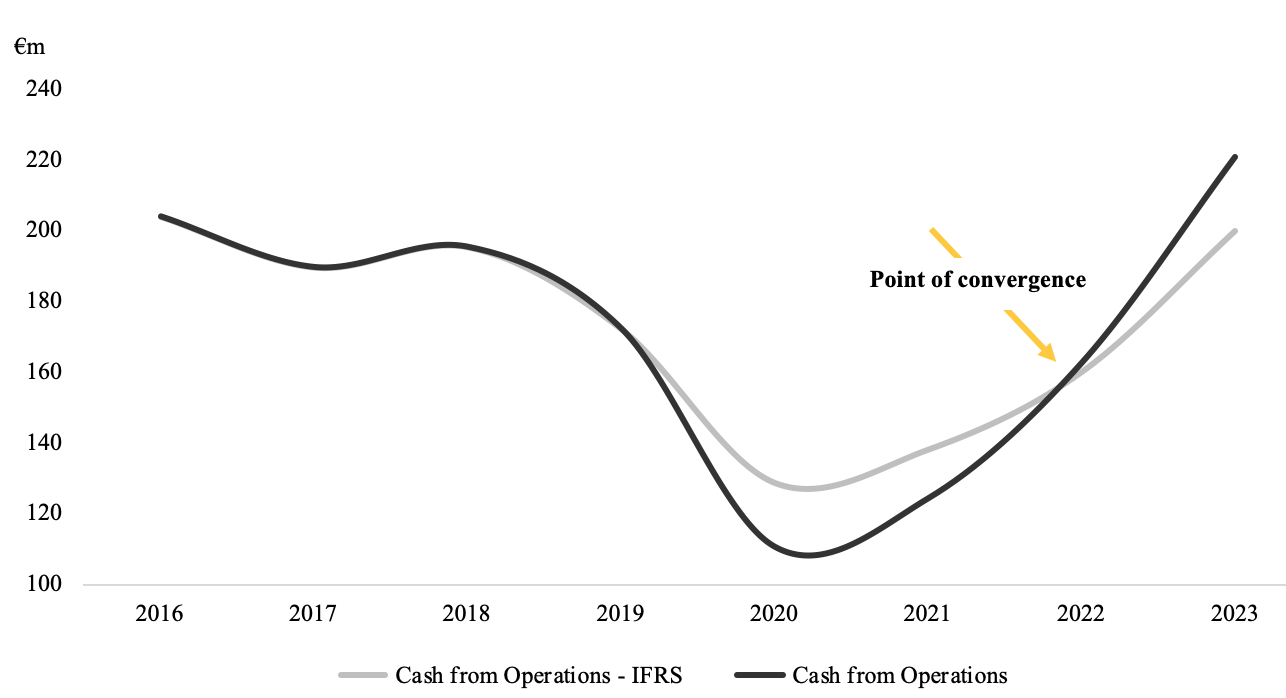
Accounting mismatch results in a short-term cash flow disruption
The last point of discussion is the cash flow disruption from the business model switch as well as the difference in reported and cash-based financial figures (i.e., top and bottom lines). For this purpose, we looked at cash from operations using IFRS figures and the actual cash inflows. We have used operating cash flows instead of free cash flows, to exclude the financing impact, which was prevailing in the prior years. As can be seen in the chart below, cash from operations drops significantly in 2020 to €110m from €172m and translating into a -36% drop. This rapid decline in the cash flows compares closely to pure license drop (as discussed above) of -36.9%. Similar to profitability development, we see both cash flow figures converging in 2022 with the rapid growth in the following years.
Chart 7: Operating cash flows should see accelerating growth after 2022
 Source: Image created by the author with data from Software AG
Fundamental and peer valuations suggest attractive upside potential
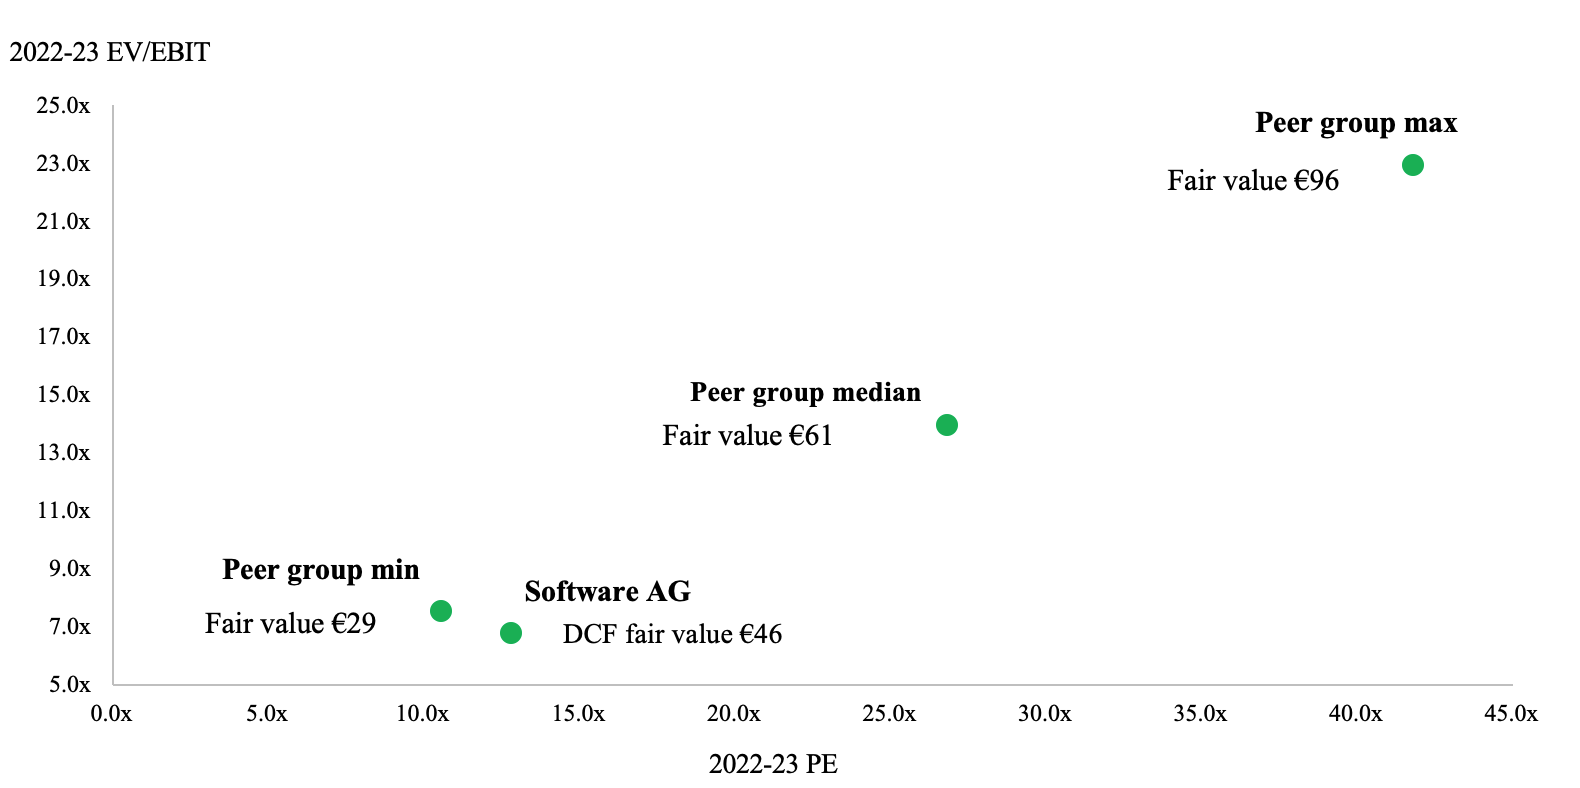
Plugging in our projections and assuming 2.5% perpetual growth with a 30% margin in the long term, we arrive at the fundamental value of €47 per share, implying a sizable 60% upside to the current valuation levels (€29.42 as of February 28).
We have also looked at the peer valuation levels, which suggest multiples expansion of up to 3x to 23x on EV/EBIT (median 2x) and 3x to 41.8x on PE (median 2x) on 2021-22 levels, as Software AG sees a rapid acceleration of cloud and subscription shares.
Chart 8: Peer multiples and DCF valuation suggest an attractive upside of up to double the current value
Source: Image created by the author with data from Software AG and marketscreener.com
Conclusion
Overall, the general sentiment of management was very positive and elevated with the market reacting respectively, almost cheering for the management to succeed. We believe H1 ’20 would be rather shaky for Software AG, as it competes with tough comparables as well as incremental investments as salesforce expansions are front-end loaded burdening group’s margins. The full effect of revamped North American salesforce should become visible from H2 ’20 and onwards with accelerating bookings growth. We believe Software AG is on the right track to start benefiting from the rising share of subscription and SaaS revenue with rising profitability levels once the business model shift is finished within the next 2 to 3 years, resulting in considerable multiple expansion.
Disclosure: I/we have no positions in any stocks mentioned, and no plans to initiate any positions within the next 72 hours. I wrote this article myself, and it expresses my own opinions. I am not receiving compensation for it (other than from Seeking Alpha). I have no business relationship with any company whose stock is mentioned in this article.
Be the first to comment