

Jae Young Ju/iStock via Getty Images
Our postindustrial world would be impossible without semiconductors in the way that the industrial world would have been impossible without oil. But just because they are essential does not mean they will be a consistent source of profit. In this article, I dismiss the link between the expected expansion of the semiconductor industry and returns in semiconductor equities (except over generational durations), and I argue that equity prices have their own logic which must be reckoned with. History suggests that returns in the semiconductor industry will be extremely low until the end of the decade and perhaps well into the 2030s.
Stock returns and semiconductor sales
I read an article recently that appeared to use the following chart from the Semiconductor Industry Organization, which shows global semiconductor sales over the last 25 years, alongside the critical role of semiconductors in the modern world, to argue that the semiconductor industry would likely produce high returns in the future. This argument is repeated in a piece in MarketWatch.
Chart A. Global semiconductor revenues have grown 5x in the last 25 years. (Semiconductor Industry Organization)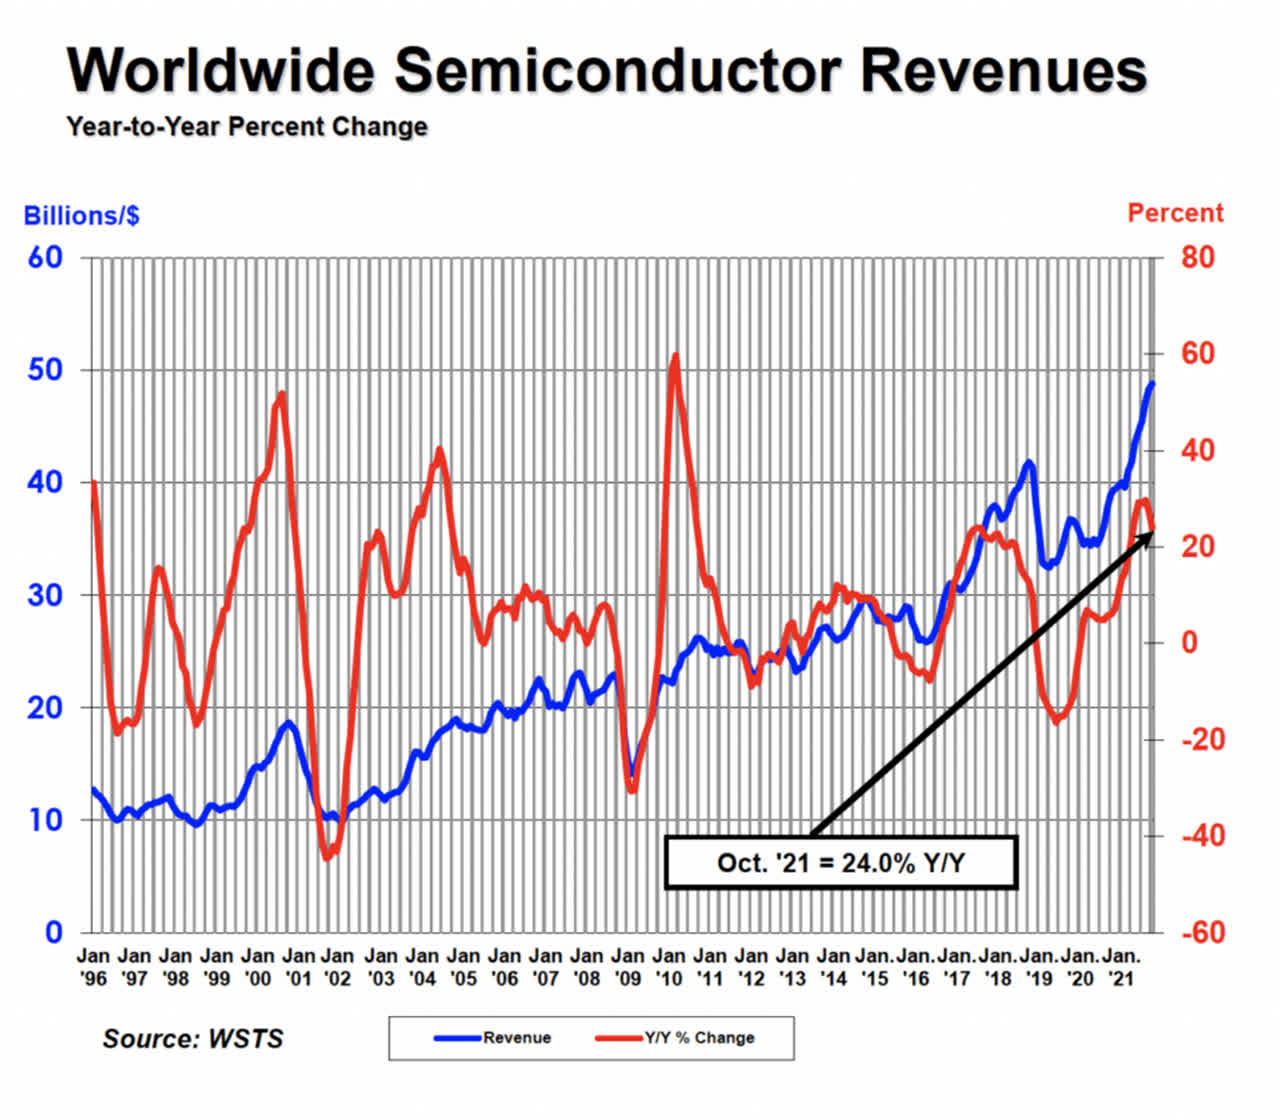
The blue line shows the quintupling in sales since 1998, and the red line shows that from year to year, revenue growth can be volatile.
Unfortunately, there is little connection between long-term revenue growth and long-term equity performance in the sector. Look at the trough in both the red and blue lines that occurred in or around January 2002, for example. And then look at the subsequent growth to late 2008. This was a doubling in revenue in that period from around $10 billion to well over $20 billion.
Below is the Philadelphia Semiconductor Index over the same period.
Chart B. Semiconductor returns were flat from late 2001 until 2008, when semiconductor revenues doubled. (Stockcharts.com)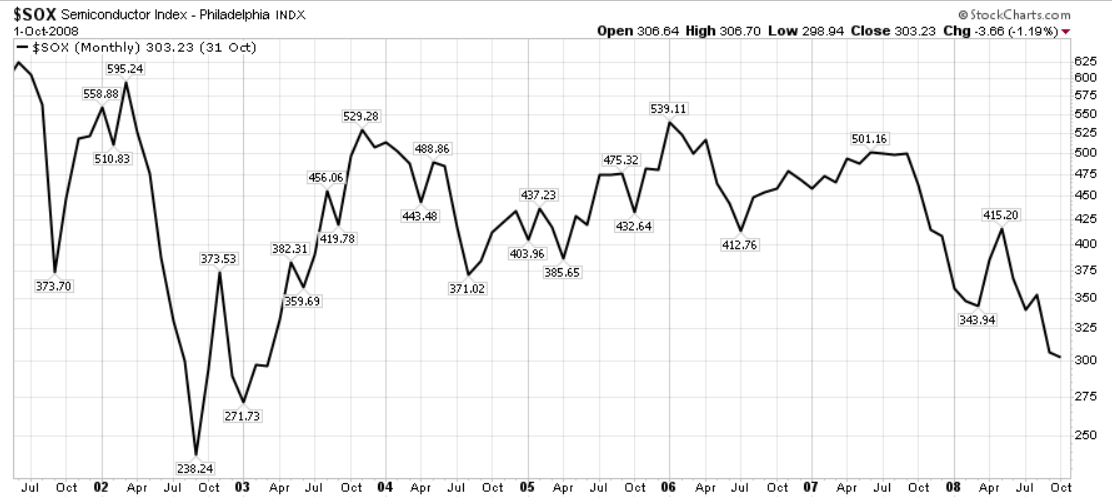
Returns were flat to negative, even if we used the most generous starting point of 373.7 in late 2001 to calculate results.
If you had bought at the 2000 peak in semiconductor sales, unsurprisingly, long-term returns would have been even worse. You would have had to have waited 17 years just to get your money back, as the following chart shows, even though sales had doubled over that period.
Chart C. Buying at the peak of the 2000 semiconductor boom would have been even worse, of course. (Stockcharts.com)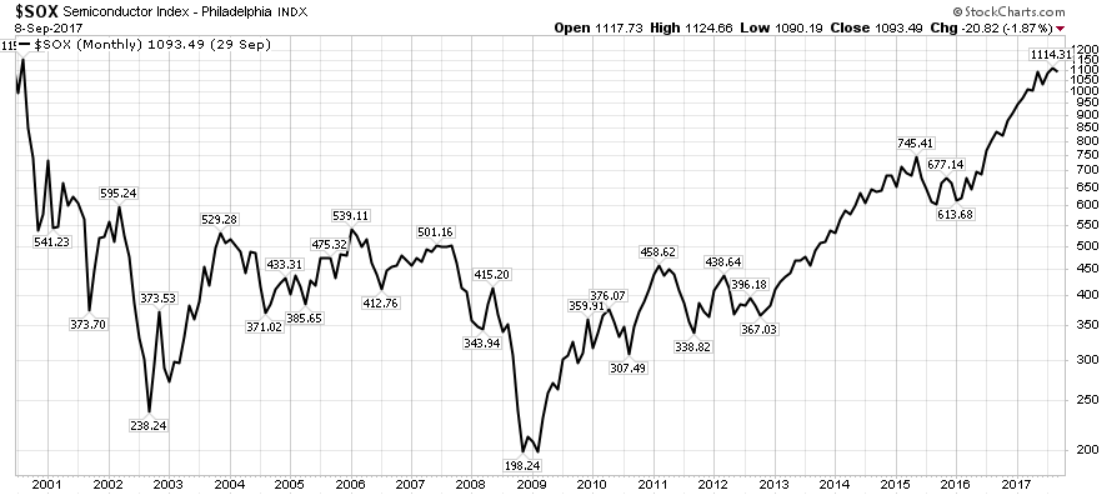
There seems to be a correlation between investment in computers as a percentage of GDP and long-term returns, but it is not clear how one might predict changes in that ratio or how that translates into stock returns.
Chart D. There seems to be some connection between computer equipment investment and stock returns. (St Louis Fed)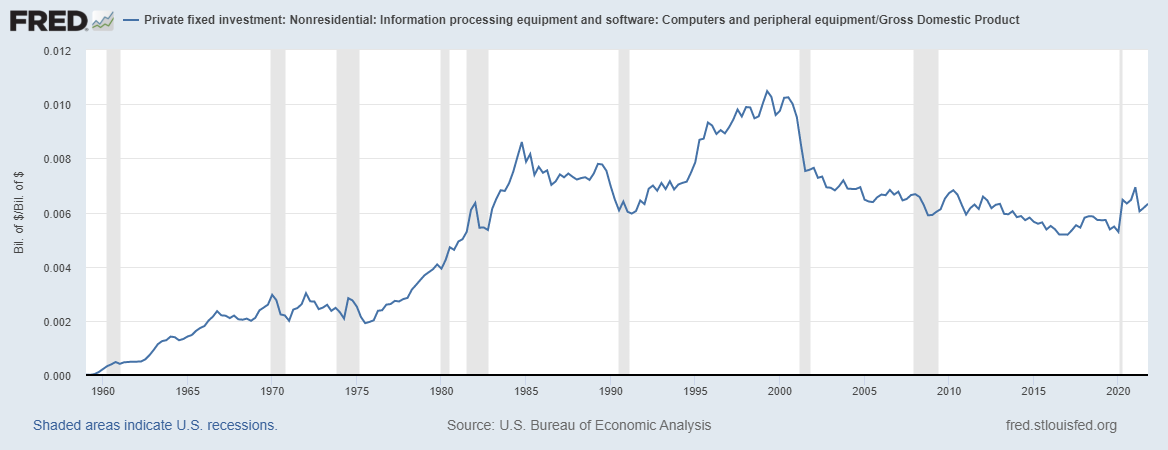
The following chart shows the relative performance of electronic equipment stocks over long-term Treasuries since 1926. This is based on the Fama-French 49-industry data set.
Chart E. Peaks in chip industry seem to coincide with peaks in the computer investment ratio. (Fama-French, Shiller, St Louis Fed)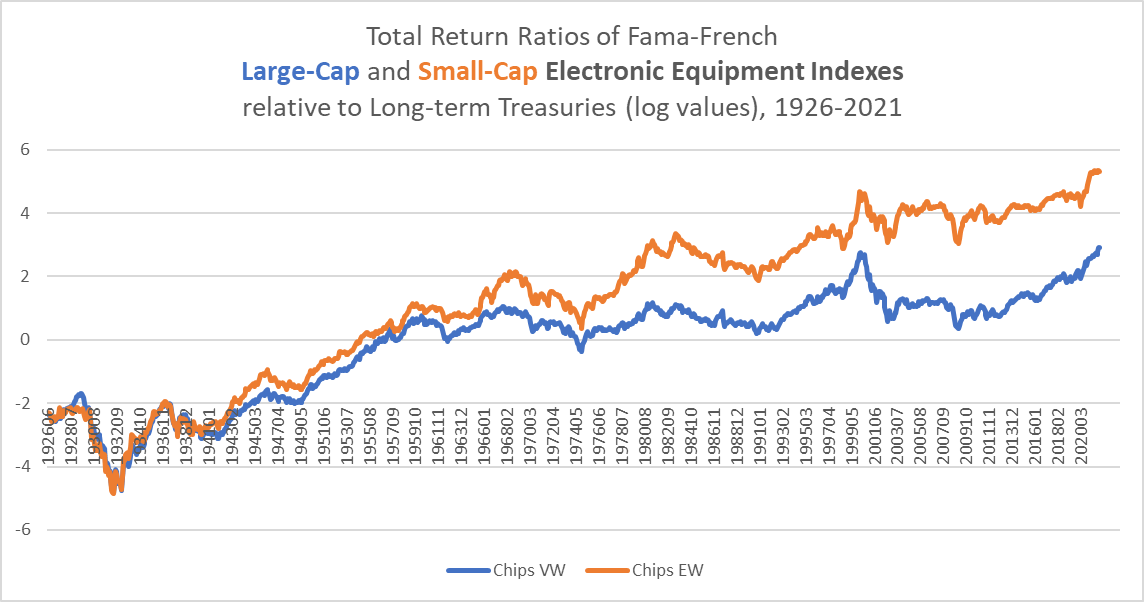
Peaks in these ratios seem to largely coincide with peaks in the computer investment ratio in Chart D. The last two major peaks were in the early 1980s and late 1990s. The prior peak appears to have been in the late 1960s. The troughs in between seem to correlate to some degree, as well.
These patterns seem to be reflected in the relative performance of these indexes against the market as a whole, as well, partly illustrated by the chart below, when contrasted with Chart D.
Chart F. Peaks in relative returns against S&P 500 also tend to coincide with computer investment ratio. (Fama-French, Shiller)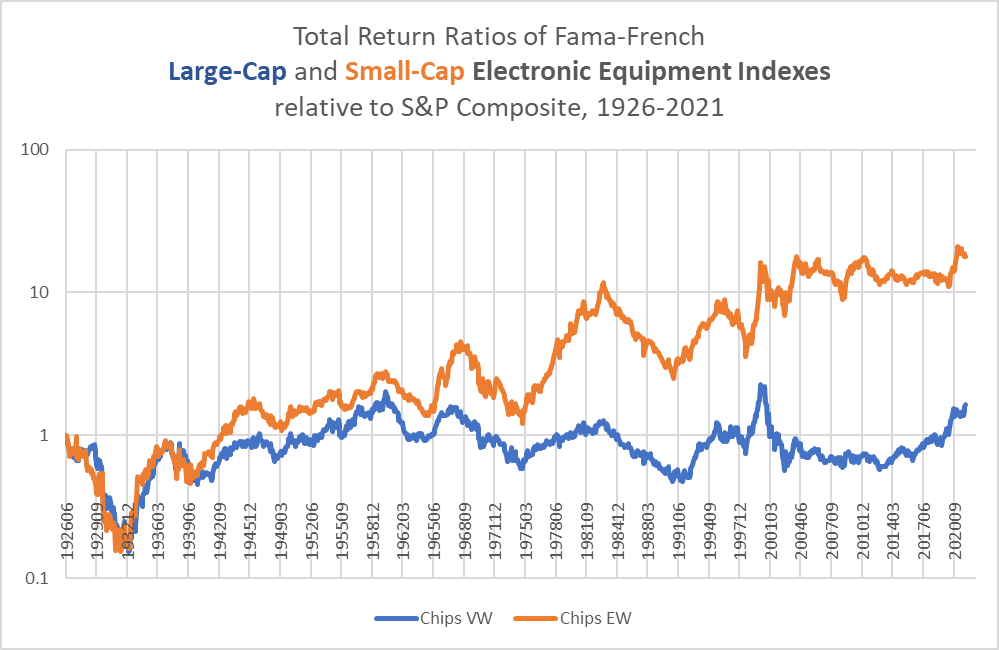
The VanEck Vectors Semiconductor ETF (NASDAQ:SMH) tracks is a cap-weighted index of “companies involved in semiconductor production and equipment,” and correlates with other benchmark semiconductor indexes like the SOX.
Chart G. The SMH ETF has tracked semiconductor returns well. (Stockcharts.com)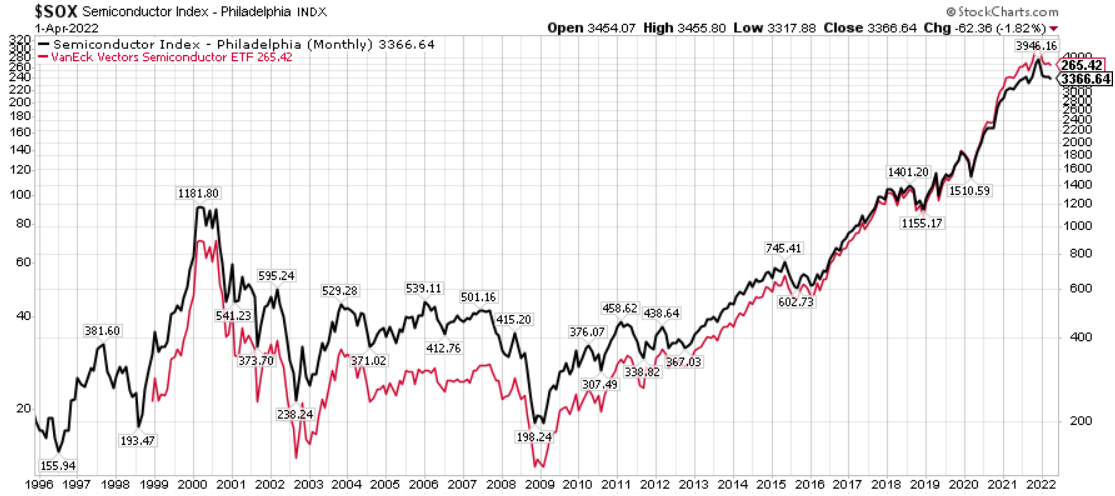
It is composed of 25 companies, which I list below, alongside their Fama-French industry designation.
|
SMH Daily Holdings (%) 03/30/2022 |
|||||
|
Number |
Ticker |
Holding Name |
%Assets |
Cumulative |
FF49 Industry |
|
1 |
Nvidia Corp |
10.5 |
10.5 |
Electronic Equipment |
|
|
2 |
Taiwan Semiconductor Manufacturing Co L |
10.1 |
20.6 |
Electronic Equipment |
|
|
3 |
ASML Holding NV |
5.1 |
25.7 |
Machinery |
|
|
4 |
Texas Instruments Inc |
5.1 |
30.8 |
Electronic Equipment |
|
|
5 |
Intel Corp |
5.0 |
35.8 |
Electronic Equipment |
|
|
6 |
Advanced Micro Devices Inc |
5.0 |
40.8 |
Electronic Equipment |
|
|
7 |
Broadcom Inc |
4.9 |
45.7 |
Electronic Equipment |
|
|
8 |
Analog Devices Inc |
4.5 |
50.2 |
Electronic Equipment |
|
|
9 |
Qualcomm Inc |
4.5 |
54.8 |
Electronic Equipment |
|
|
10 |
Lam Research Corp |
4.5 |
59.2 |
Machinery |
|
|
11 |
Applied Materials Inc |
4.4 |
63.7 |
Electronic Equipment |
|
|
12 |
Micron Technology Inc |
4.2 |
67.8 |
Electronic Equipment |
|
|
13 |
Marvell Technology Group Ltd |
3.9 |
71.8 |
Electronic Equipment |
|
|
14 |
NXP Semiconductors NV |
3.9 |
75.6 |
Electronic Equipment |
|
|
15 |
KLA Corp |
3.8 |
79.4 |
Lab Equipment |
|
|
16 |
Synopsys Inc |
3.6 |
83.1 |
Software |
|
|
17 |
Cadence Design Systems Inc |
3.1 |
86.1 |
Software |
|
|
18 |
Microchip Technology Inc |
2.9 |
89.0 |
Electronic Equipment |
|
|
19 |
STMicroelectronics Nv |
2.4 |
91.4 |
Electronic Equipment |
|
|
20 |
ON Semiconductor Corp |
1.9 |
93.3 |
Electronic Equipment |
|
|
21 |
Skyworks Solutions Inc |
1.7 |
95.1 |
Electronic Equipment |
|
|
22 |
Monolithic Power Systems Inc |
1.7 |
96.8 |
Electronic Equipment |
|
|
23 |
Teradyne Inc |
1.5 |
98.3 |
Electronic Equipment |
|
|
24 |
Qorvo Inc |
1.1 |
99.4 |
Lab Equipment |
|
|
25 |
Universal Display Corp |
0.6 |
100.0 |
Electronic Equipment |
|
Of these holdings, 79% fall within the category of Electronic Equipment, 10% Machinery, 7% Software, and 5% Lab Equipment. These designations are determined by the Fama-French datasets’ categorization of the respective companies’ SIC codes, which can be found on the SEC’s website.
Long-term predictors of semiconductor returns
In my opinion, the best long-term predictors of semiconductor industry returns are long-term sectoral imbalances within the market, the level of the dividend yield, and the relative performance of market-wide earnings growth and commodity inflation. To some degree, these are all interconnected.
S&P earnings, commodity inflation, and chip stocks
The following chart shows long-term changes in the S&P Composite index (in orange), the Electronic Equipment index (in blue), and commodity prices (in green).
Chart H. Semiconductors tend to have a high ‘beta’ long-term. (Fama-French, Shiller, World Bank, St Louis Fed, Warren & Pearson)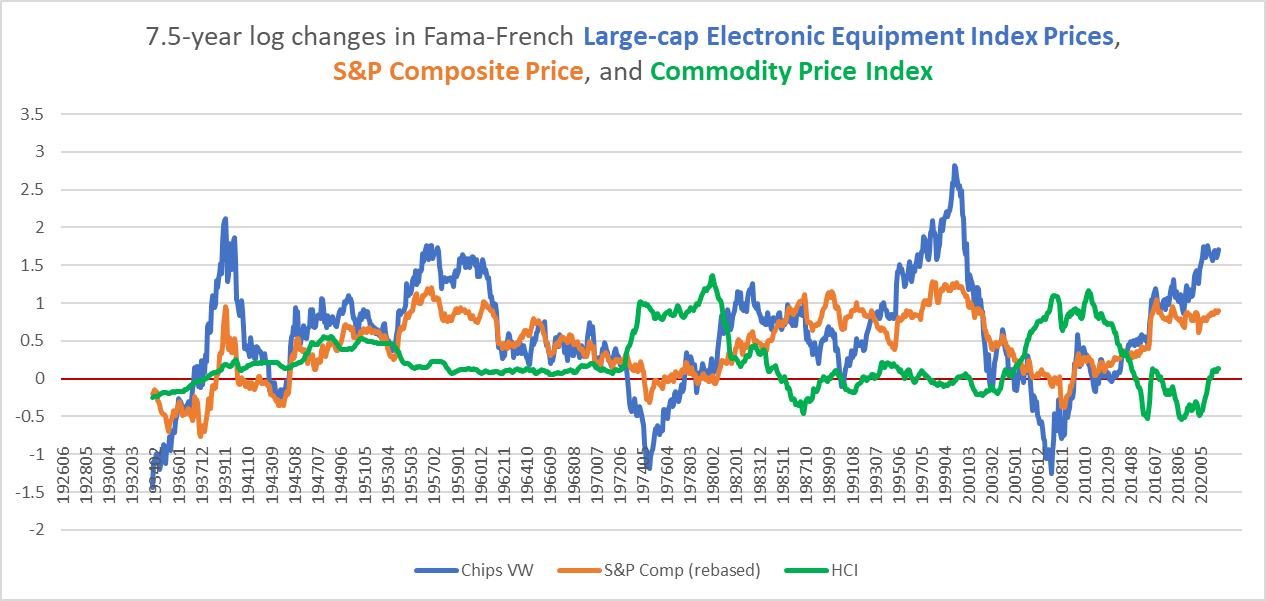
The three worst long-term bear markets in the S&P occurred in the 1930s, 1970s, and 2000s. The 1940s might be thrown into the mix, as well. In each of these three bear markets, the chips index underperformed the broader market by a considerable margin, although it seems to have recovered somewhat earlier, as well. For example, in the late 1930s and late 1970s, Electronic Equipment stock prices were rising faster than the S&P. By the end of the 2000s, they were rising at roughly the same rate.
These three bear markets (1930s, 1970s, and 2000s) each had their own inflation characteristics. The 1930s saw low consumer and commodity inflation; the 1970s had high consumer and commodity inflation; and the 2000s had low consumer inflation and high commodity inflation.
The critical difference appears to be the gap between earnings growth and commodity inflation. In the following chart, I show the long-term performances of the chip index, S&P earnings, and commodity inflation.
Chart I. When earnings are strong relative to commodity inflation, semiconductors do well. (Fama-French, Shiller, St Louis Fed, World Bank, Warren & Pearson)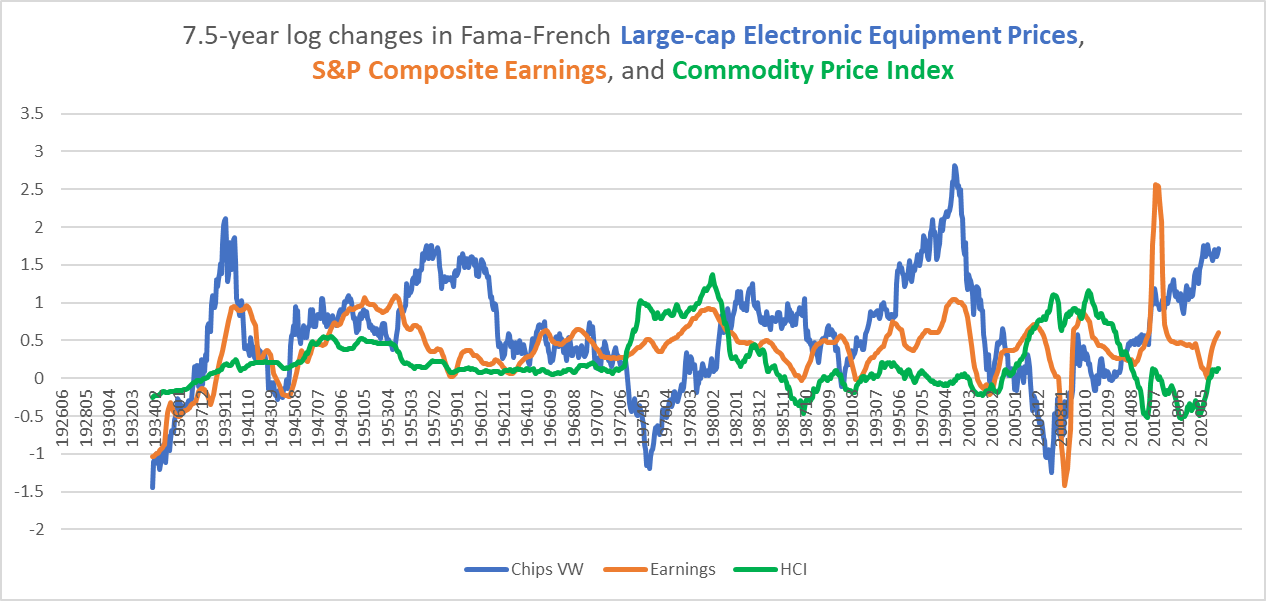
Electronic Equipment stocks have tended to shine when earnings in the broader market (the orange line) have exceeded commodity inflation (the green line).
Although dividend growth in the Electronic Equipment industry has tended to track S&P earnings, it still appears that it is the earnings growth of the wider market that is the critical factor. For example, the chip industry saw massive sustained growth in dividends in the 2000s, but this did not prevent the index as a whole from slipping into a bear market, as we have seen in multiple charts above.
Chart J. Semiconductor dividends have tended to track S&P 500 earnings. (Fama-French, Shiller, St Louis Fed, World Bank, Warren & Pearson)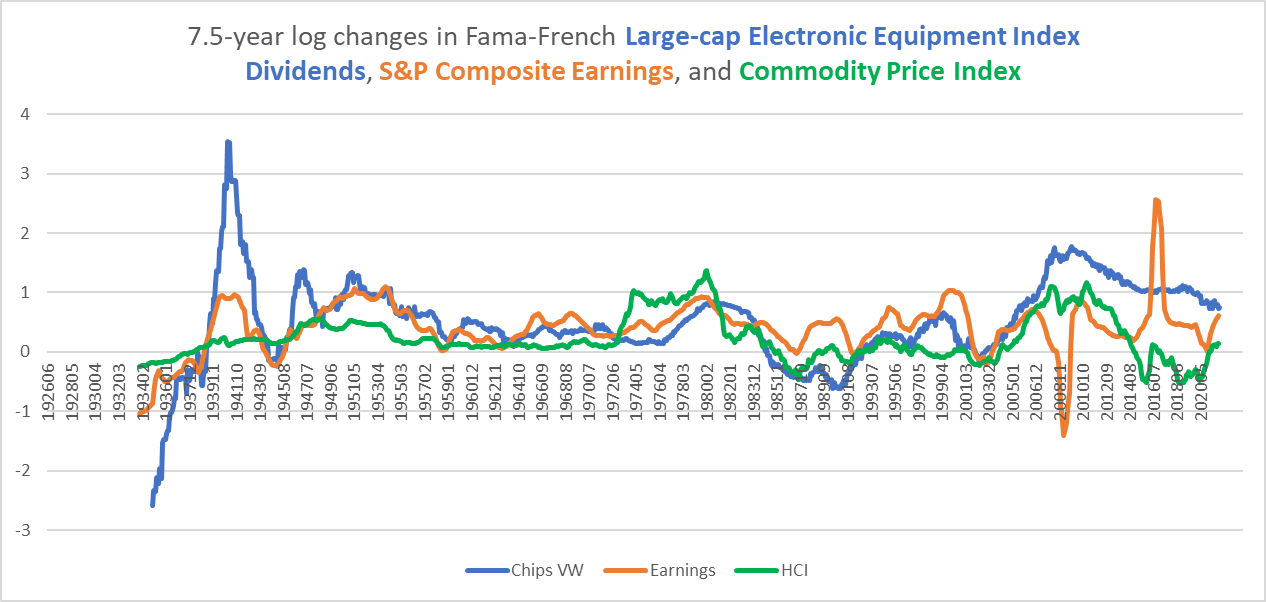
It is hard to estimate long-term growth rates in earnings and commodity prices and especially their relative growth rates, but I have made my argument as to why earnings growth is likely to be lower than commodity inflation for the remainder of the decade (and perhaps well into the next decade): high PEs combined with high long-term earnings growth has historically been followed by a collapse in earnings below the rate of commodity inflation. This happened in the 1930s, 1970s, and 2000s. That does not necessarily mean it will happen in the 2020s, but I think it increases the risk of such an outcome.
The dividend yield and subsequent returns
Unfortunately, I do not have long-term data on the Electronic Equipment industry’s earnings over the last century, so I have to make do with dividend values. Over most of the last century, the chip industry has traded at a low dividend yield relative to the S&P, which is typical of the tech sector as a whole, as I discussed in my recent pieces on the Information Technology (XLK) and Communications Services (XLC) sectors, as well as the electric vehicle industry (CARZ).
The following chart contrasts the dividend yield for the chip industry (calculated by contrasting total returns with price returns) and that for the S&P Composite.
Chart K. Electronic equipment dividend yields are almost always well below the yield on the S&P 500 (Fama-French, Shiller)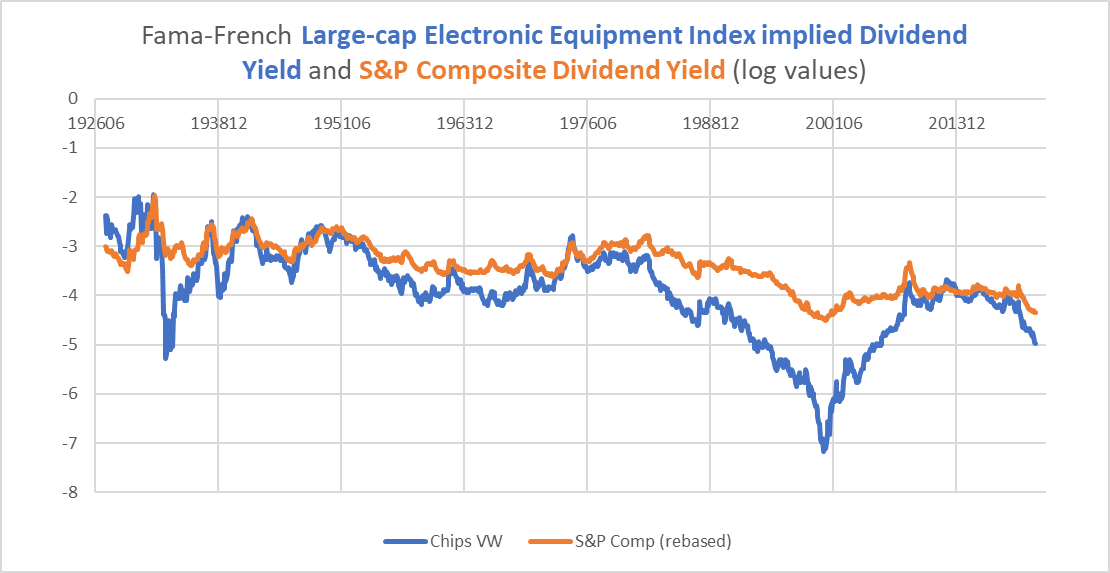
The last four occasions in which the chip industry’s yield rose above the S&P’s (1941, 1949, 1974, and 2013) were great occasions to buy chip stocks, but the previous two occasions (the late 1920s and 1938) were not. Relative levels in these yields would have to be used with caution.
The absolute level of the yield has been a somewhat better predictor of returns, illustrated below.
Chart L. The dividend yield has done a fair job of anticipating long-term returns in semiconductor stocks. (Fama-French)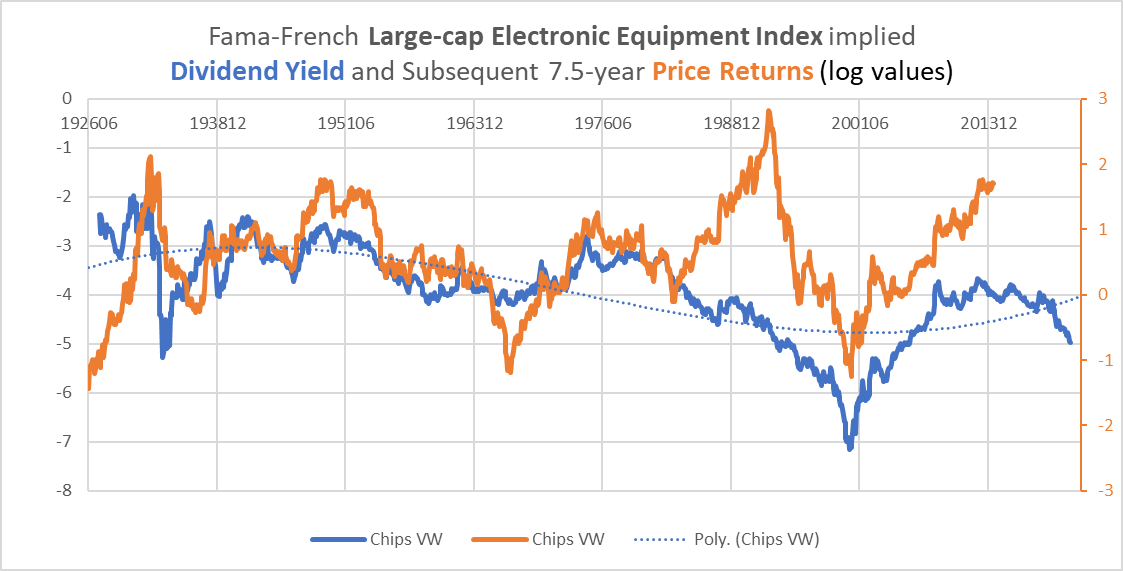
The correlation between the dividend yield and subsequent total returns has been 0.43.
Since World War II, the dividend yield has been driven down by very high price returns rather than a collapse in dividends. Thus, the secular lows in the dividend yield (1960s and 1990s) were followed by low returns in the 1970s and 2000s. The dividend yield is also relatively low (compared both to the S&P 500 and the chip industry’s own history).
But, we have seen the yield low in both of these respects only to be followed by a massive boom. This is what happened in the 1992-2000 period. A yield at historically low levels and well below the S&P 500’s yield in 1992 was followed by an unprecedented boom in the semiconductor industry.
Sectoral divergences
I think a critical difference between 1992 and 2022 is that the tech sector has already experienced a near decade-long boom. As I described in A Primer On Long-Term Sector Rotations And Where We Are Now and elsewhere, when long-term sectoral performance is highly dispersed, and especially when the tech sector has been strong and energy weak, this has typically been followed by a complete reversal of fortunes. Energy outperforms and tech underperforms. This is what happened in the 2000s, for example. The trigger for this reversal appears to have been energy shocks.
The following chart shows the Fama-French Business Equipment and Energy sectors’ performance relative to an average value of all the Fama-French sectors in the 12-industry index.
Chart M. The divergence in tech and energy returns tends to occur near secular market tops. (Fama-French)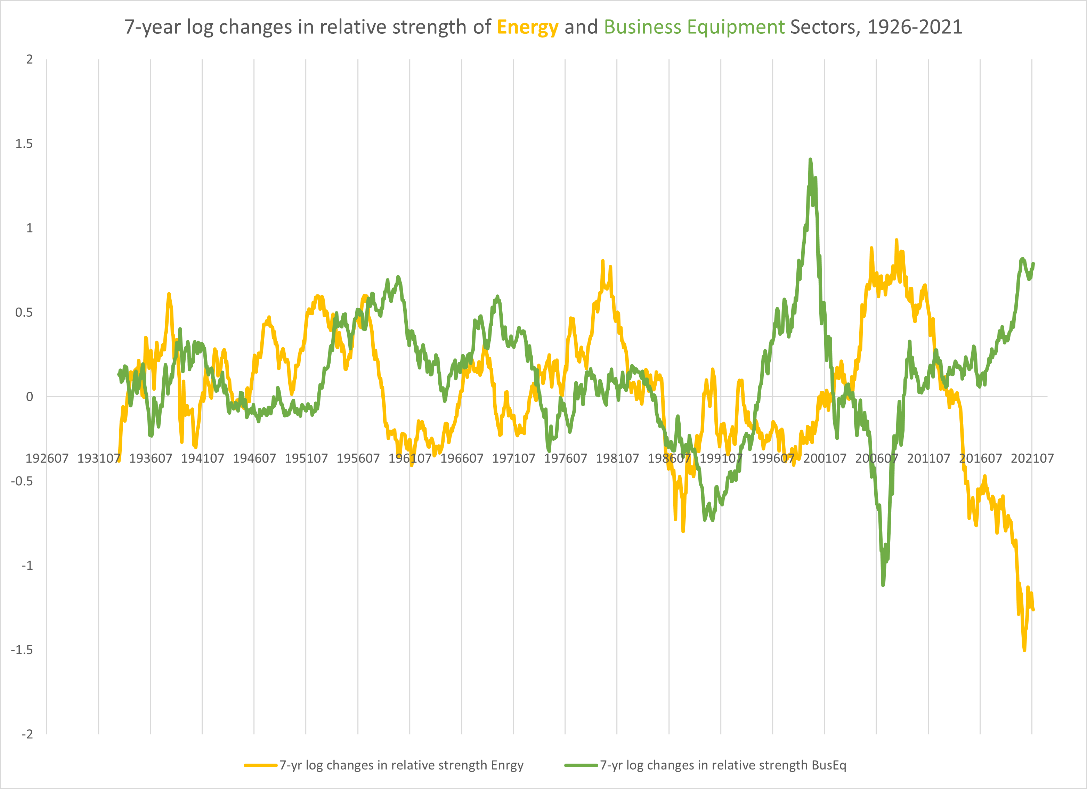
As you can see, this has been one of the pronounced divergences in history. The Business Equipment sector maps almost perfectly onto the XLK (as I demonstrated in the Information Technology piece linked to above), but this particular tech boom has also spilled into the Consumer Discretionary and Communication Services sectors, so it is possible this particular chart underestimates the magnitude of the tech boom.
In any case, conditions over the last year and a half have met all of the conditions listed above for a long-term reversal in sectoral performances.
In sum, there appears to be a cluster of interlinked factors which individually have modest correlations with future performance in the semiconductor industry (and the tech sector of which it is a constituent) which points to low to negative returns for the remainder of the decade.
Cyclical performance
Over the short-term-one to three years-the Electronic Equipment sector has proven itself somewhat less vulnerable to commodity shocks than more consumer- and service-oriented industries (like Personal Services and Autos), but it does have a negative correlation with certain types of cyclical commodity inflation, most notably fertilizers (-0.28), which have been running hot for some time.
Chart N. Historically, semiconductor stocks have not shown themselves to be especially sensitive to commodity inflation, but the “secular” context matters. (Fama-French, World Bank Pink Sheet)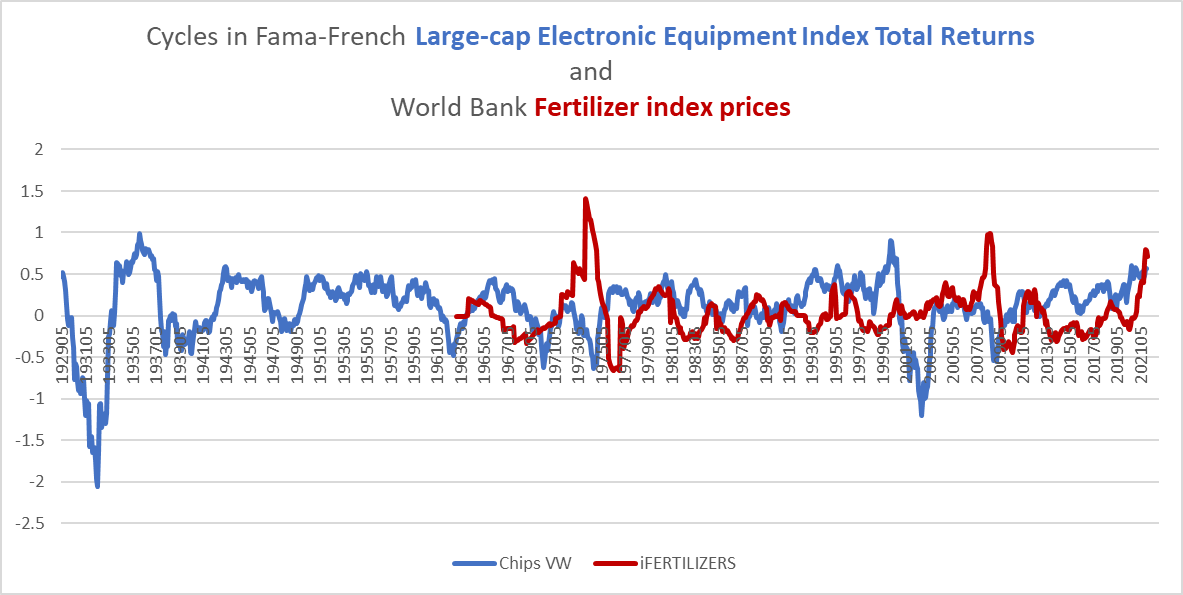
The two previous long-term bear markets in this industry (the 1970s and 2000s, you will recall) did not begin with crippling commodity shocks. Rather, the most severe commodity shocks of those periods (in 1973 and 2008, respectively) came by while the industry was already in a secular bear market. In that sense, the current commodity shock has come at an unusual time-near the end of a bull market rather than near the end of a bear market.
That makes the situation somewhat unusual, but the key, historically, appears to be the connection between the long-term vulnerabilities (described above) and cyclical commodity shocks. The energy shock in 1999-2000 was small relative to the shock in 2008, but because the dot.com boom was part of a severe long-term imbalance, the tech sector was vulnerable to a severe downturn. I expect, therefore, that semiconductor stocks will be punished by the energy shock we are currently experiencing, even if the mechanism by which this is communicated is not especially clear.
Chart O. Energy shocks tend to precede semiconductor crashes. (Fama-French, Shiller, St Louis Fed)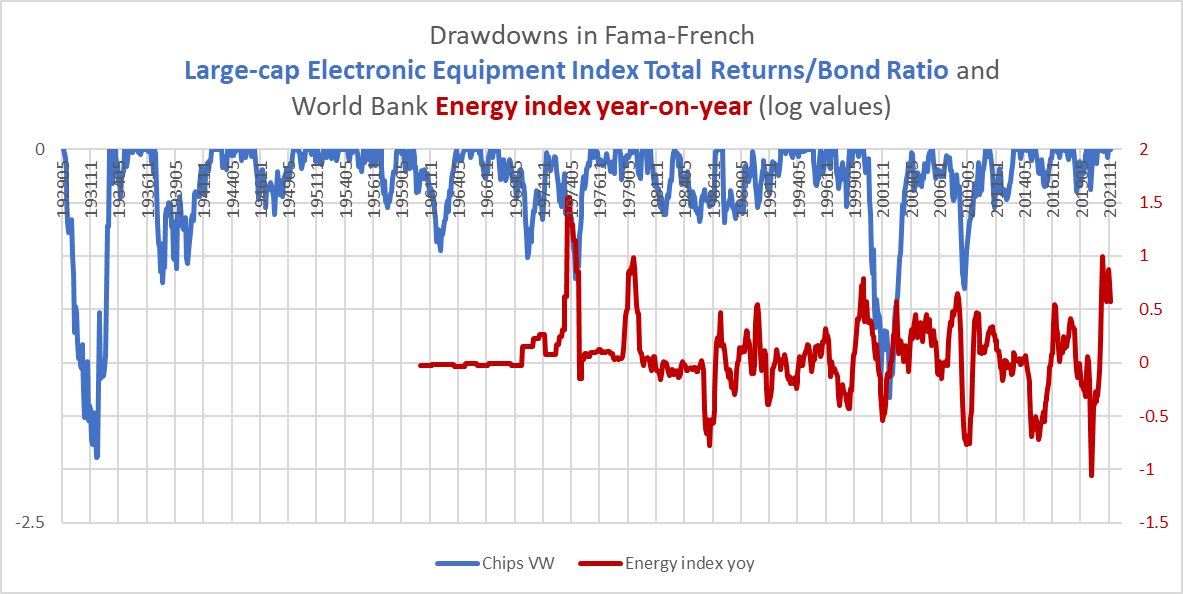
A flattening yield curve-especially when driven by changes in short-term rates-has also been a negative indicator for stocks.
Conclusion
Semiconductors are likely to be a critical component of the economy for decades to come. That does not mean that they will produce positive returns over the coming decade. Historically, periods in which PEs are high (and yields are low), earnings growth is high, sectors have diverged, and energy prices are surging have been followed by a bear market that hits the technology sector especially hard. This is reflected in the history of the semiconductor and electronic equipment industry, as well. Earlier in the year, I penciled in a 50% decline in the S&P 500 over the next one to three years. If semiconductors are to underperform the broader market, we ought not be surprised to see performances reminiscent of the 2000s, when tech indexes, including semiconductor indexes, saw declines of 80%. History never repeats itself, but it often rhymes. This suggests that there is considerable downside risk in the semiconductor stocks over both cyclical (one to three years) and “secular” (seven to fifteen years) durations, despite their critical role in global growth.
Be the first to comment