

Finance students learn that small company investments that can provide excess returns versus less risky large cap, blue-chip stocks. The ‘size factor’ is one of the original components that Eugene Fama and Ken French used to develop their 3-factor model. It worked for quite some time, particularly during the inflationary period of the 1970s.
More recently, however, US small capitalization companies have substantially underperformed their large cap counterparts. We all know the narrative of the past ten years with large cap growth technology names growing year-by-year. Microsoft, Apple, Amazon, Google and Facebook make up the top 5 company weights in US large cap index. Small-issues now comprise less than 2.5% of total US market cap – nearly the lowest the mid-1970s.
The chart below from the latest Weekly Macro Themes shows this stark shift.
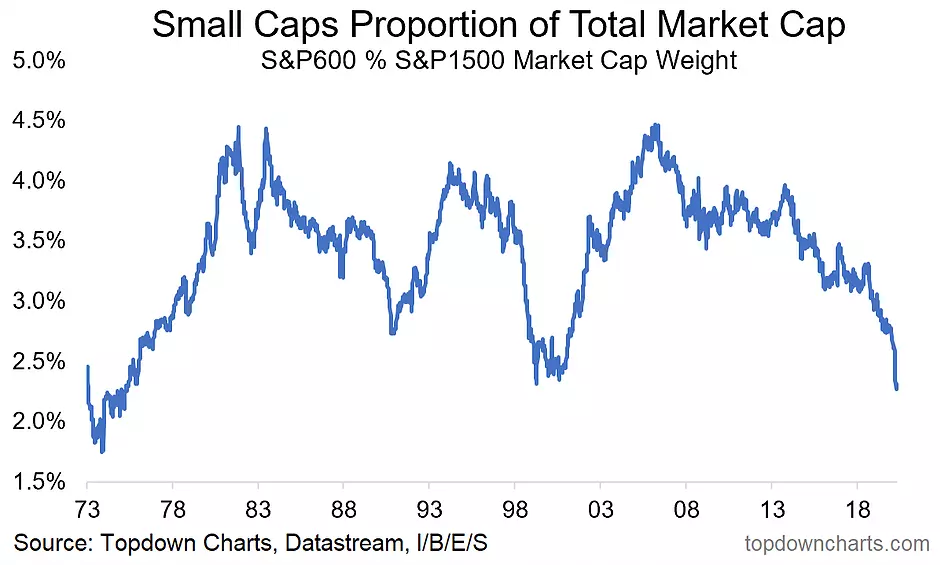
What are the top 5 holdings in the S&P 600 small cap index? You probably haven’t heard of them. It doesn’t matter. What’s important is the sector weights between the two indices.
There are 11 sectors in the stock market. Industrials (18%), financials (17%), information technology (15%), health care (14%) and consumer discretionary (12%) are the largest weights in the S&P 600. For the S&P 500 large cap index, tech is a whopping 25% and health care is next at a 15% weight. So large caps have 10% more technology holdings by market cap versus the small cap index. But is there actually more tech in the S&P 500?
If you lump-in Facebook and Google from the communications sector into technology (Facebook and Google were recently moved from tech to communications) then IT is 30.3% of the S&P 500! So large caps are comprised of nearly 1/3 tech names while S&P 600 is just 15% tech. And that major difference matters when looking at historical sector performance.
Technology has returned 475% in the last 15 years while industrials are up just 182%. It really is amazing how sector performances can trend over long periods. Looking elsewhere, financials, weighted just 11% in the S&P 500, are up only 36% over the last decade-and-a-half. In essence, the US small cap index is closer to an equal-weight sector play (though not precisely) while US large caps have increasingly become a sector-play on tech stocks.
That sector-bet is seen across the investing spectrum. On a style basis, large cap growth is dominated by tech. Popular momentum ETFs have been tilted to tech names too. On the flip side, the underperforming arenas are devoid of tech – such as value stocks and international equities.
How has all this transpired with regard to valuations? We talked about PE10 valuations last week from a number of angles, including for Small Caps. For the first time the mid-2000s, US small cap valuations fell below that of US large caps. Of course earnings uncertainty is high at the moment due to COVID-19’s impacts – but that is why we focus on the PE10 valuation measure which helps to normalize and smooth-out earnings volatility.
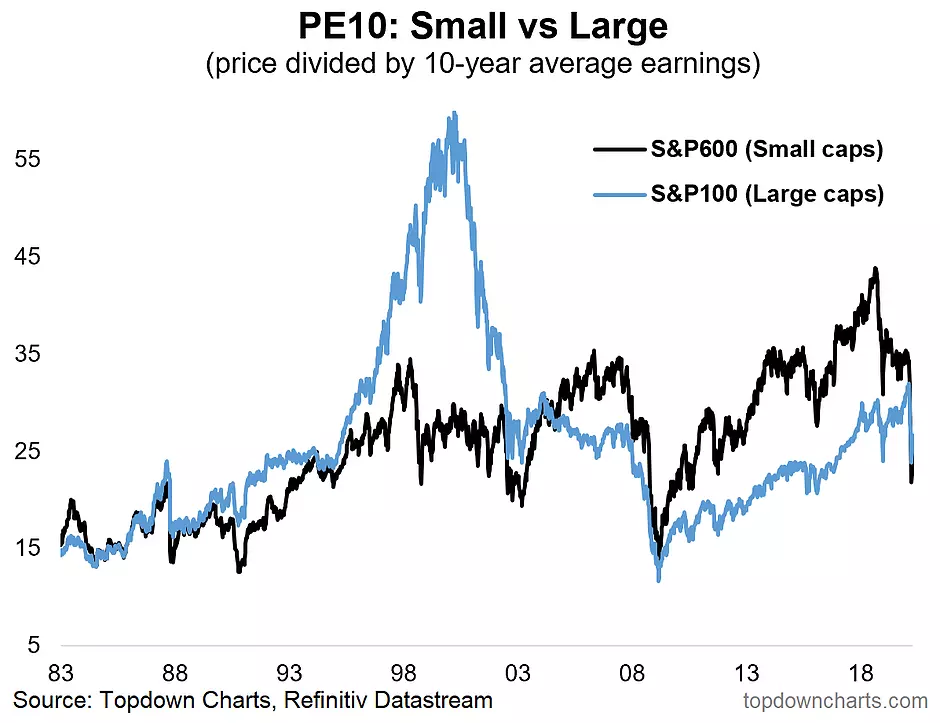
Here’s the point – relative performance has been disastrous for US small cap stocks vs. large caps. As such their market cap share has dropped substantially, and valuations have reset from expensive to arguably cheap. So we think the odds have shifted notably in favor of small caps now.
Disclosure: I/we have no positions in any stocks mentioned, and no plans to initiate any positions within the next 72 hours. I wrote this article myself, and it expresses my own opinions. I am not receiving compensation for it. I have no business relationship with any company whose stock is mentioned in this article.
Be the first to comment