

TU IS
The First Trust Cloud Computing ETF (NASDAQ:SKYY) is a thematic fund offering exposure to the IaaS, PaaS, and SaaS players, with an equity portfolio comprising 66 holdings in the current iteration.
The cloud stocks have been battered this year amid rotation to cheaper, shorter-duration equities, along with the triumph of value investing, with petroleum names returning to the limelight after years of oblivion. As I warned in my December 2021 article on SKYY’s peer the Global X Cloud Computing ETF (CLOU), rich growth premia posed an existential threat to its valuation as the interest rates in the U.S. were almost certainly about to inch higher, though I fairly underestimated the magnitude of tightening since an inflation scare surprised to the upside.
And like CLOU, SKYY has suffered badly this year. In fact, the bear party has essentially erased the alpha it had delivered between its inception and January 2022. For context, during the August 2011 and December 2021 period, SKYY clocked a 21.5% compound annual growth rate, solidly outpacing the iShares Core S&P 500 ETF (IVV), though lagging the Invesco QQQ ETF (QQQ) by about 3.2%.
| Portfolio | IVV | QQQ | SKYY |
| Initial Balance | $10,000 | $10,000 | $10,000 |
| Final Balance | $45,256 | $75,993 | $57,469 |
| CAGR | 15.60% | 21.49% | 18.28% |
| Stdev | 13.54% | 15.67% | 18.41% |
| Best Year | 32.30% | 48.40% | 57.77% |
| Worst Year | -4.47% | -3.20% | -8.73% |
| Max. Drawdown | -19.56% | -16.96% | -16.15% |
| Sharpe Ratio | 1.1 | 1.29 | 0.98 |
| Sortino Ratio | 1.82 | 2.44 | 1.81 |
| Market Correlation | 1 | 0.9 | 0.83 |
Created by the author using data from Portfolio Visualizer
Yet with the first ten months of 2022 factored in, the CAGR drops to 11.9%, below IVV’s result, while the standard deviation remains the highest, and risk-adjusted returns are the weakest.
| Portfolio | IVV | QQQ | SKYY |
| Initial Balance | $ 10,000 | $ 10,000 | $ 10,000 |
| Final Balance | $37,224 | $53,352 | $35,378 |
| CAGR | 12.39% | 16.05% | 11.89% |
| Stdev | 14.66% | 17.34% | 19.87% |
| Best Year | 32.30% | 48.40% | 57.77% |
| Worst Year | -17.75% | -29.79% | -38.44% |
| Max. Drawdown | -23.93% | -32.49% | -46.46% |
| Sharpe Ratio | 0.83 | 0.91 | 0.63 |
| Sortino Ratio | 1.29 | 1.51 | 1.02 |
| Market Correlation | 1 | 0.91 | 0.85 |
Created by the author using data from Portfolio Visualizer
The next chart contextualizes its YTD decline by comparing it with other cloud-focused funds, namely CLOU, the WisdomTree Cloud Computing ETF (WCLD), and Fidelity Cloud Computing ETF (FCLD); the trio has much shorter trading histories, with inceptions in 2019 (CLOU, WCLD) and 2021, respectively.
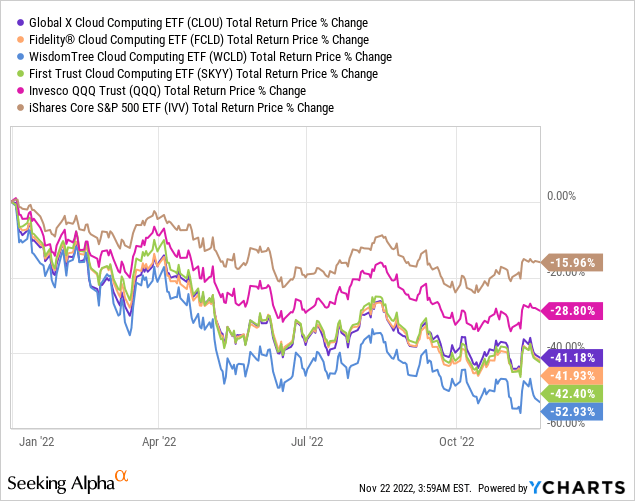
As can be seen, all the cloud ETFs have grossly underperformed both IVV (which has been shored up by its pure value component) and QQQ, which might look like a buying opportunity.
That said, I still see reasons to remain cautious about SKYY and its peers. More on that is below in the note.
SKYY strategy essentials
Let us quickly review its strategy first.
SKYY’s investment mandate is to track the ISE CTA Cloud Computing Index, which targets Cloud Computing companies (they must be classified as such by the Consumer Technology Association). Eligible names face liquidity and minimum market cap tests. Those that successfully passed them are then divided into three categories, namely infrastructure-as-a-service, specifically, firms offering servers, storage, and networks, then platform-as-a-service, or those that allow creating “software in the form of virtualization, middleware, and/or operating systems,” and software-as-a-service. The index features the Cloud Score Weighting (a modified equal weight methodology) and is rebalanced and reconstituted four times a year.
As of November 17, the SKYY portfolio comprised 66 stocks (the index has a limit of 80), with the top ten accounting for 38%. As per my calculations, the weighted-average market capitalization in this mix is over $183 billion, with $1 trillion club members Alphabet (GOOG) (GOOGL) and Microsoft (MSFT), as well as Amazon (AMZN), which has dropped out of this league amid lackluster YTD performance, impacting this figure substantially. At the same time, there is also a meaningful presence of mid- and small-caps, around 41% spread between 34 stocks; this implies quality issues might be uncovered as smaller size correlates with weaker profitability.
Valuation remains a major concern
Even though bulls might point to the fact the inflation issue is abating, thus opening the door for a healthy, more broad recovery in tech growth names potentially spurred by a Fed pivot, I am still of the opinion that the combination of value and quality factors should be paid closer attention to in the first place. This should help minimize downside risks in case of inflation and monetary policy surprises, and any other risks that are aplenty in this volatile market.
The first issue I would like to address regarding valuation is the share of stocks with at least a B- Quant Valuation grade. What I found out is fairly unanticipated, as the share is ~22.6% while I expected single-digits at best. That said, close to 60% are still arguably overvalued compared to their respective sectors and 5-year averages, thus having a D+ grade and worse. For context, as of my December 2021 article on CLOU, the said fund had around 73% of the net assets allocated to overvalued stocks.
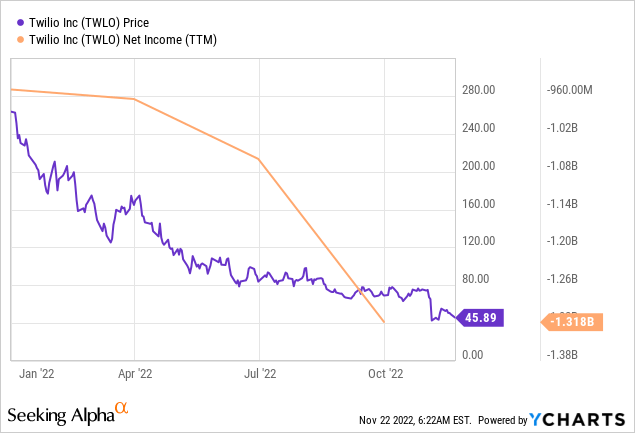
Delving deeper, I believe the earnings yield should also be assessed. The essential vulnerability here is that research & development expenses, an integral part of a cloud company expansion story, would heavily influence the result. For example, Twilio’s (TWLO) 9M 2022 R&D expenses accounted for ~28.7% of revenues, being the major culprit of the deep loss.
Unsurprisingly, the yield is just around 2.9%, which implies a hefty P/E of about 34.4x, a poor result, a direct consequence of a startling 52% of the fund’s net assets being allocated to 43 unprofitable companies. Please do note that I calculate the EY by dividing the sum of net earnings (losses) by the total portfolio market cap.
And in this regard, even the debt-adjusted earnings yield offers little help here since it also reflects burdensome R&D. Expectedly, the DA EY is only 5.4% (an Enterprise Value/EBITDA multiple of 18.6x). At the same time, the median for the IT sector is 7.6%.
Overall, the SKYY portfolio has arguably strong quality, with ~75% of holdings having a B- Quant Profitability grade and better, yet this is not as ideal as IVV, for example, which has ~96%.
Next, what if we compare its weighted-average forward revenue growth rate with the WA P/S ratio? When valuation skeptics point to overstretched multiples, growth-style enthusiasts typically retort there is always an expansion story behind elevated prices that justifies them. So I found out that SKYY investors get a weighted-average forward revenue growth rate of around 19% which comes with a WA P/S of 5.9x and WA EV/Sales of 6x. Apparently, analysts are much more bullish on the cloud segment top-line growth prospects than on the IT sector overall which has a median of just 12.8%; yet the sector median P/S and EV/S ratios are only 2.47x and 2.6x, respectively.
Final thoughts
Investors should decide for themselves whether they are content with SKYY’s premium multiples which come with seemingly robust cloud growth stories. An essential consideration here is whether analyst revenue forecasts are realistic enough, or pundits are underestimating the magnitude of the possible reductions in the IT budgets and their optimism is about to meet harsh reality. In that case, expect SKYY’s multiples to compress, and persistent hawkishness should also contribute.
Inflation and economic uncertainty with pressure from higher interest rates remain major issues. The silver lining is that cloud spending still could markedly increase next year. For instance, Gartner (IT) expects the worldwide end-user spending on public cloud services to climb to almost $600 billion in 2023, which implies a 20.7% growth rate. However, Sid Nag, Vice President Analyst at Gartner, also remarked that
… organizations can only spend what they have. Cloud spending could decrease if overall IT budgets shrink, given that cloud continues to be the largest chunk of IT spend and proportionate budget growth.
Besides, there are signs of weakening demand elsewhere. For instance, during the earnings call last month, MSFT warned about the slowdown of Azure, its cloud computing platform, and one of the cornerstones of its valuation, blaming the darkening economic outlook and the companies’ efforts to “optimize” spending. MSFT has a 3.7% weight in SKYY and 2.2% in CLOU.
In this regard, I am not confident about whether SKYY deserves a Buy rating.
Be the first to comment