

JohnnyGreig
It seems like the bottom is in for shares of Simon Property Group (NYSE:SPG). I never thought shares would dip below $100 again, and sure enough, during the summer lows, shares bounced around the mid to high $90s. It’s almost impossible to call tops and bottoms, and that’s why I had indicated in my Dividend Harvesting series when I added SPG to the portfolio at around $114 that if I wasn’t catching it at the bottom, I would be thrilled to dollar cost average around the $100 level. Physical retail isn’t dead, quality malls aren’t disappearing, and humans aren’t staying inside the same way they did at the beginning of the pandemic. Malls aren’t just about shopping; they have become a destination where people can create experiences. SPG just reported Q2 earnings, and it was a beat on FFO and a beat on revenue while management raised the dividend and increased the annual FFO guidance. I think SPG is an undervalued REIT, paying close to a 7% dividend yield, with much more upside in the tank.
Shares of SPG have been rallying
Over the past month, shares of SPG have rallied 15.15%, and they are up 21.27% off their July lows. Since the pandemic crash, SPG climbed its way from roughly $44.92 to around $171 in November of 2021. Shares are still down -34.06% since November, yet the numbers continue to improve. The retail sector, malls in particular, have a hard time getting people excited due to the e-commerce sector. Amazon (AMZN) is growing at astronomical rates, and its revenue in the TTM for the North American segment is $291.59 billion. I believe this is the start of a new rally for SPG, and I won’t be surprised if we see $150 per share by the holidays as physical retail isn’t disappearing and e-commerce is misunderstood.
Seeking Alpha eMarketer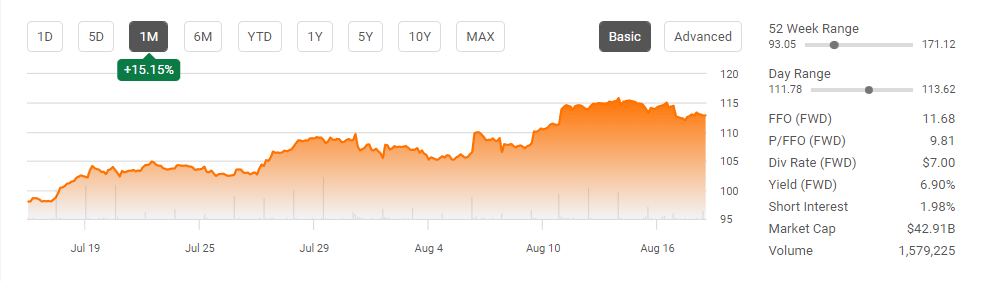

E-commerce in the US is misunderstood when it comes to physical retail. There is no question that e-commerce is growing and grabbing market share, but the entire retail sector is growing, and physical retail is slowly approaching the $6 trillion level. In 2022, the retail sector is projected to generate $6.62 trillion in sales. E-commerce is projected to total $1.07 trillion in sales, which is 16.08% of the retail sector. In 2025 e-commerce sales will grow to $1.61 trillion, and while this is an increase of 50.89% it is still only projected to be 21.88% of the retail sector. While e-commerce penetrates the retail sector and accounts for more of the sales channel mix, sales in physical brick-and-mortar locations are expected to increase by $178 billion (3.2%) between 2023 – 2025. SPG’s locations will be needed as they are critical to the retail sector, and I just don’t see malls going away. If you live on Long Island, do you see a day when Roosevelt Field mall, which is owned by SPG, ceases to exist?
While Analysts were lowering estimates, SPG was busy proving them wrong
Going into Q2 earnings, analysts lowered estimates as the commercial real estate sector was anticipated to incur challenges. The Q2 consensus FFO estimates had 6 revisions to the downside 6 times prior to the release, while only 4 analysts increased guidance. SPG even found itself on Wells Fargo’s (WFC) list of 50 names to short or avoid. On 8/1 SPG delivered a beat on the top, and bottom line as FFO came in at $2.96 ($0.07 beat), and revenue across Q2 amounted to $1.28 billion ($30 million beat). While the street was planting seeds of weakness in commercial real estate, SPG increased its occupancy rate to 2.1% YoY to 93.9%. SPG didn’t just beat estimates; they raised guidance and increased the dividend. SPG guided that FFO will be within a range of $11.70 to $11.77 per diluted share, up from the previous guidance of $11.60 to $11.75. This is also slightly above the street estimated of $11.72 for FFO in 2022. SPG also delivered its 5th consecutive quarterly dividend increase to shareholders.
SPG generated $1.2 billion of free cash flow (FCF) in Q2, up $200 million compared to Q1. In the first half of 2022, SPG has delivered $2.2 billion in FCF, which has allowed them to reward shareholders with dividend increases and buybacks. SPG’s NOI increased to 6.7% from 4.6% YoY for the first half of 2022. Growth has been derived from SPG’s leasing momentum. SPG signed 1,300 leases in Q2, accounting for over 4 million square feet within their properties. SPG has signed over 2,200 leases in the first half of 2022 and, on the earnings call, indicated that there is a large backlog of leases in the pipeline. This has attributed to SPG’s occupancy rate increasing along with revenue and FFO. Roughly 40% of SPGs leasing activity has been new deal volume.
Sometimes the market gets it wrong, and I think the market has it wrong on SPG. The stock continued to decline as SPG’s numbers improved and shareholders were rewarded. SPG told analysts, and anyone who listened to the Q2 earnings call that they would be repurchasing shares as they believed they were trading at a discount to fair value. Throughout Q2 SPG repurchased 1.4 million shares for $144 million.
Even after a Q2 beat SPG is still trading at a discount to its peers
I am using the same companies that Seeking Alpha has listed for SPG’s peer group for my valuation comparison.
There are three main metrics that I look at when comparing a REIT to its peer group, the share price to Funds From Operations (FFO), the EBITDA to Total Debt ratio, and the FFO coverage ratio on the dividend. Funds from operations or (FFO) represent the actual cash generated from the REIT’s operation. It is a widely used ratio for valuation purposes as it has become the primary earning metric in REITs. FFO = Net Income + Depreciation and Amortization + Loss on Sales of Asset – Gain on Sales of Assets + Interest Income. When it comes to REITs, you want to see the FFO coverage ratio rather than going by the EPS.
SPG generates the largest level of FFO per share at $11.74 compared to its peers, as the FRT comes in 2nd with $6.12 of FFO per share. Today, SPG is trading at the lowest price to FFO ratio at 9.61x, with KIM trading at 15.19x. The market has given FRT the largest multiple at 18.41x. The price to FFO peer group average is 15.61x, which is 62.42% larger than the price to FFO SPG is trading at.
Steven Fiorillo, Seeking Alpha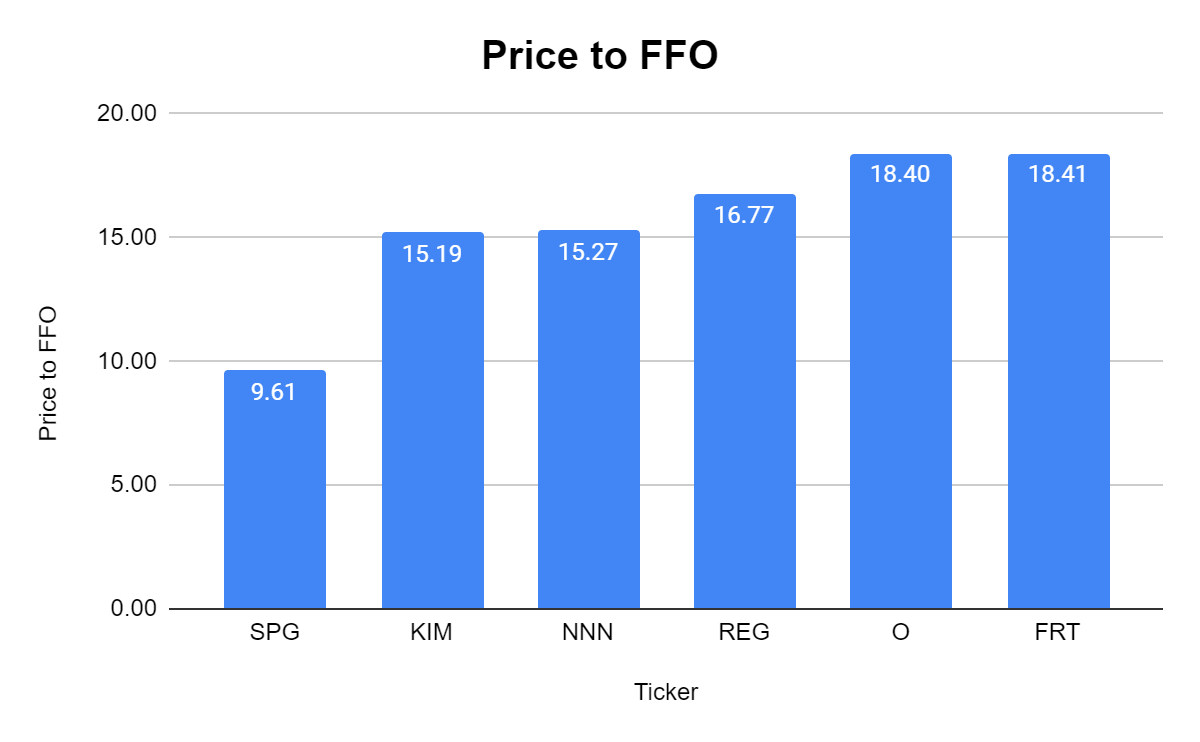
While price to FFO clearly indicates that SPG is undervalued, I look at several metrics to make sure that SPG isn’t just strong in 1 category. SPG generates the largest level of EBITDA with $3.7 billion and trades at a 6.85x EBITDA to total debt ratio. This is slightly above the peer group average of 6.23x, but it isn’t far enough outside of the range for me to be concerned.
Steven Fiorillo, Seeking Alpha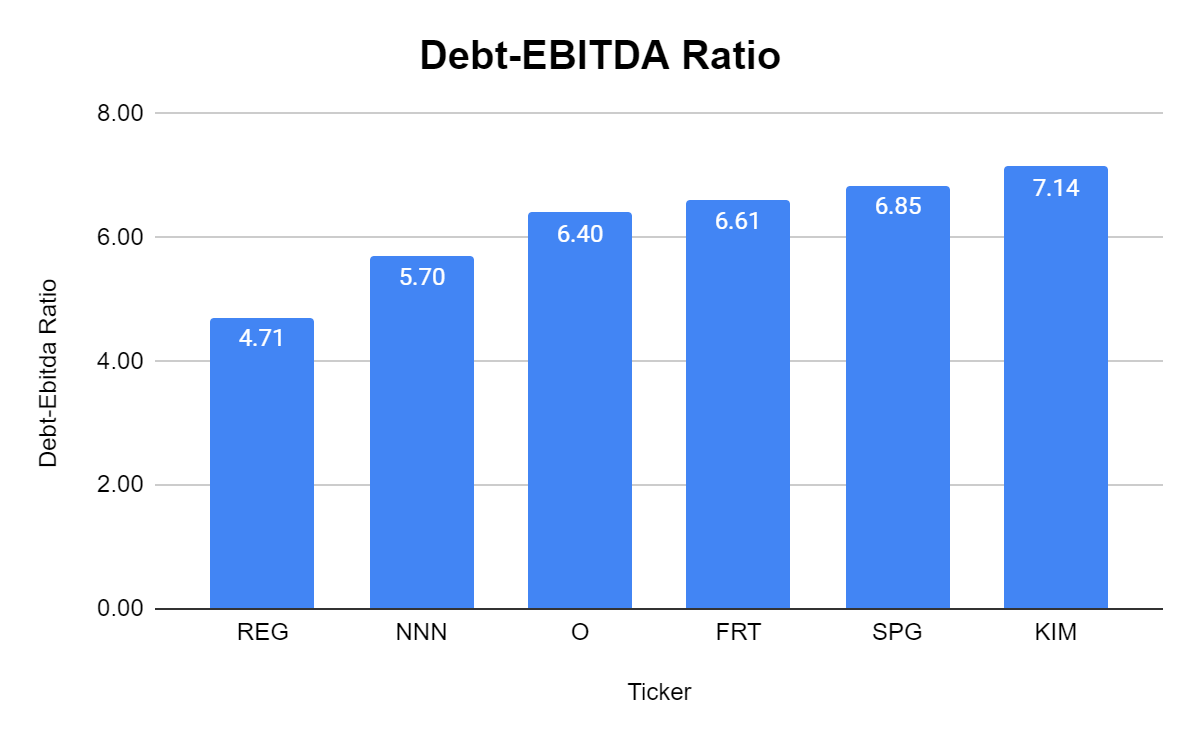
REITs are income investments, and I want to know that the dividend is being covered by FFO. SPG is paying $7 per share on its dividend and produces $11.74 of FFO per share, which creates an FFO coverage ratio of 1.68x. This is well above the peer group average of 1.53x.
Steven Fiorillo, Seeking Alpha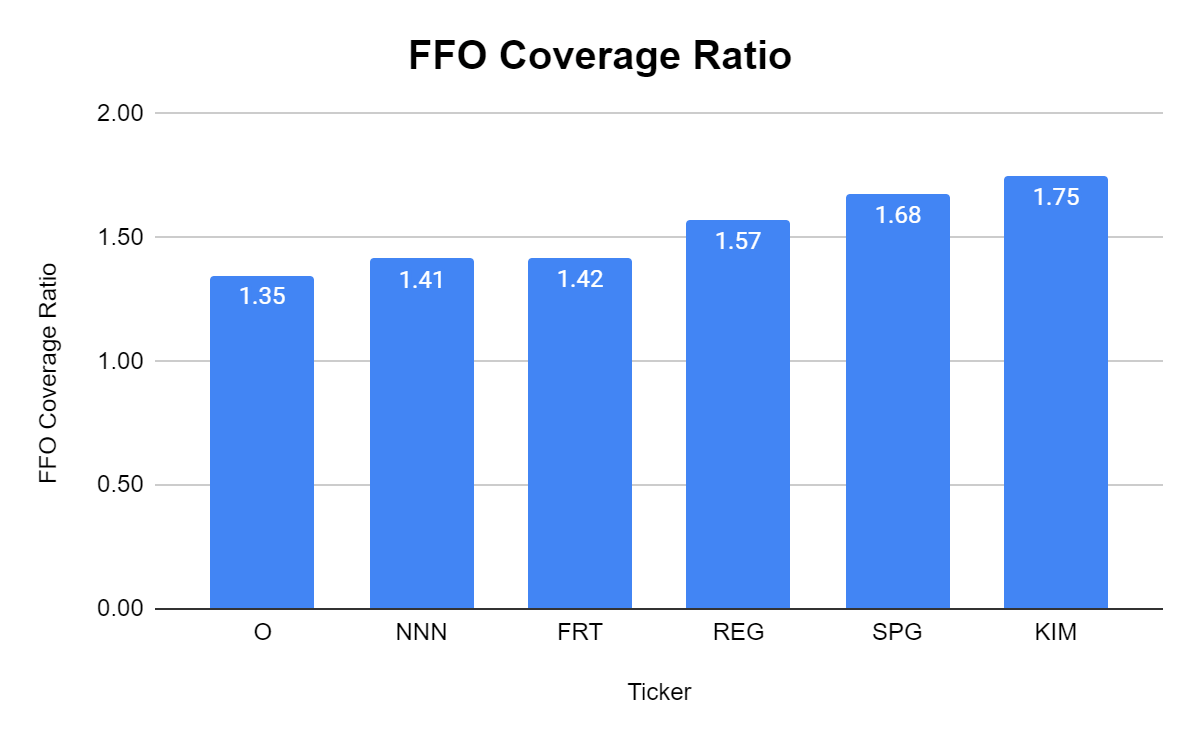
As an income investment, I want to buy the best yields at the best prices. SPG has the largest yield of its peer group at 6.2%, while the group’s average is 4.38%.
Steven Fiorillo, Seeking Alpha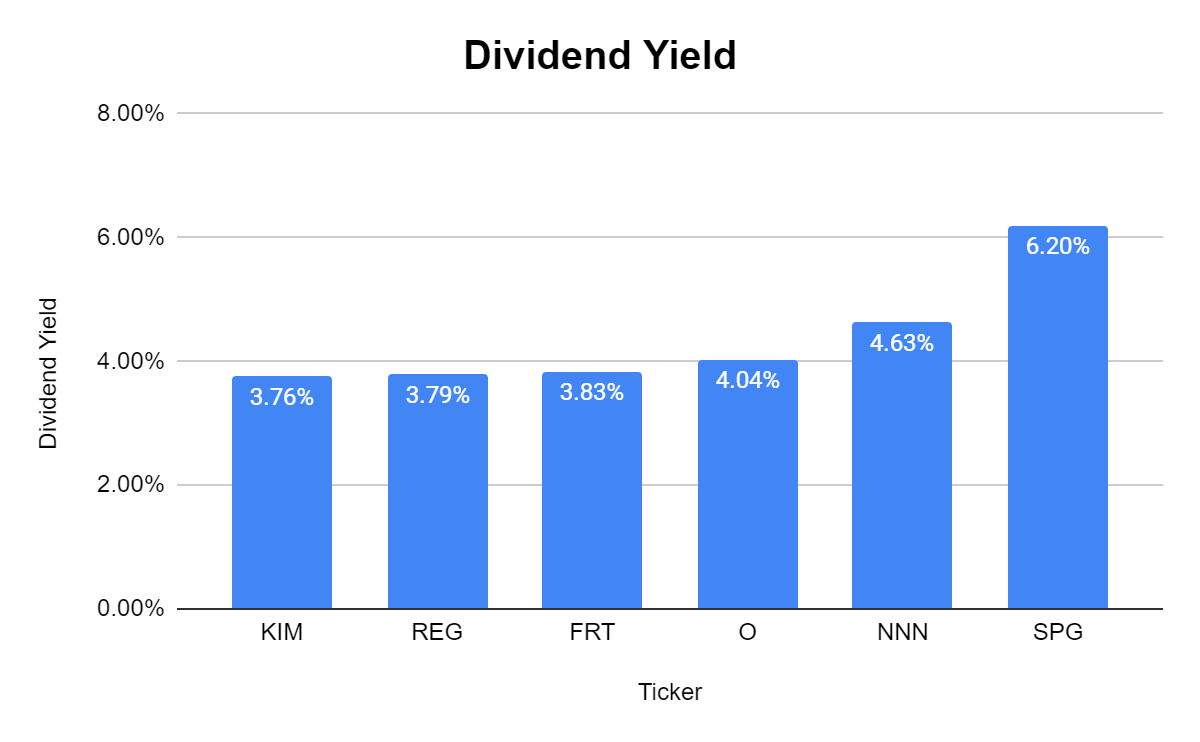
SPG is becoming a dividend giant again
In 2020 SPG reduced its dividend as the country shut down for the first time in many of our lives. This wasn’t SPGs choice, and the dividend cut wasn’t because of poor operating decisions. Since the spring of 2020, SPG’s business has been recovering, and management has been growing its dividend. SPG was previously a strong dividend growth company, and since the reduction, SPG has delivered 5 consecutive quarterly dividend increases. Since Q1 of 2021, the quarterly dividend has increased by $0.45 or 34.62%.
Pre-pandemic SPG paid a quarterly dividend of $2.10, which is $8.40 per share annualized. Management made it a point to discuss that they have repeatedly raised the quarterly dividend and indicated that more increases could be on the horizon. SPG is creating strong momentum as a dividend growth stock, and I believe as the retail sector expands, SPGs occupancy rates will continue to increase, and eventually, the dividend will be restored to its pre-pandemic levels.
Seeking Alpha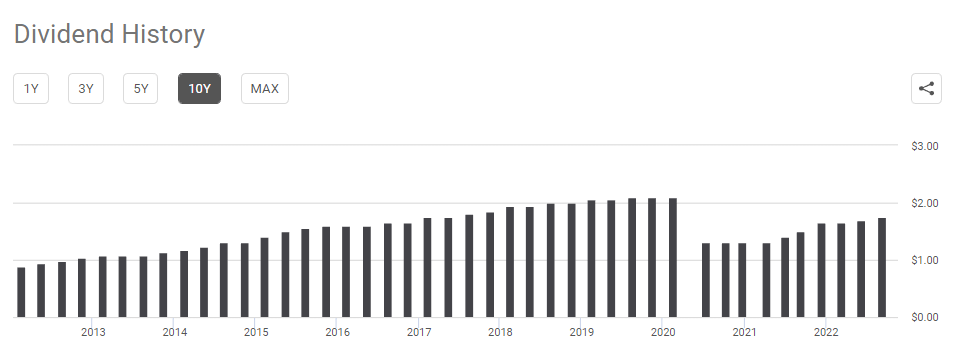
Conclusion
I think SPG is still undervalued based on how the market is valuing its peer group. SPG continues to prove that the mall isn’t dying and increases its occupancy rates which drive revenue and FFO. Today you’re getting a 6.2% dividend yield while SPG is trading at a discount. Today you can pick up shares at a 9.61x price to FFO ratio while the industry average is 15.61x. KIM trades at the 2nd lowest price to FFO at 15.19x. If SPG was trading at $178 per share, it would have a price to FFO of 15.16x, which would be just under KIM and slightly under the group average. With retail continuing to expand in brick and mortar and SPG continuing to drive further occupancy across its locations, I do believe SPG should trade around $178 as this would put its share price in line with its peers. I think SPG is one of the biggest sales in the REIT sector, and I will be happy collecting my dividends while I wait for the share price to increase.
Be the first to comment