

SILVER PRICES, XAG/USD, PALLADIUM, XPD/USD – TALKING POINTS
- Silver price charts indicate XAG/USD may have topped, is heading for bearish correction
- Decline in silver prices mark the start of a bigger downside move as it eyes 1-year support
- Silver is in another compression zone, opening door to another bullish or bearish breakout
SILVER OUTLOOK: XAG/USD EXHAUSTED?
Silver prices have rallied almost five percent after the compression zone between descending resistance and support at 17.440 catapulted the precious metal to multi-month highs. However, XAG/USD’s failure to clear the September peak at 18.625 was met with disappointment and ultimately ended with the precious metal suffering its biggest one-day loss since January 28.
XAG/USD – Daily Chart
XAG/USD chart created using TradingView
Looking at a weekly chart shows that the bearish correction in the near term may precede a larger downside move in the future. Since May 2019, silver prices have traded along an uptrend, but resistance at 18.467 has managed to keep XAG/USD’s upside potential in check. However, as the area between the ceiling and uptrend narrow, silver prices may start to get pressurized until they break and reveal a directional bias.
XAG/USD – Weekly Chart
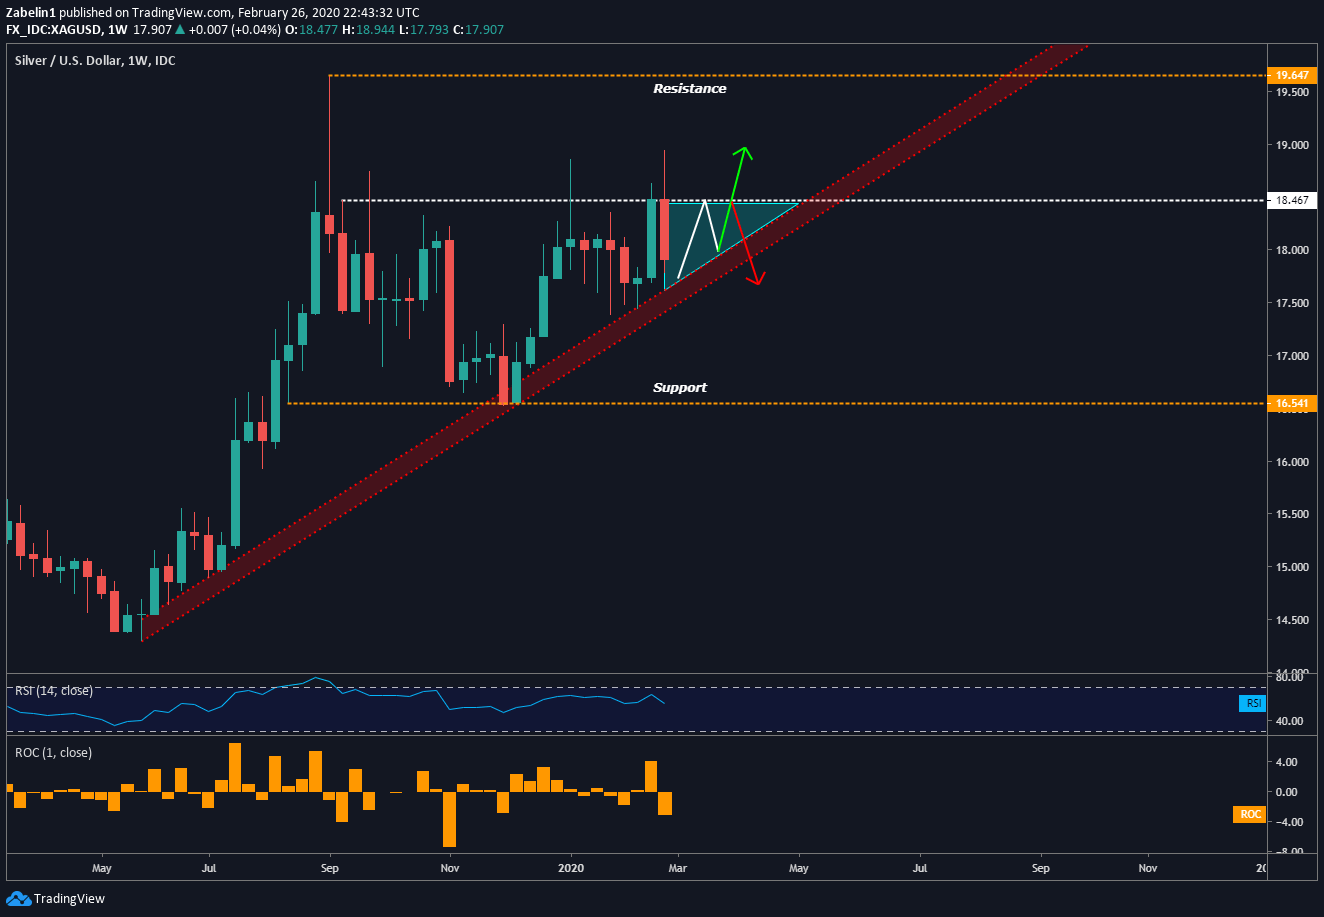
XAG/USD chart created using TradingView
Looking ahead, if XAG/USD breaks above 18.467 with follow-through, it could catalyze a bullish spike and propel the precious metal higher until it encounters friction at the 19.467 ceiling (labelled as “resistance”). Conversely, a downside breakout could cause silver prices to plunge until it hits 16.541 where selling pressure may be overwhelmed by buyers looking for a bottom.
SILVER TRADING RESOURCES
— Written by Dimitri Zabelin, Jr Currency Analyst for DailyFX.com
To contact Dimitri, use the comments section below or @ZabelinDimitrion Twitter
Be the first to comment