

Bet_Noire
My last bullish article in June here on the iShares Silver Trust ETF (NYSEARCA:SLV) explained how bearish market players were becoming, with statistical odds shifting solidly into the buy column. Well, since that effort silver has declined another 10%, and bearish positioning in the market has become quite extreme. Trading silver for 35 years (this is not my first rodeo), it appears a major bottom is at hand or quickly approaching similar to the 2020 pandemic panic selling in this sometimes industrial metal, sometimes monetary hedge, sometimes jewelry favorite.
I went through and reviewed my valuation formulas again this week looking at silver vs. gold, M2 money supply changes, and U.S. Treasury debt numbers over the last 60 years. Don’t laugh, but to reach the same relative valuation vs. the 1980 spike peak of this precious metal vs. its monetary equal of gold, U.S. fiat currency in circulation, and future paper money printing called government debt, silver would have to trade above $100 dollars per ounce, not $19! So, to say silver has serious potential upside, perhaps like the recent past’s cryptocurrency craze rise, is no understatement of what could happen soon. Assuming we get back to all-time “nominal” highs around $50 an ounce or shoot into a multiyear bull market move past $100, you may wish you had bought as much silver as you could today!
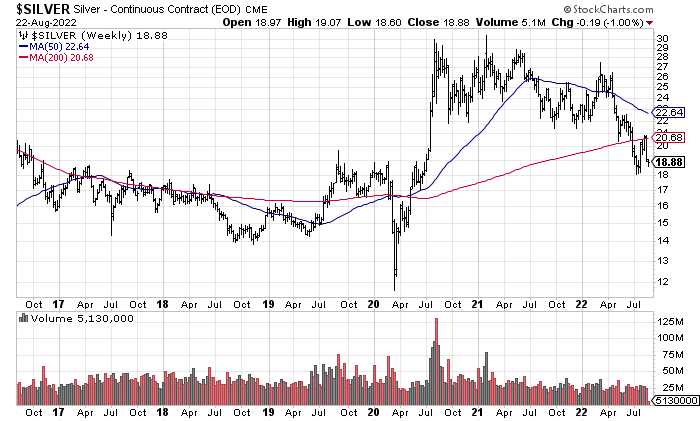
StockCharts, 6-Year Silver Futures, Weekly Data
With bonds and equities sinking this year, why not search for an uncorrelated investment return to financial assets (over periods measured in months or less), that prospered in the 1970s when inflation rates ran hot. Given the non-zero chance of a world war developing from Russia’s invasion of Ukraine, or the possibility of a second major war starting in Asia on a Chinese invasion of Taiwan, or the odds the U.S. dollar will be severely devalued soon as another global recession gets started this year, avoiding silver is a truly poor choice for investors. A better question is how much should you own in portfolio construction?
Bearish Investor Sentiment = Bullish Price Setup
Perhaps the single data point that gets me excited about silver’s immediate future is speculators, hedge funds and small investors in the futures market were net short a few weeks ago for the first time since the middle of 2019. The Commitments of Traders [COT] report, where brokers and the COMEX track who is buying and selling futures contracts, showed the type of pessimism usually witnessed just before large reversals higher in price. In contrast, commercial hedgers (miners, producers, refiners) were net long the greatest number of contracts since May 2019, circled in green below. Today’s setup for a turnaround in price is also mirroring the November 2018 price bottoming COT backdrop.
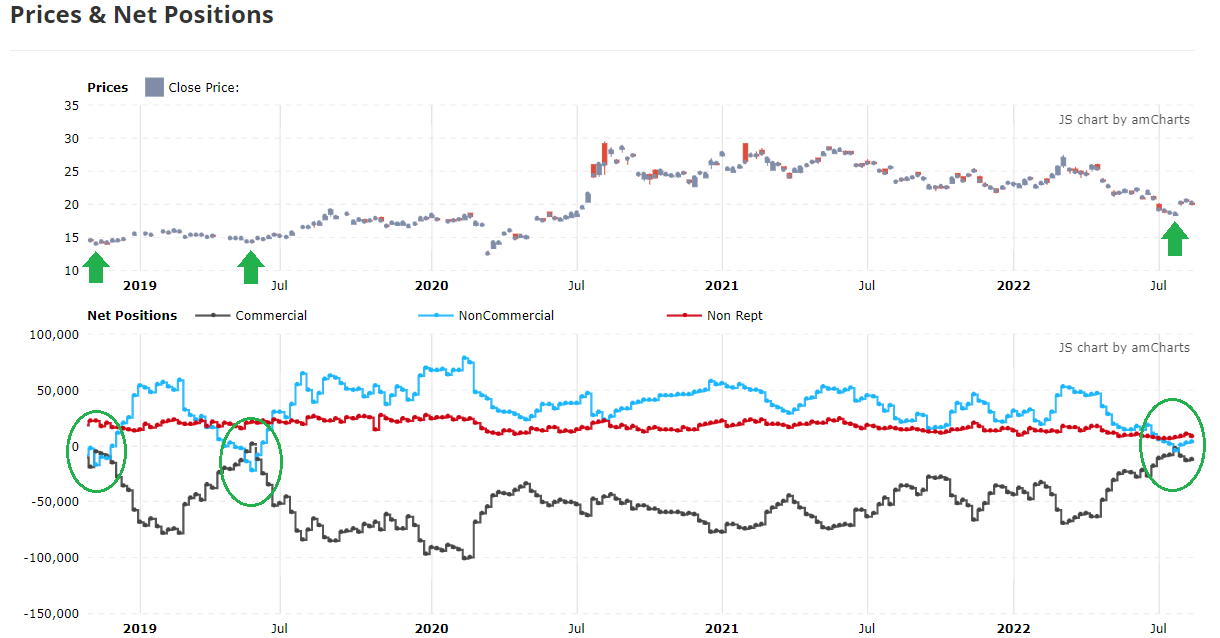
Tradingster Website, Silver Price Vs. Weekly COT Report, Author Reference Points, October 2018 – Present
Relative Monetary Valuation
Looking at long-term valuation ideas, with silver acting as an excellent hedge to paper money devaluations over thousands of years and numerous civilizations/political designs, silver is getting incredibly cheap again. Currently, it is about as inexpensive in a relative comparison sense to the important 2000-02 and 2017-19 lows. Here’s why.
Gold To Silver Ratio
The gold to silver ratio had a U.S. historical average of 15:1 or 20:1 set in stone as gold/silver coins were used as the method of money and payment in early America. Over time the direct ties between the two were broken as silver prices traded more freely about 140 years ago (following official silver devaluations to increase the money supply). Then we left an official gold convertibility standard for dollars, previously set at $35 per ounce, during the late 1960s into 1972. At that point, gold had drifted to US$50 an ounce and immediately exploded to $200 in 1974 as confidence in the dollar was shaken by devaluations vs. oil, grains, and other commodities.
Anyway, the worst relative valuations in the modern era of silver vs. gold came in 1990 and for a few days in early 2020 during pandemic shutdown liquidations. A gold to silver ratio a little over 100x was reached in each instance. Today’s 92x ratio is not far off the worst number in America’s history. Compared to a 55-year average just under 60x since we left the gold/silver standards for the dollar, $19 right now is a good 35% discount to the 55-year average comparison. I would consider a silver price closer to $30 a more honest valuation, with swings to the 1970s decade-average ratio of 35x bringing a “fair value” of $50 per ounce. And, that’s assuming the price of gold remains unchanged, after it has risen +8% compounded annually from the late 1960s.
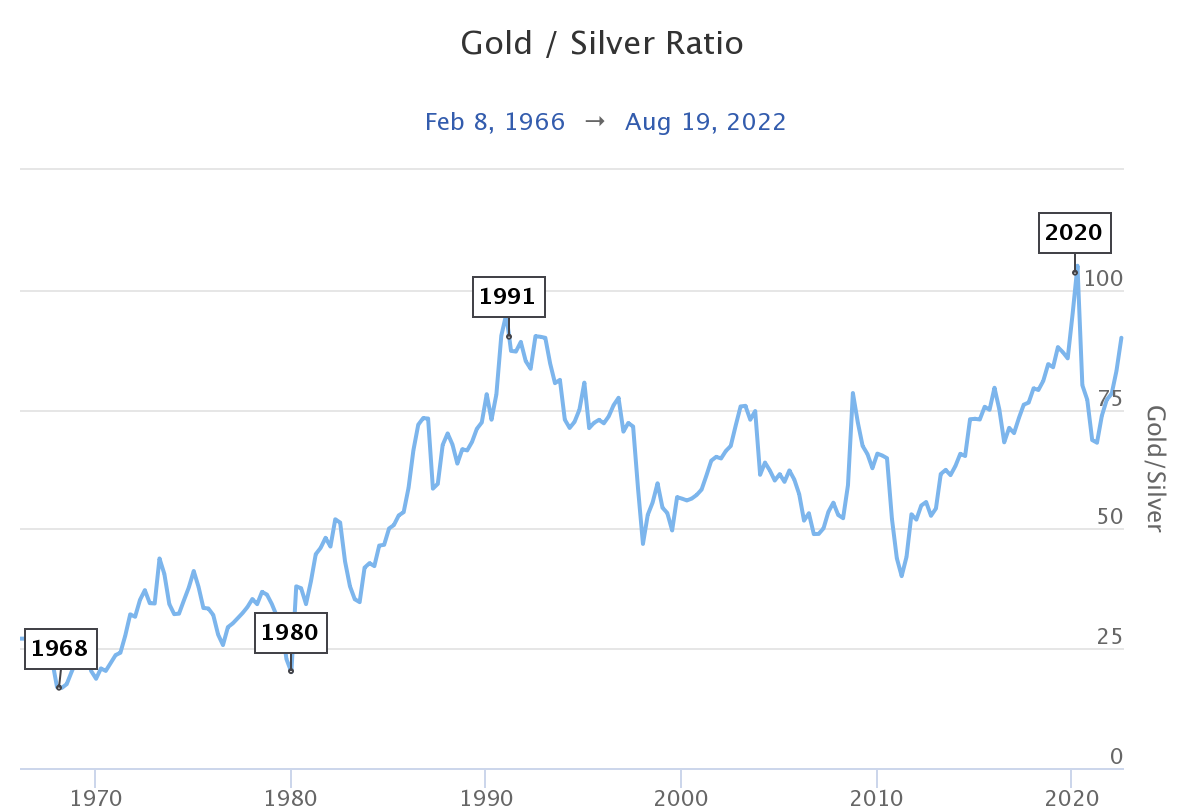
Longtermtrends – Gold/Silver Ratio, 1967-Present
Silver Vs. U.S. Money Supply
An even stronger silver buy argument comes when you look at the explosion of paper money in the U.S. since leaving a monetary-metal standard. Below is a graph using a similar percentage scale to compare the silver price to the M2 money stock. When we were in the process of leaving gold/silver links behind, M2 was around $600 billion. Today M2 is $21.6 trillion and climbing faster and faster, 35x greater than the mid-1960s. However, silver has risen only 10x in price from $2 to $19 an ounce, over the same span. If silver completely hedged the 97.15% debasement in each dollar’s worth, price would be closer to $70 an ounce. To reach a similar relative value vs. M2 as the 1979-80 Hunt Bros. attempt to “corner” the silver market, poor man’s gold would have to trade at $800 an ounce currently! What I am trying to relate is if the world falls apart, and confidence in the dollar evaporates, holding silver over the next 5-10 years may prove the type of percentage winner as owning Big Tech stocks over the last decade. The all-time low silver valuation vs. M2 was between 2002-04, which would be the equivalent of $14.50 an ounce today.
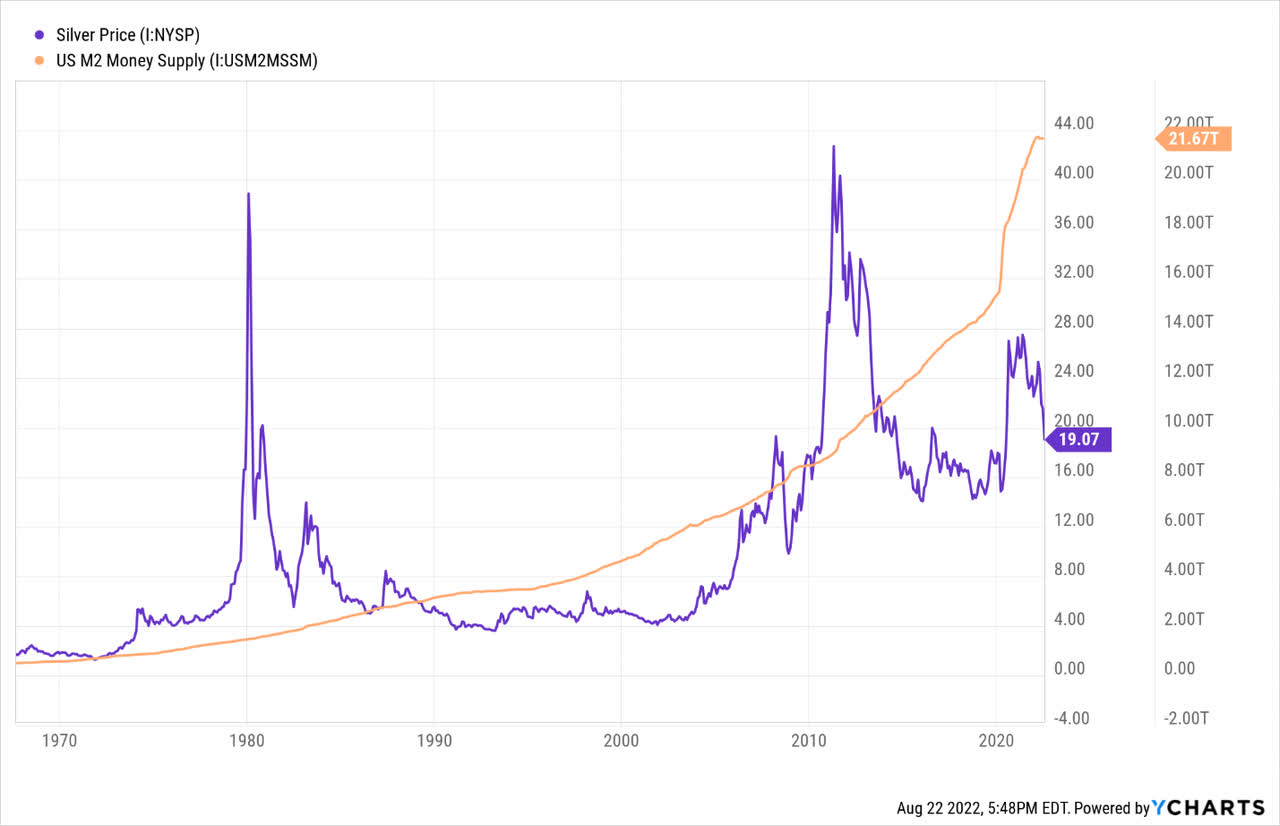
YCharts, Silver Price Vs. M2 Money Supply, 1968-Present
Silver Vs. Treasury Debt
Again, since the U.S. can never repay $30 trillion in debt with the dollar holding a constant value, future money printing is required to cover our debts and prevent a hard default. Treasury debt is effectively a guide and requirement for money printing down the road. Total Treasury debt has climbed from $350 billion in 1968 to $30.4 trillion in August 2022, that’s 86x more! To offset this future money printing idea, silver would have to rise from $2 in the late 1960s to $172 per ounce now, if it held its relative value to paper government debt on a 1:1 basis. There’s more to it of course, like the cost of production and immediate demand for the metal, but the simple concept of silver as a monetary hedge is easy to understand with historical precedence all over the world. Again, the Hunt Bros. bubble blowing was the high-water mark for silver vs. Treasury debt. The same relative valuation would be $1,089 per ounce currently! The all-time low for this calculation came on the March 2020 pandemic dump, which works out to an equivalent price of $15 today.
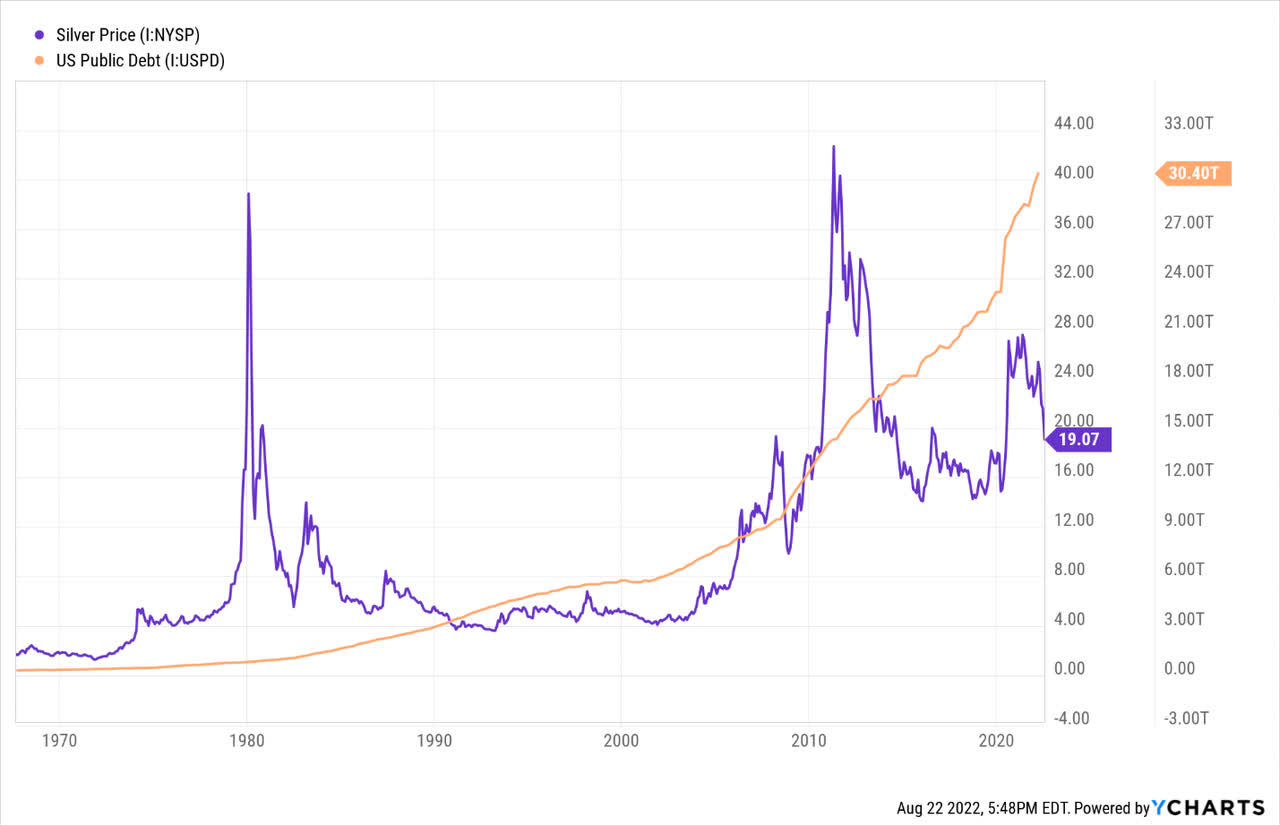
YCharts, Silver Price Vs. U.S. Treasury Debt, 1968-Present
Add Silver To Your Portfolio
The easiest way to own silver in your brokerage account is through the iShares Silver ETF. It charges 0.5% in annual management and storage fees for AUM of roughly $10 billion in silver bullion. Other silver holding products with smaller size (less liquidity for trading) are Aberdeen Standard Physical Silver (SIVR) and Sprott Physical Silver (PSLV).
Pictured below, on a 6-year graph, iShares Silver has done a respectable job of mimicking silver spot quotes over time, minus the annual management fee.
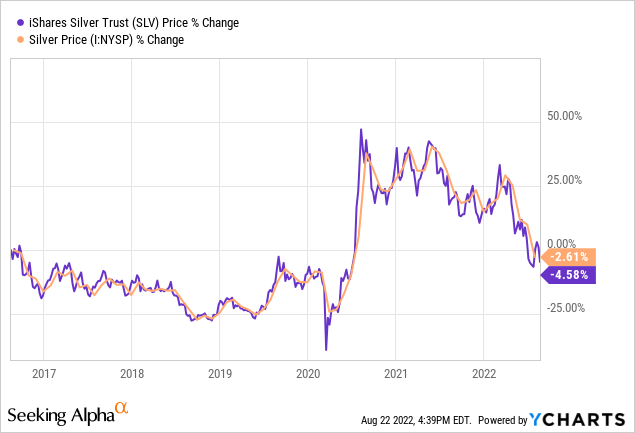
YCharts, Silver Spot Vs. iShares Silver ETF Price Change, 6 Years
On the chart of daily trading action below, the past 18-months have outlined a price decline in iShares Silver. However, the momentum indicators I track have not expressed an aggressive level of liquidation as part of the trading equation. In fact, many of my favorite calculations like the Accumulation/Distribution Line, Negative Volume Index, and On Balance Volume are positioned at similar or higher levels than September. Silver has a history of reversing in a bullish manner without warning, especially on geopolitical events. My view is the latest bearish sentiment in the futures contract market argues waiting for further downside is quite risky. If you want to own silver bullion and related products, now is the time to buy.
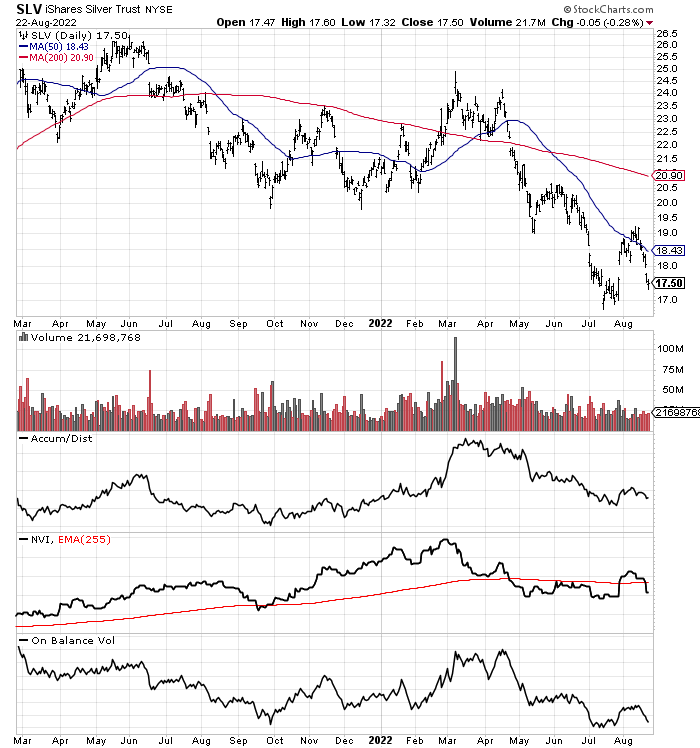
StockCharts, 18-Month Daily Values, SLV
Final Thoughts
Reviewing the original Dotcom bubble period of the late 1990s and early 2000s, or the latest Big Tech boom since 2012, international capital flows into American markets, with extreme confidence in the dollar as the only unit of commerce globally have caused investors to shun precious metals. But what happens next as inflation explodes and record overvaluations in the U.S. equity market (focused on Big Tech) start to unwind?
It’s borderline insane with all the problems facing the world, both financial and geopolitical, that investors and analysts are bearish on silver today, with price the same as 2016! I figure a silver “fair value” of US$40 to $50 an ounce currently is more appropriate for this critical metal in the manufacture of solar panels and other greener energy solutions, which has a history of rising sharply when confidence in the world is low, and has typically benefited over the long term from U.S. banking policy centered on printing/borrowing ever more dollars (averaging 8%-9% annual growth since the late 1960s). And, if the world falls apart soon, projecting $100 or even $200 silver over the next decade seems quite reasonable. Once the masses figure out the U.S. cannot repay $30 trillion in Treasury debt without massive inflation (I wrote a story last week here about the Fed and Treasury “soft” default, rising inflation scenario playing out in 2022), a rush of capital could swoop into the precious metals market, with silver receiving new interest as perhaps the most undervalued and under-owned metal in the world today.
Given industry estimates of about 1 billion ounces in annual supply from mines and recycling, and the fact this supply is already failing to meet industrial, jewelry and investor demand by almost 100 million ounces annually in 2021-22, any extra rush of buying by hedge funds, banks and brokerage houses, billionaires and regular Joe’s could send prices into overdrive at any moment. Considering Apple (AAPL), Microsoft (MSFT), Alphabet/Google (GOOG) (GOOGL), and Amazon.com (AMZN) have a combined market value of better than $7.5 trillion today, silver’s $19 billion in annual production worth at $19 per ounce is miniscule. Additionally, estimates of readily available above-ground stocks (excluding jewelry and parts for industrial products, which can be recycled) range from 2.5 billion to 3.5 billion ounces in bank vaults, held by commodity exchange warehouses, sold as collectable coins/money, and held in bullion ETFs. Using the high number, that represents $66 billion in market value, a negligible sum vs. today’s $30 trillion in Treasury IOUs or $35 trillion U.S. equity market total.
I suggest the typical small investor should have 10% to 15% of financial assets (cash, bonds, equities) invested in gold/silver monetary and political hedge positions. Of this, 2% to 5% should be centered in physical silver bullion and related ETFs for long-term investments. Wall Street textbooks have recommended 5% to 10% precious metal weightings for decades. So, I am thinking a higher-than-normal allowance is reasonable, supported by today’s low relative valuations for precious metals, multiplied by plenty of turmoil to hedge in the world. If silver is headed to $100+ an ounce over the next decade, you will wish you had opened a larger position at $19 in August 2022.
Thanks for reading. Please consider this article a first step in your due diligence process. Consulting with a registered and experienced investment advisor is recommended before making any trade.
Be the first to comment