

jetcityimage/iStock Editorial via Getty Images
The Sherwin-Williams Company (NYSE:SHW) is known for their long-history of delivering branded and private-label paint-related products to customers all over the world. Their products are almost ubiquitous in over 4,400 company operated stores and facilities in the U.S., Canada, the Caribbean, and Latin America.
Over the years, long-time shareholders have been rewarded with significant share price appreciation and years of dividend payouts that have grown at a ten-year CAGR of 16%. In the past two years alone, the share price has rapidly accelerated to record levels. While a pullback is underway, pricing remains elevated
In 2021, the company reported record sales. And the strong demand is expected to continue through 2022. Margins, however, were negatively affected by inflationary pressures. The inability to fully offset these costs contributed to lower net income, despite the strong sales figures. While the outlook for the paint and coatings market remains positive, margins are likely to remain compressed at least through the first half of 2022.
SHW has strong fundamentals and is still generating adequate cash flows to fully cover their investments in growth and their dividend payouts. But shares appear to be trading at a premium to peers and their own historical averages. An underweight allocation, therefore, is justified given the elevated downside risk ahead of earnings.
Business
SHW develops, manufactures, and sells paint, coatings, and related products to a wide group of end users primarily in North and South America, with additional operations in the Caribbean region, Europe, Asia, and Australia. Customer recognition of the company’s trademarks and trade names owned or licensed by the company is a significant contributor to total net sales. Some notable brands and tradenames of the company include Sherwin-Williams, Cabot, HGTV HOME by Sherwin-Williams, PaintSheild, SuperDeck, and Sher-Wood, among many others.
SHW operates in three reportable segments: The Americas Group; The Consumer Brands Group; and The Performance Coatings Group. In 2021, the company reported +$20B in total net sales, 56% of which were attributable to The Americas Group. The next largest segment was The Performance Coatings Group, who accounted for 30%.
Sales Disaggregation – Form 10-K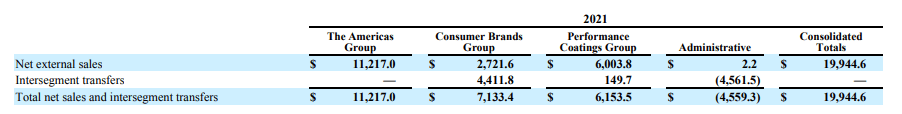
From a quarterly perspective, more than half of total sales occur during the 2nd and 3rd quarter of the year, which coincides with the spring and summer months. Historically, it has been the norm of the company to experience this level of seasonality in their business.
Quarterly Sales Summary – Form 10-K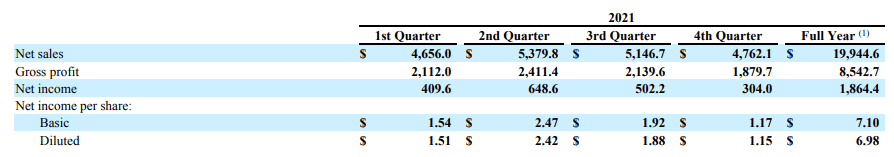
The primary raw material inputs into the company’s products include resins and latex, pigments, and various additives and solvents. A significant portion of these materials are sourced from upstream petrochemicals and related commodity feedstocks, such as propylene. As seen in the quarterly breakout of sales, the company’s margins were lower in the fourth quarter than in prior periods. This was due to inflationary pressures on materials, which make up the majority of consolidated cost of goods sold.
Competitors
Though SHW is a leading manufacturer and retailer of paint-related products, the company faces significant competition from many local, regional, national, and international competitors. Notable competitors within the industry include other paint and wallpaper stores, mass merchandisers, and home centers, among others. Additionally, there are a multitude of other branded and private-label products offered by various other private and public companies. A few notable competitors within the Specialty Chemicals industry include The Masco Corporation (MAS), PPG Industries (PPG), and DuPont (DD).
Below are the market caps of several publicly traded competitors, available from the Seeking Alpha Peer Comparison Tool. Besides MAS, who is considerably smaller, all peers in the industry have market caps of more than +$25B. At a cap of +$64B, SHW is the largest among the group included for comparison. The greater size and scale of SHW is a competitive advantage that affords the company greater access to financial and operational resources.
Seeking Alpha Peer Comparison Tool – Market Cap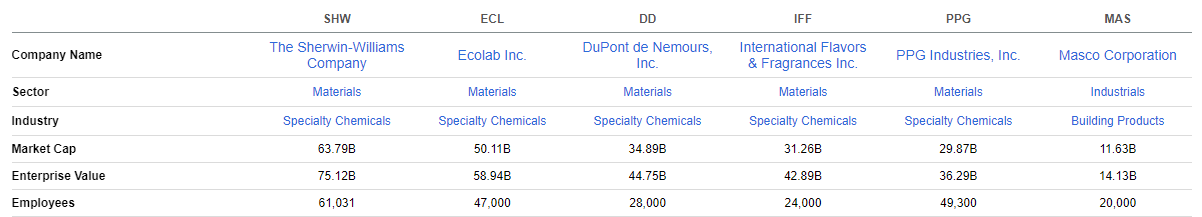
SHW has lagged their peers in total returns YTD, despite performing strongly over a three-year time span. Their returns over the past one year and one month, however, are little changed as opposed to some of their peers.
When compared against the broader S&P, which is up about 8% over a one year timespan, SHW is lagging. Additionally, the S&P is down only 2.5% over the past three months versus a decline of nearly 17% for SHW.
Seeking Alpha Peer Comparison Tool – Total Returns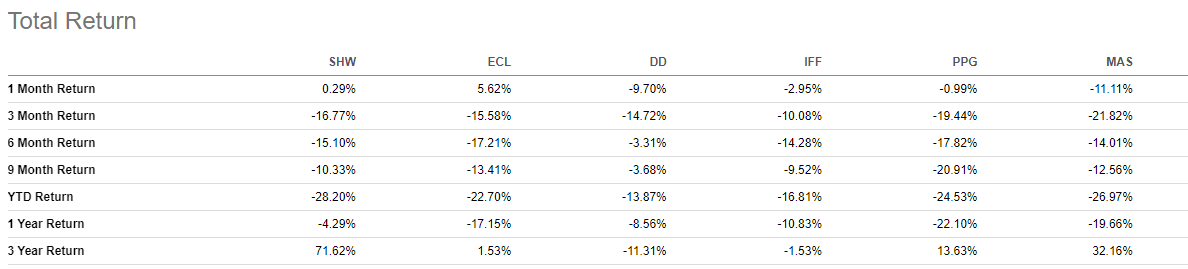
On valuation, except for MAS, most competitors within the industry appear to be trading at a premium. SHW’s forward pricing multiple, for example, is nearly 30x. This is higher than three of their peers and higher than their five-year average of 25x. In addition, their multiple of EV to EBITDA is also higher than all peers and slightly higher than their own five-year average of 22x.
Seeking Alpha Peer Comparison Tool – Valuation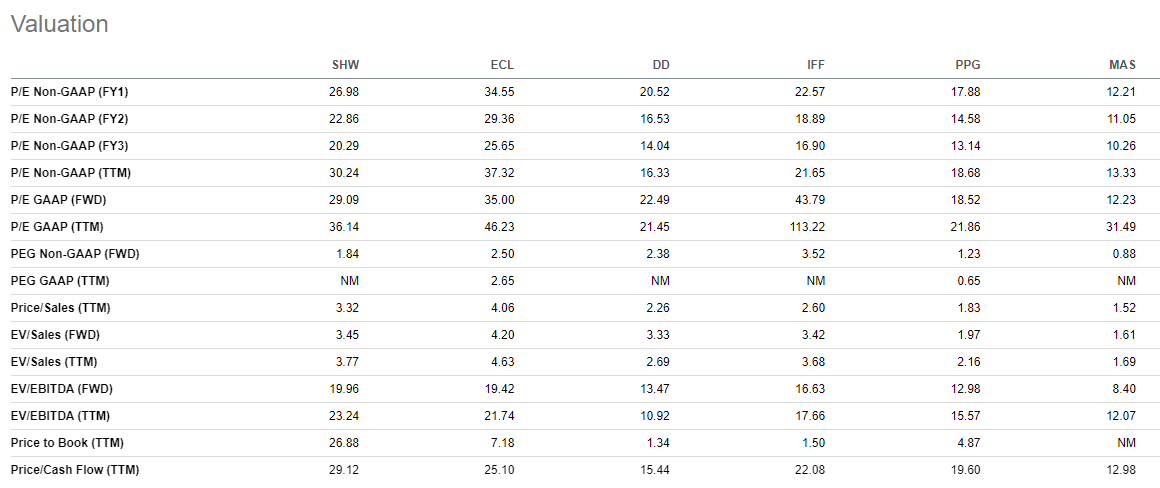
SHW is currently lagging the broader markets over a one-year timespan, but the company’s performance has improved over the past month. On valuation, the company appears overvalued at first glance based solely on their pricing multiples. Share price performance and multiples, however, are not definitive indicators of a company’s value prospects. For more compelling insight, share price performance and current multiples must be considered together with a deeper analysis of the company’s fundamentals.
The Fundamentals
Author’s Assessment of Strength of Fundamentals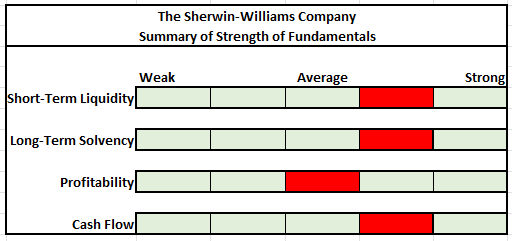
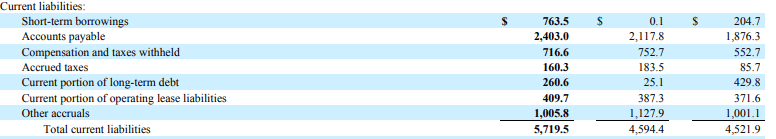
At the end of December 31, 2021, SHW reported total current assets of +$5.1B and total current liabilities of +$5.7B. Of the total current assets, inventories and A/R represented 85% of the total. In assessing liquidity strength, it is critically important to examine the ability of the company to sell inventory and collect on A/R. Failure to sell and collect in a timely manner that is consistent with prior years would result in significant holding costs and may result in a negative liquidity event for the company.
Partial Balance Sheet – Form 10-K Partial Balance Sheet – Form 10-K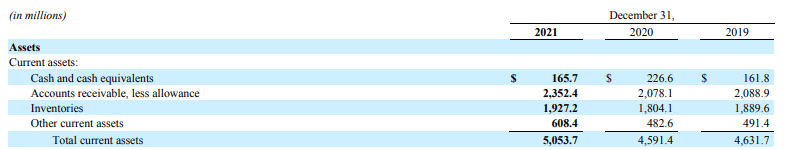
Based on the results of the seven liquidity ratios below, it doesn’t appear the company is having any issues in managing their working capital. In fact, the company appears to be turning over their inventory at the fastest rate in the past five years. This is an indication of strong demand in conjunction with strong overall economic conditions.
One may note that both the current and quick ratio are below 1x. In theory, the ratios represent the ability of the company to meet its short-term obligations with their current assets. For benchmarking purposes, a level at 1x or above is desirable. Results below 1x would indicate that the company has an insufficient amount of current assets to satisfy their current liabilities. In 2021, SHW’s current ratio did fall below 1x, but the result is misleading due to the company’s sizeable balance of inventory.
For GAAP purposes, inventories are required to be reported on the balance sheet at the lower of cost or net realizable value. In practice, however, companies often receive a markup upon the sale of inventory. But this markup is not reflected on the balance sheet. At 12/31, the company’s COGS/Sales ratio was 0.57. This indicates that the selling price of inventory was 1.75x the amount reported on the balance sheet. In truing up current assets to reflect this observation, one would obtain an adjusted current ratio of 1.14x, which is significantly better than the unadjusted 0.88x figure.
The quick ratio is similar to the current ratio, but it includes only the most liquid assets, such as cash and A/R. Since the balance sheet is inventory heavy, a quick ratio below 1x is expected. This is not a concern, so long as the company is continually able to turn over their inventory in a timely manner.
Author’s Calculations of Various Short-Term Liquidity Ratios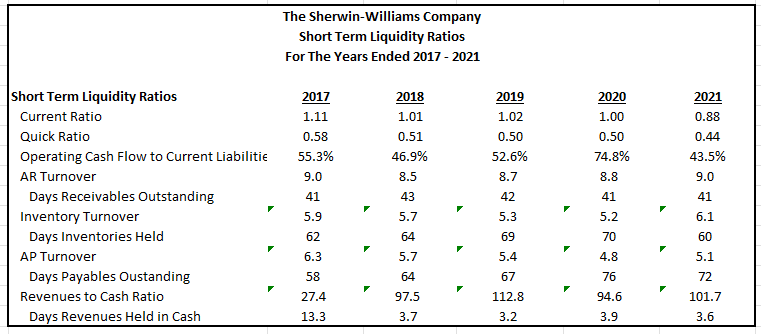
In recent years, the company has been holding off payment to their suppliers. In 2017, for example, suppliers were being paid in 58 days. That timeframe has increased steadily to 72 days in the current year. Holding payment frees up working capital for SHW to use on other short-term needs. In 2017, there were 45 days in which the company had to tap into cash or other funding sources to finance their working capital needs. That has since dropped to 29 days, partly due to slower payments to their suppliers and faster inventory turnover.
Author’s Calculations of Other Days of Required Financing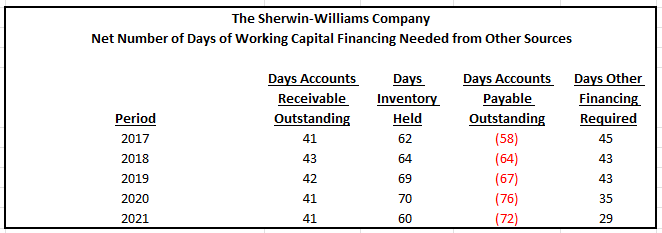
The short-term liquidity position of SHW is adequate, given effective working capital management and the lack of any apparent signs of weakness.
The company also appears to be in a stable position for the long-term. At year end, they had net debt of +$11.3B, which was 3.5x TTM EBITDA. This is a moderate level of leverage. Additionally, their interest coverage ratio is above 7x, indicating a strong ability to meet their minimum interest obligations. Furthermore, the Z-Score indicates a virtually 0% probability of bankruptcy.
Author’s Calculations of Various Long-Term Solvency Ratios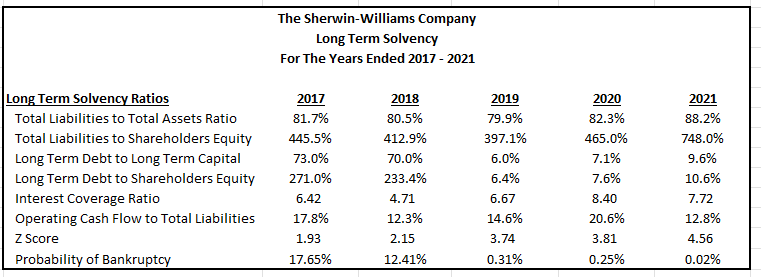
Further support of the company’s long-term viability is evidenced by the lack of significant near-term debt maturities. Of the +$17.2B in total contractual obligations, over 60% is due after five years. Amounts due prior to then appear manageable, given the company’s earnings potential and their consistent generation of positive cash flows.
Summary of Debt Maturities – Form 10-K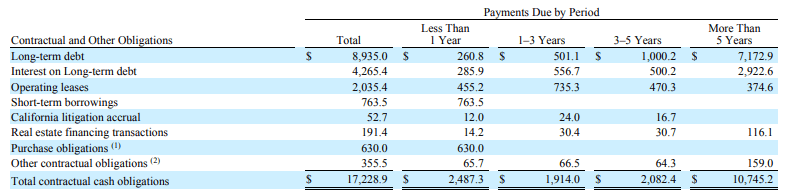
SHW is consistently growing revenues at a rate that is indicative of a mature company. In 2021, revenues were up nearly 9%, and management expects to be in the upper-single digits to lower double digits in 2022. While the outlook for SHW is positive, double-digit revenue growth is unlikely.
In the current year, margins also were negatively impacted by inflationary pressures and supply-related disruptions. Though normalization is expected in late 2022 into 2023, it is best to remain cautious regarding profitability strength.
Author’s Summary of Historical Profitability Metrics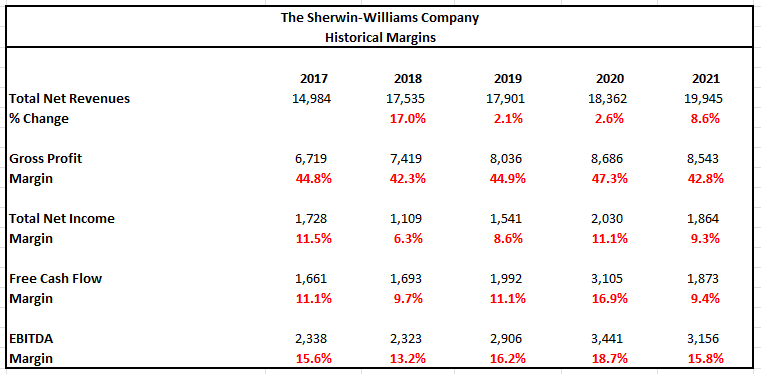
Compared to other peers within the industry, however, SHW is outperforming. Their gross profit margin of 43% is better than all competitors. Additionally, their return on total capital is also greater than most similar-sized peers. Margins are not well out of range of the competition, but they preferably should be higher.
Seeking Alpha Peer Comparison Tool – Profitability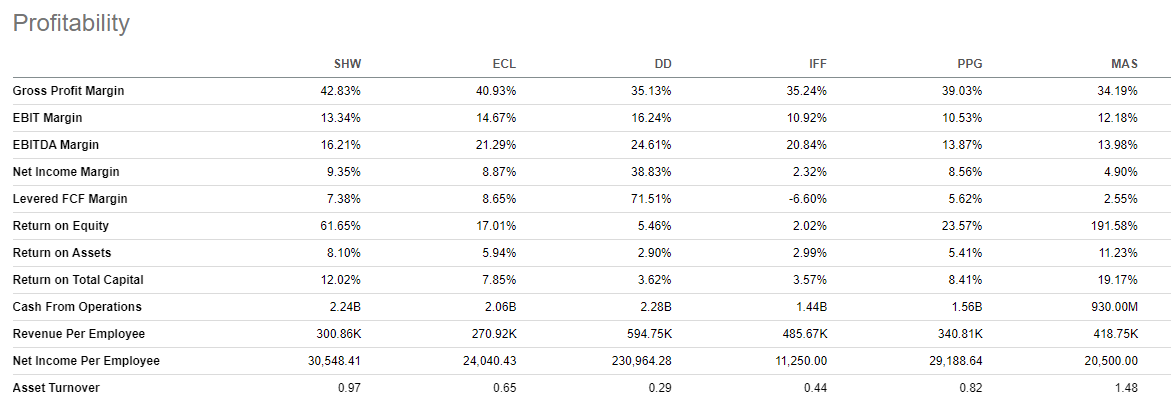
If margins were at 2020 levels, net income would have been nearly 10% higher from a comparative standpoint. Additionally, operating cash flows would have also been significantly higher. In 2021, the company reported +$2.2B in cash from operations, which was 34% lower than in 2020, driven primarily by the decline in net income, in addition to increased purchases of inventory. In addition, SHW reported higher A/R, which is a negative working capital adjustment for cash flow purposes. At more normalized levels, operating cash flow would have been over +$500M greater than prior years.
Partial Cash Flow Statement – Form 10-K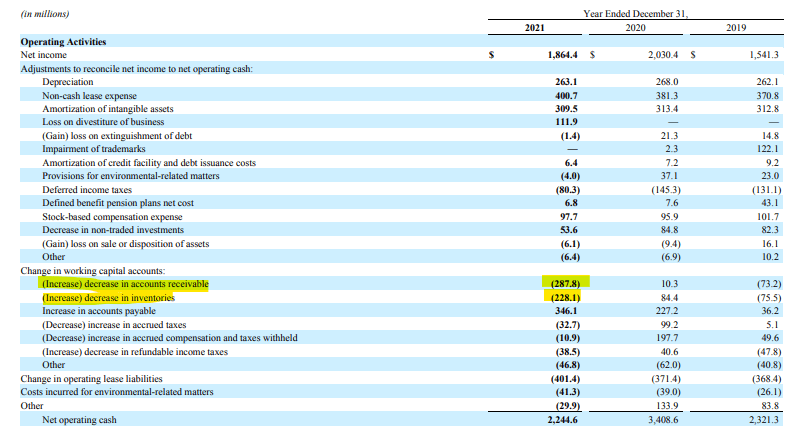
Despite lower cash from operations, the company’s FCF is still sizeable. At present, the company pays an annual dividend of $2.40, which is covered by both operating and FCFs by more than 3x. In addition, the payout represents less than 50% of net income, indicating a high degree of coverage. When including share repurchases, however, coverage did fall in the current year. But that was primarily due to the build in inventory. Moving forward, total payouts should be fully covered by the company’s cash flows.
Author’s Summary of Cash Flow Statement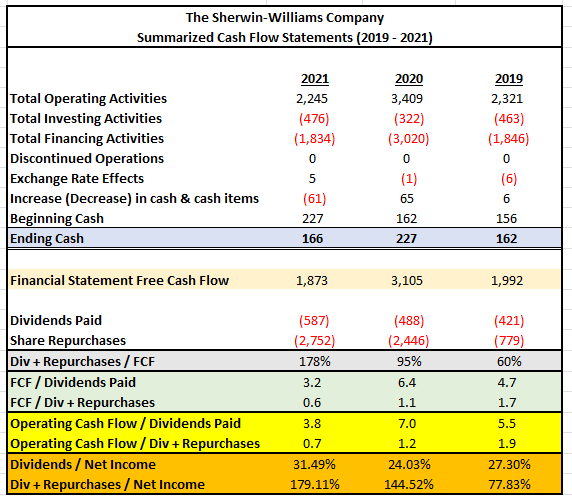
Overall, the fundamentals of SHW are above average. The company is effective in managing their working capital, and there are no concerns regarding their long-term viability. While the debt load is on the high side, interest coverage is strong, and there are no significant near-term maturities. The strength of the balance sheet is a counterweight to the margin compression experienced in the current year. Despite lower margins, the company still generated adequate cash flows to invest in CAPEX and fully cover their dividend, which has been growing at double-digit rates for the past few years. For these reasons, it is appropriate to assess the overall fundamentals as positive.
Price Target
Various methodologies were utilized to obtain an indication of the intrinsic share price of SHW. The results are provided in the chart below. The quickest methods involved simply applying the historical multiples to current pricing. Doing so yielded target prices with a low of $163 to a high of $249.
When applying models involving future cash flows, results came in at a low of $244 and a high of $297. With these models, the rate on the 10-YR U.S. Treasury is a critical variable in the computations. Since rates are projected to increase, the model incorporated the current rate, which was 2.88% at the time of analysis, as reported in The Wall Street Journal. For hypothetical purposes, the analysis also utilized a significantly higher rate of 3.5%.
When considering the results of all methods, the average target price is approximately $237.
Author’s Calculations of Target Share Price Using Various Valuation Methodologies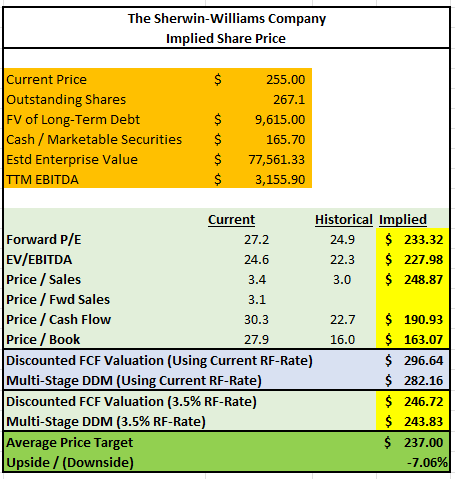
While the estimated price target in this model does indicate the company is overvalued by about 7%, analysts on Wall Street believe a target price of around $300 is more appropriate. This is also in-line with the results of the discounted FCF model at current rates. When adjusting the model to reflect higher interest rates, however, there was a considerable decline in the price target. Additionally, by all accounts, shares are trading higher than what their historical multiples would indicate. To justify a higher target, one would need to assume consistent double-digit growth rates, which is unlikely. Therefore, a lower price target is justified.
Primary Risks
Portions of SHW’s business are cyclical in nature, such as the sale of paint, coatings, and related products. Sales of these products are also affected by levels of discretionary consumer and business spending. During economic downturns, spending may decrease, and the recovery may lag the overall economy. In addition, adverse or uncertain conditions in the housing market or the broader economy in general could adversely impact the confidence or financial condition of the consumer, causing them to decide against purchasing home improvement products and services or impacting their ability to pay for products and services.
A prolonged downturn in the housing market or the broader economy in general could negatively impact the ability of SHW to generate cash from operations, which may adversely affect the company’s ability to service the +$9.6B of debt they had outstanding as of December 31, 2021. Cash that is tied up servicing the debt would reduce the amount available to fund working capital and CAPEX and the amount available to return to shareholders via buybacks and dividends.
Prices of certain raw materials used in SHW’s products, such as titanium dioxide and petrochemical feedstock sources, among others, are volatile and subject to fluctuations based on various external factors, such as supply and demand, inflationary pressures, competition, and market speculation. Significant increases in the cost of these inputs could have a negative impact on the company if they are unable to pass through the increases to their customers.
In addition to rising input costs, supply chain disruptions could adversely affect SHW’S ability to receive and deliver their inventory in a timely manner. This can result in increased transportation costs if the company chooses to utilize expedited shipping or dissatisfied customers if they are not provided their goods in a timely manner or if the products they need are continually out of stock. This may result in the loss of future business with both existing and prospective customers.
Net sales to Asia, Europe, South America, and other foreign markets are a significant aspect of the company’s business. Exposure to international markets subjects the company to the risk of potential economic/political instability in the host country. Additionally, the company may be negatively impacted by geopolitical conflicts that may arise between the U.S or their allies and any of the countries that the company operates in. Tariffs and counter-tariffs, increased regulation, boycotts, and long-winded lawsuits are potential complexities that could raise the cost of doing business for the company.
Conclusion
SHW is a global leader in the paint and coatings market. For numerous years, the company has rewarded shareholders with impressive share price appreciation and steadily increasing dividend payments. Furthermore, for the past few years, shareholder payouts have been increasing at a double-digit growth rate. For investors that bought shares at the end of 2017, they would have a current yield-on-cost of 1.75%, in addition to unrealized gains, excluding dividends, of approximately 85%.
Since 2020, shares have experienced a rapid rise to record levels. Though a pullback is underway, shares still appear to be trading at a premium to historical averages and to related peers within the industry. To support its current valuation, SHW would need to grow at double-digit growth rates for the foreseeable future, which is unlikely.
Despite the premium, analyst targets are still bullish with most targeting upside of at least 10%. Based on several pricing multiples, however, and the results of a discounted FCF analysis using both the current and the expected risk-free rate, an elevated risk of downside is present. Given the long-history and fundamental strength of the company, it is best to retain existing shares but at an underweight allocation.
Be the first to comment