

Gold (XAU/USD) and Silver (XAG/USD) Price, Chart, and Analysis
- Gold will find resistance tough to break.
- Silver sitting just above an important area of support.
Keep up to date with all market-moving data releases and events by using the DailyFX Calendar
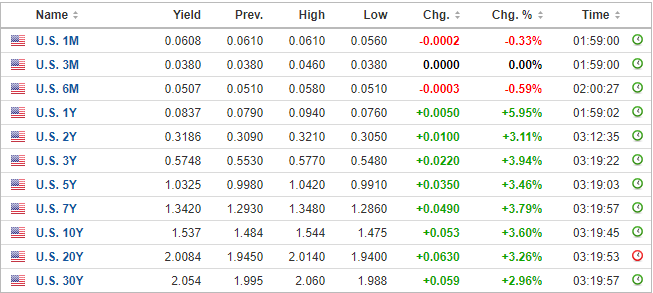
The ongoing rally in US bond yields continues to weigh on both gold and silver, leaving both at risk of further losses. Last week’s hawkish twist by the Fed has pushed UST yields higher across the board with the 10-year benchmark currently quoted at 1.54%, its highest level since mid-June, while the interest rate sensitive UST 2-year is offered at 0.315%, its highest level in 18-months. Monday’s sale of $60 billion 2-year and $61 billion 5-year notes met tepid demand and all eyes now turn to today’s sale of $62 billion 7-years. In February this year, the 7-year auction produced very weak results sending bond yields sharply higher with dealers left holding a much larger than the usual amount of bonds. Another weak auction today could see yields across the curve move even higher.
US Treasury Bond Yields September 28, 2021
Yields via Investing.com
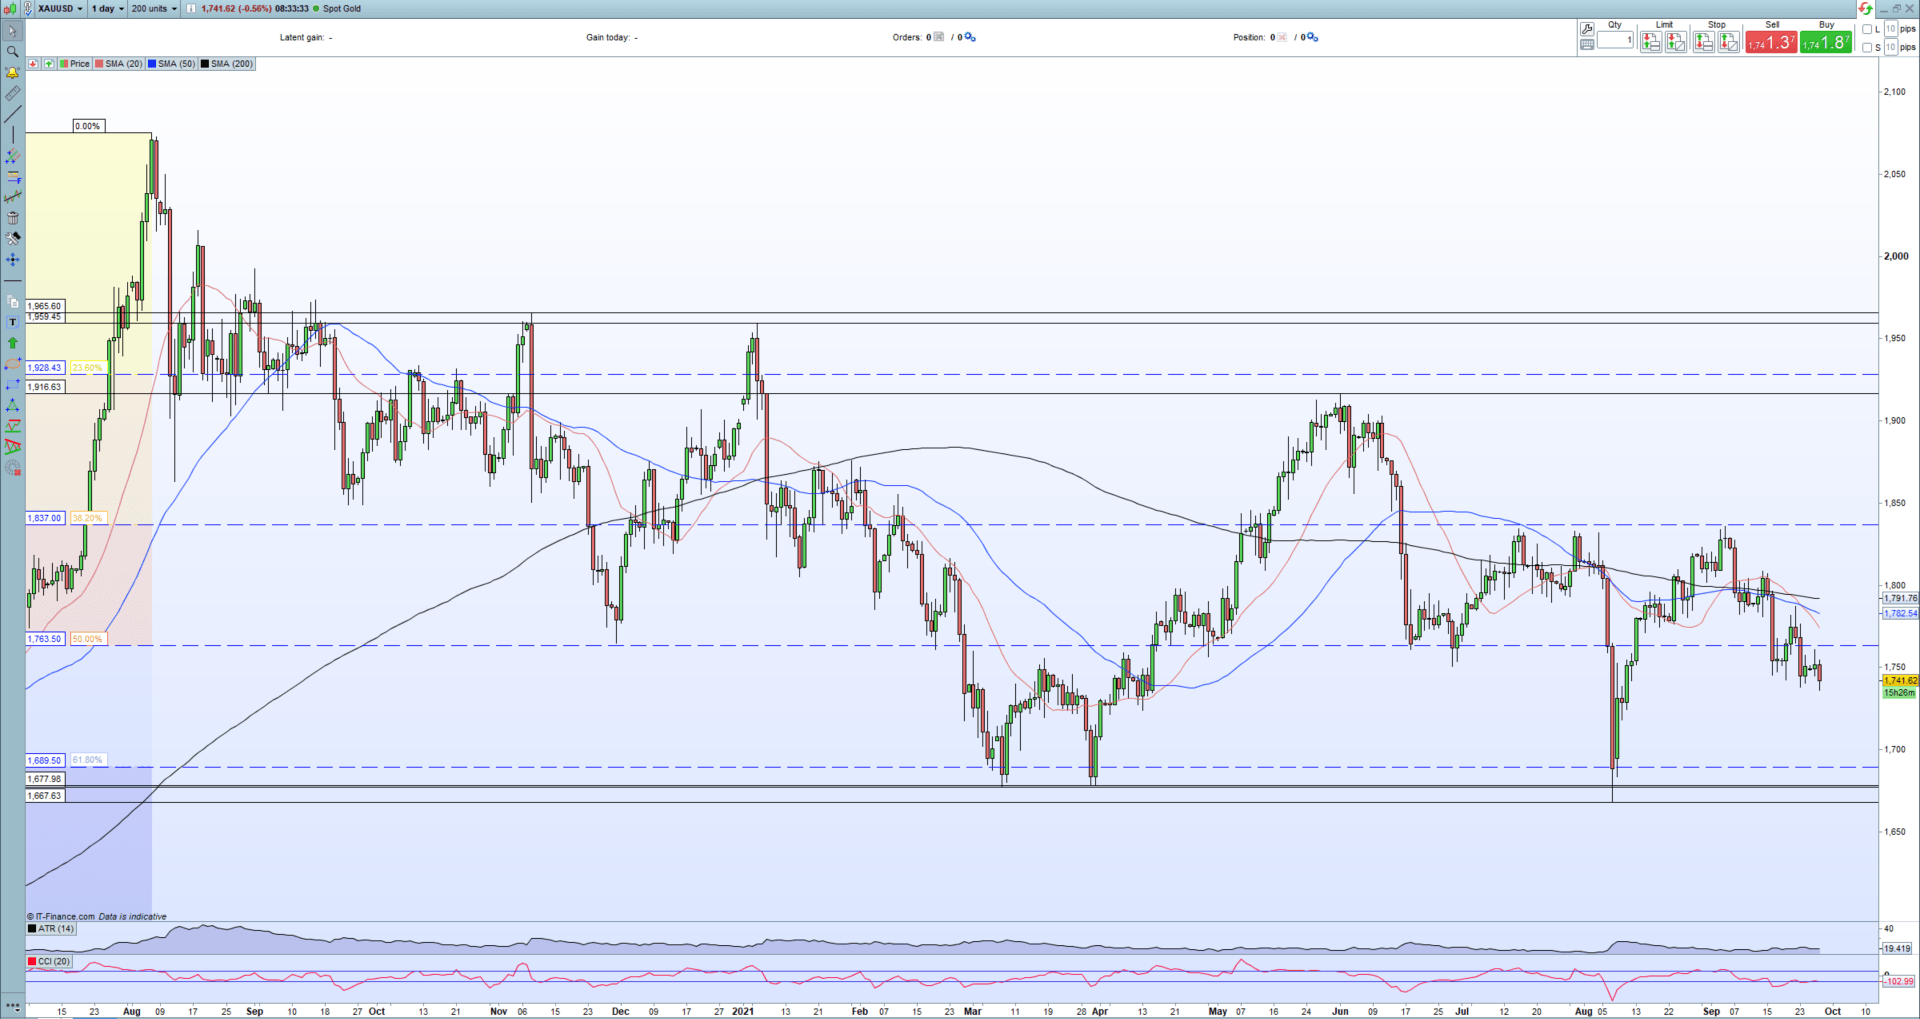
Gold remains under pressure from both higher yields and a stronger US dollar and any pullback will remain fleeting as the precious metal looks for the next level of support. The 50% Fibonacci retracement level at $1,763/oz. should cap any move higher, while the next level of technical support is seen off the 61.8% Fib retracement level at $1,689.5/oz. All three simple moving averages remain negative.
Gold (XAU/USD) Daily Price Chart September 28, 2021
Retail trader data show 74.52% of traders are net-long with the ratio of traders long to short at 2.92 to 1.The number of traders net-long is 2.64% higher than yesterday and 2.29% lower from last week, while the number of traders net-short is 9.48% higher than yesterday and 37.37% higher from last week.
We typically take a contrarian view to crowd sentiment, and the fact traders are net-long suggests Gold prices may continue to fall.Yet traders are less net-long than yesterday and compared with last week. Recent changes in sentiment warn that the current Gold price trend may soon reverse higher despite the fact traders remain net-long.
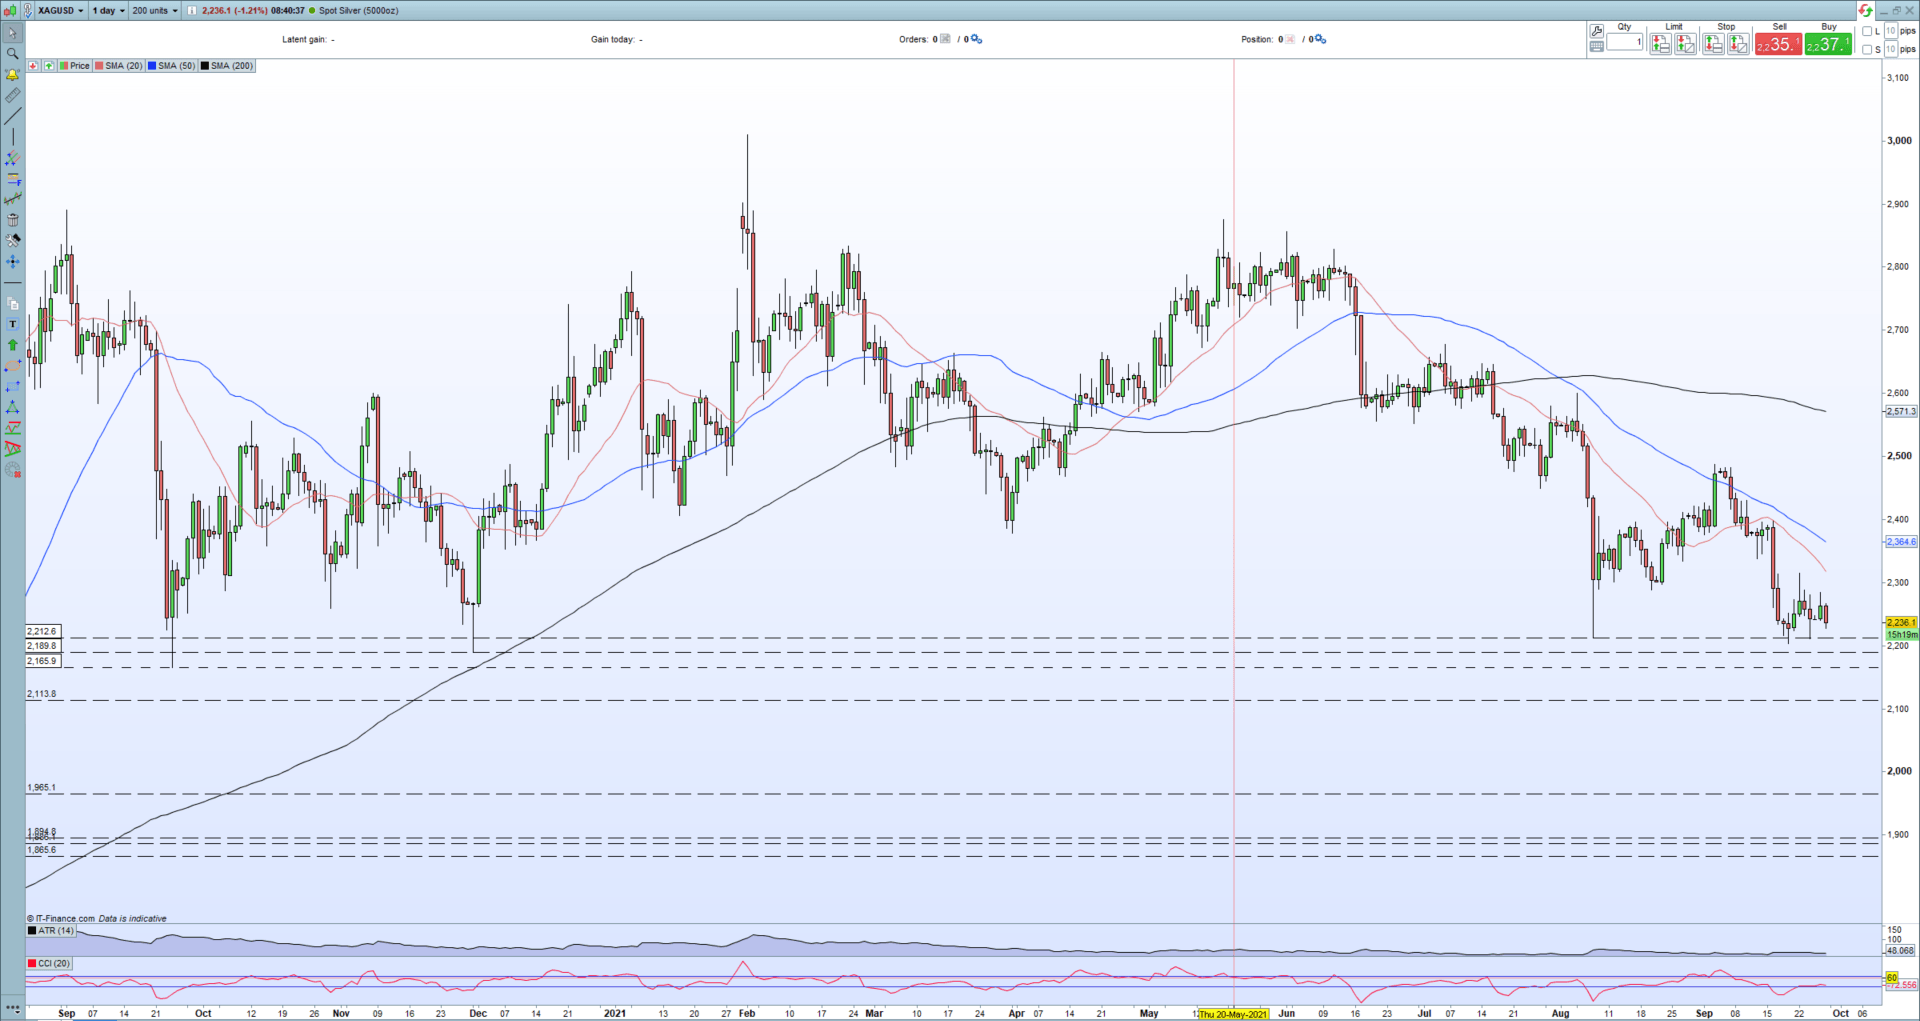
Silver’s multi-month sell-off is ongoing with the semi-precious metal now looking to re-test a zone of prior support produced by three old swing lows between $21.65 and $22.12. If silver breaks this zone of support then it will be back at levels last seen in June 2020. As with gold, the formation of all three simple moving averages is bearish.
Silver Daily Price Chart September 28, 2021
What is your view on Gold and Silver – bullish or bearish?? You can let us know via the form at the end of this piece or you can contact the author via Twitter @nickcawley1.
Be the first to comment