

andresr
Investment summary
Following our last report on Select Medical Holdings Corporation (NYSE:SEM) the stock has remained flat and failed to push towards our suggested price range of $31. In fact, it’s actually dipped into the red by ~9.25 percentage points since our last publication, whilst its Q3 numbers came in softer than expectations. As a reminder, our buy thesis on SEM is predicated on its current growth rates and the normalization of inpatient and outpatient turnover trends. We encourage investors to read our last 2 notes on SEM (in order):
- Select Medical: Return Objective of 26% justifies fit in equity portfolios
- Select Medical: Adding to Position for further upside capture
Despite the selloff in its share price since it reported Q3 earnings, we remain constructive on the stock looking ahead, and we’re back here to unpack the company’s latest set of numbers to demonstrate why. Net-net, retain buy with unchanged target to $31-$32.
Q3 earnings clearly demonstrate end-market challenges
Talking of the Q3 numbers, we should note SEM booked $1.57Bn in revenue, pulling this down to quarterly operating income of $91.5mm and net earnings of $0.21. Doubtlessly, this was well behind internal and the market’s expectations.
The main challenge identified by SEM during the quarter was centered around labor costs, a common theme in the broad healthcare market at present. As a reminder, the company recognizes labor expenditures for orientation, education, incentive bonus, sign-on bonus, and administrative support. Specifically, in the critical illness recovery (“CIR”) segment, we see that orientation hours for registered nurses (“RNs”) increased 53% from the year prior, whereas overall bonus lifted 40%, and administrative costs were up 18%. Comparatively, for the entire business, SEM saw a 22% YoY decline in agency rates across the period, narrowing in from $111/hr to $86/hr. You may recall agency rates surging to c.$150/hr back in January. These improvements were backed by a 33% decrease in agency utilization last quarter. Subsequently, agency costs were reduced 51% to $29.7mm from $56.4mm last year.
Whilst this is a positive trend, the downside of the reduced agency utilization – and the main compressor of earnings – is the additional costs associated to orientation and sign-on bonuses in bringing RNs, etc., across from agency. The good news is that these expenditures are likely to taper off into FY23′ as indirect labor costs begin to revert towards the mean, in our estimation.
Talking of the Q3 numbers, we should note SEM booked $1.57Bn in revenue, pulling this down to quarterly operating income of $91.5mm and net earnings of $0.21.
Switching to the operational highlights, our takeaways include the following:
- Revenue contribution from Concentra was down, despite Covid-19 demand dwindling sharply, with services revenue down to $3mm from $21mm previously.
- Despite this, we observed patient volumes’ lifted 200bps YoY, pushing revenue per visit 300bps ahead to $128. It scored this on adjusted EBITDA at 20.2% of turnover, relatively flat on last year’s 22.6%.
- Speaking of SEM’s outpatient rehabilitation hospital division, we saw it clipped a 400bps growth in net revenue driven by a similar percentage gain inpatient volumes.
- Comparatively, we note the inpatient rehab hospital division, saw an 800bps gain in turnover with patient volumes up 6%, with occupancy of 85%. You can see SEM’s quarterly operating results from FY16-date in Exhibit 1.
Exhibit 1.
Data: HBI, SEM SEC Filings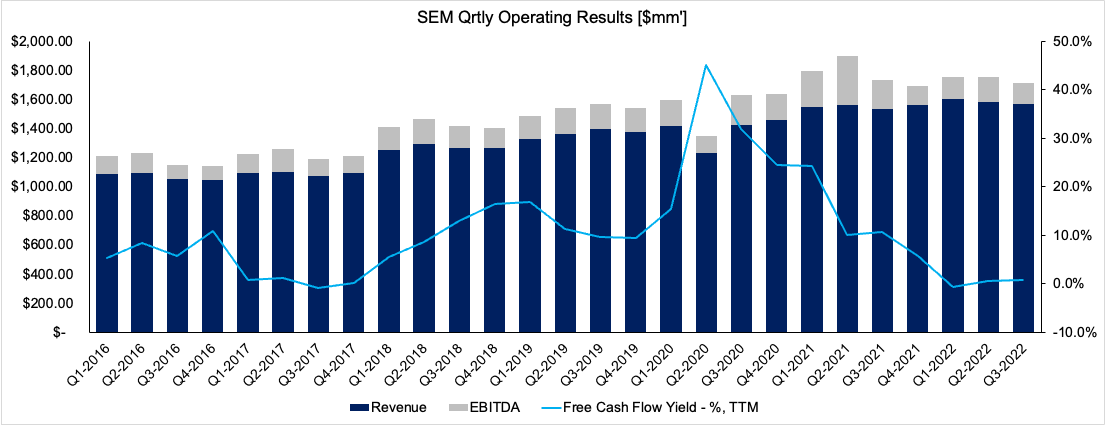
We decided to dive in deeper to see where SEM is at today with respect to our global equity strategy.
Most notably, we saw that ROIC and FCF trends pulled back to range (Exhibit 2). TTM ROIC currently sits beneath the WACC hurdle at 5.8% vs 6.22% respectively. This needs to improve for SEM, and we look for it to bring this number back towards its longer-term average of 6.8%.
Exhibit 2.
Data: HBI, SEM SEC Filings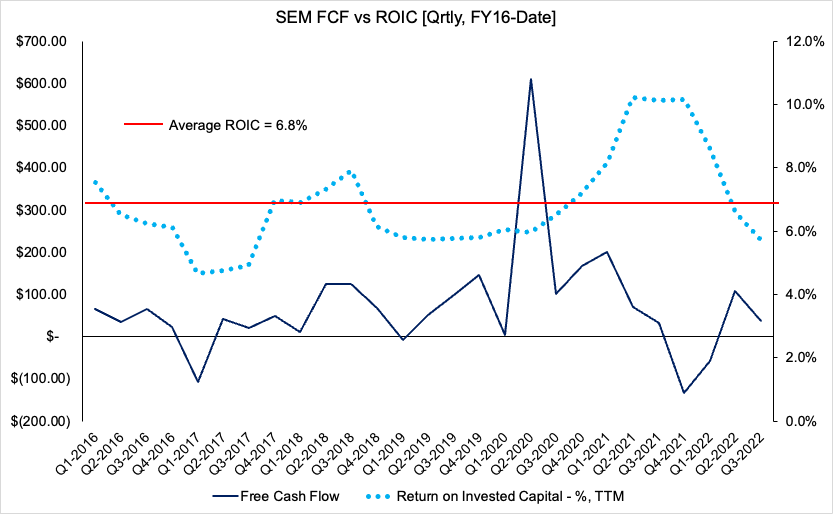
We then checked to see what’s behind this, as we do from time to time when we see such trends.
You can see in the chart below that SEM lost some NOPAT margin upside from its FY21 highs. This makes sense seeing the macroeconomic and healthcare market landscape, combined with the reduced Covid-19 turnover. Meanwhile, invested capital turnover has ratcheted up above 0.3x.
Although, it’s worth noting these numbers look to have pulled back to range as well, in keeping with the findings above.
Exhibit 3. As in the above chart, the drivers of ROIC have pulled back to range.
Data: HBI, SEM SEC Filings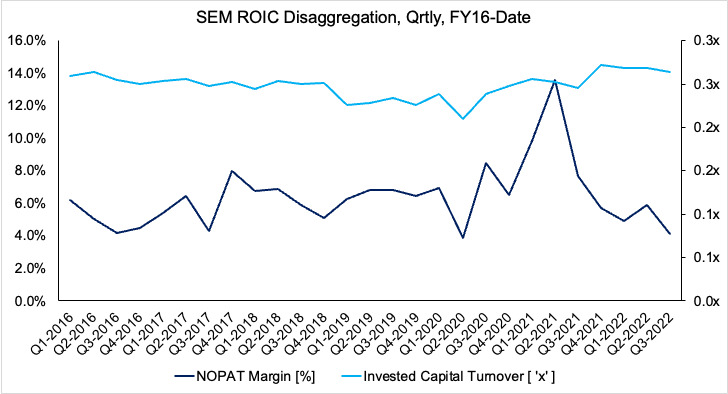
Technical picture for SEM
SEM has traded in a sideways consolidation for some time now, backing and filling since Jan FY22. Both the 50DMA and 250DMA have curled down and now serve as resistance.
We’re now seeing the stock form another base for the past 10 weeks of trade. At the same time, we see that weekly volume has been gaining in momentum.
Exhibit 4. SEM 2-year price evolution.
Data: Updata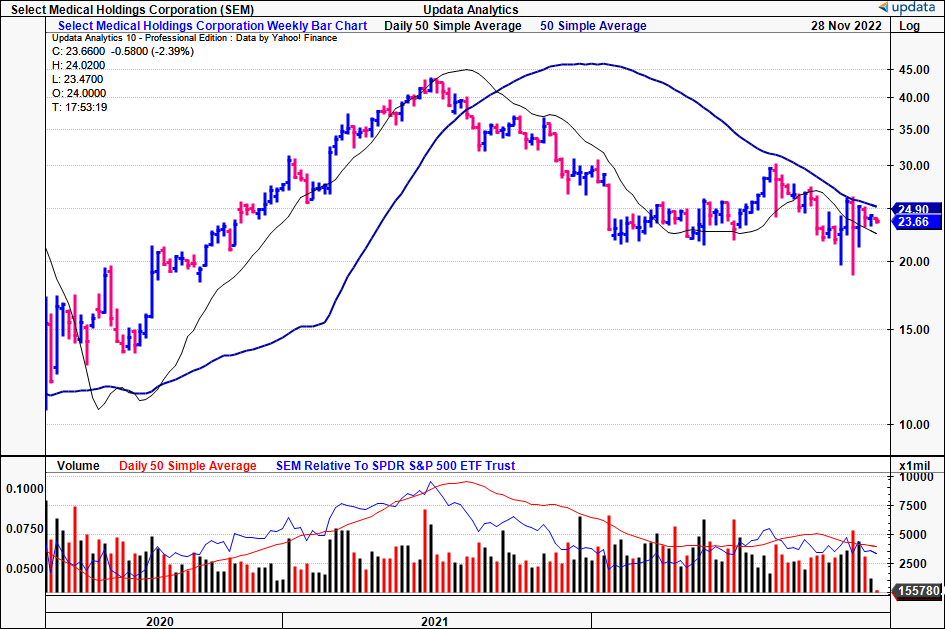
Shares are now testing cloud support, with the lag line trading below the cloud. On balance volume meanwhile has curled lower along with the SEM share price.
We need to see SEM punching up above the cloud to turn outright bullish by estimate, and on balance volume switching to the upside will be an early indication of this in our opinion.
Exhibit 5. Testing cloud support with OBV moving flat.
Data: Updata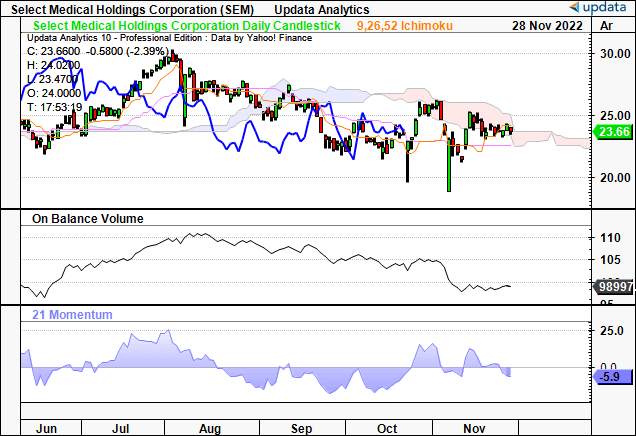
We still see upside targets to $32 and this helps to retain our buy thesis. Hence, with confluence around this target, we’d also note this falls in line with our last SEM valuation, which we retain here today.
Exhibit 6.
Data: Updata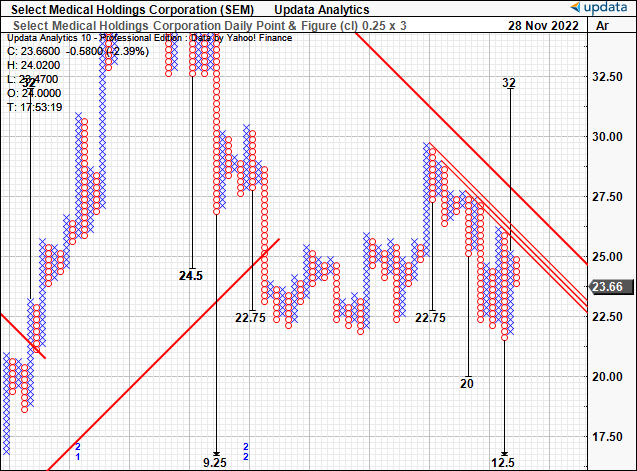
In short
Net-net, we continue to see value in SEM and believe it has the potential to unlock long-term value down the line. We retain our buy rating and retain our $30-$32 suggested price range.
Be the first to comment