


RomoloTavani
Don’t discount dividends (unless you are doing DCF valuation). Dividends have historically accounted for a significant chunk of the U.S. stock market’s total return through the decades. According to data from WisdomTree ETFs, dividends and reinvested dividends have contributed 69% of the U.S. stock market’s return, helping a $10,000 investment grow to over $1.5 million since 1978.
Dividends Account For A Huge Part of S&P 500 Total Return
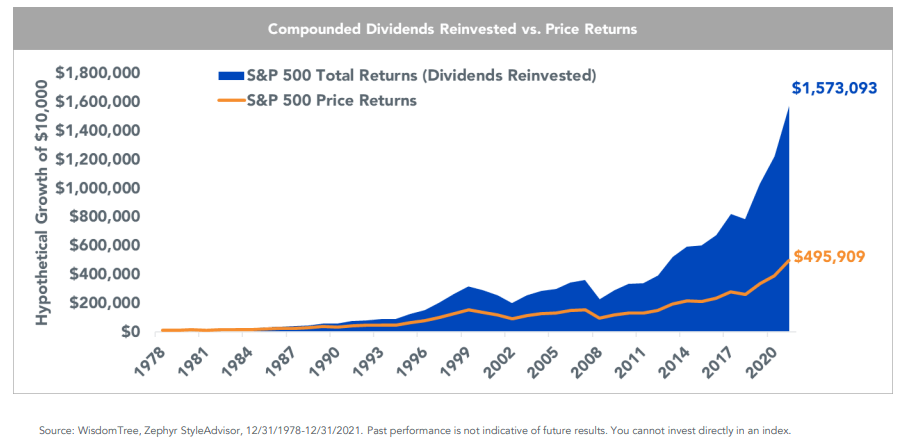
WisdomTree ETFs
Digging into the sector details, investors in search of the strongest yield might look at the Energy sector’s 3.5% payout rate. The Real Estate sector also sports a yield above 3% along with Utilities.
S&P 500 Sector Information: Energy, Real Estate, Utilities All With High Yields
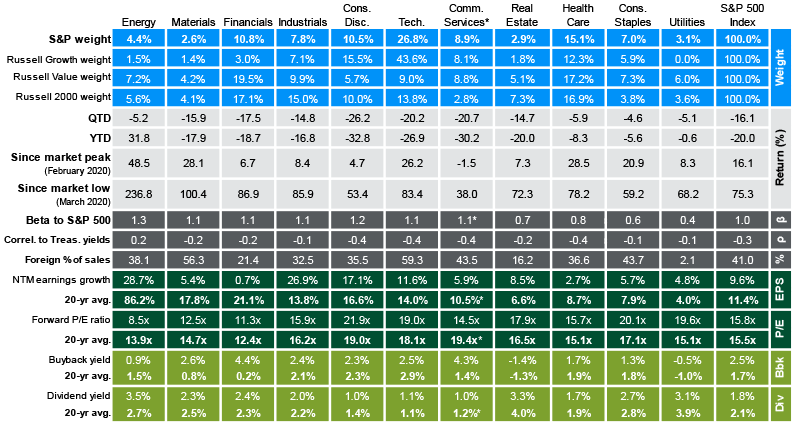
J.P. Morgan Asset Management
Data from Wall Street Horizon show that so far in 2022, 35% of global companies monitored have raised payouts while 10% of firms have cut their dividend. Those are better figures than what was seen in 2021 when just 29% of companies boosted their dividend and 12% slashed. Unfortunately, the quarterly trend paints a less sanguine picture: After a strong 1Q22, the current quarter and Q2 featured worse year-on-year dividend change trends.
Dividend Net-Increasers Decline Year-on-Year in Q2 and Q3
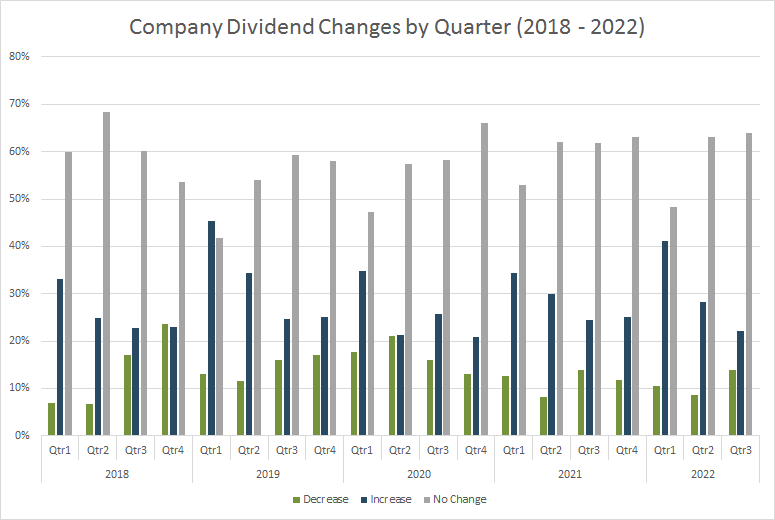
Wall Street Horizon
Homing in on the S&P 500, Standard & Poor’s dividend data looks great, according to Yardeni Research. Total dividends (in billions of dollars annualized) notched a fresh record high in the second quarter. While there’s certainly much earnings anxiety in the market right now, large-cap U.S. companies are sending positive signals with their dividend policy.
Record High Dividends in 2Q22
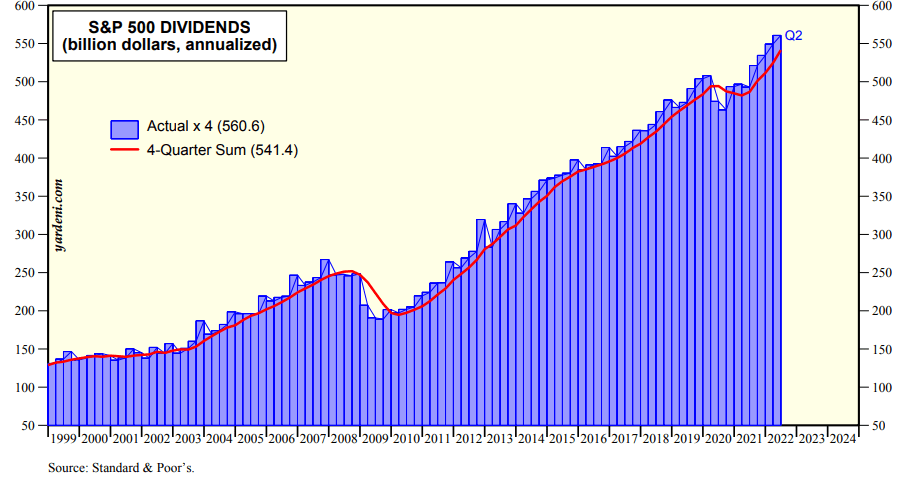
Yardeni Research
Longer term, the S&P 500’s dividend yield rests near historic lows, though a lower S&P 500 price index this year and stronger dividend trends have boosted the trailing twelve-month payout percentage versus the rate on Dec. 31, 2021. Multpl.com shows that the current 1.62% SPX yield is far below the historical median of 4.23% that spans more than 150 years (using Dr. Robert Shiller’s stock market data).
S&P 500 Dividend Yield Through History
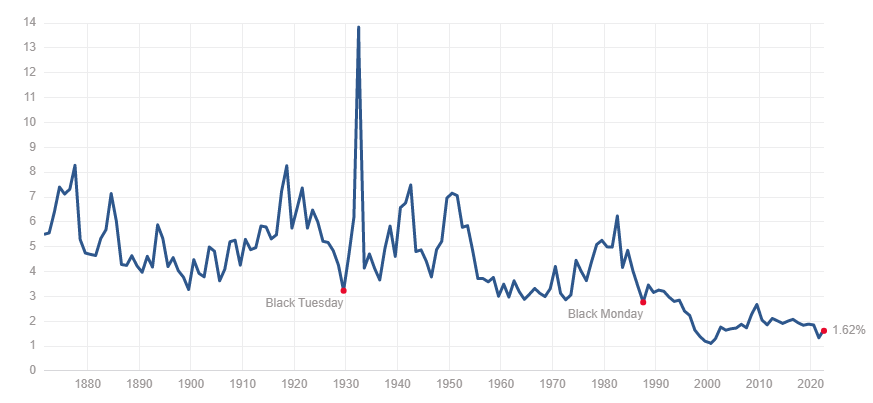
Multpl.com
Buybacks matter too, though, as that’s the other tag-team member of “total shareholder yield.” It’s important to realize that it was actually illegal for companies to repurchase shares until 1982. That’s when the U.S. Securities and Exchange Commission (SEC) adopted rule 10B-18 aimed against corporate raiders, according to Harvard research. That provision began the popularization of buybacks since that form of shareholder accretive activity is more tax-friendly than dividends. So, it’s natural to expect relatively low dividend yields on U.S. equities today compared to before 1982.
The High Dividend Equity Factor Leads YTD
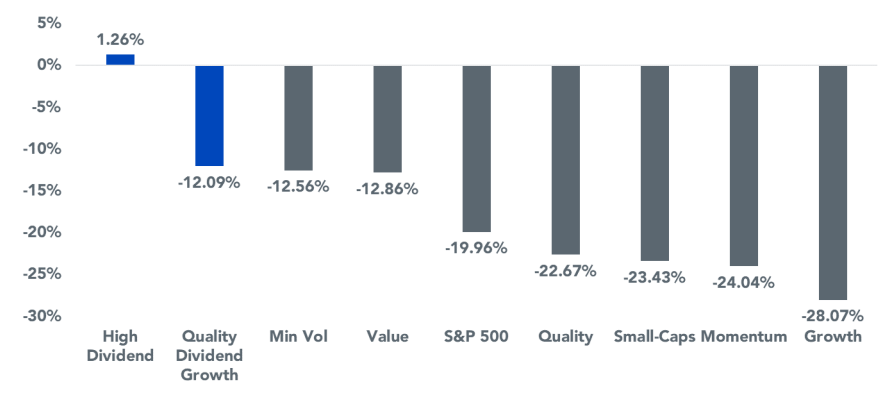
WisdomTree ETFs
So by now you probably understand that a bird in the hand is worth two in the bush – meaning dividends matter. What is a good way to play it? Take a look at firms that have a history of boosting their distributions.
The SPDR S&P Dividend ETF (NYSEARCA:SDY) tracks the S&P High Yield Dividend Aristocrats Index – an index that screens for companies that have consistently increased their dividend for at least 20 consecutive years, and weights the stocks by yield. These companies feature both capital appreciation characteristics and a high yield.
SDY has a net expense ratio of 0.35% and it holds 119 stocks, according to SSGA Funds. Its forward P/E ratio is under 16x, so it has a cheaper earnings multiple versus the broad stock market. SSGA reports that as of July 19, the index SDY tracks has a yield of 2.93%. Industrials and Consumer Staples are the biggest sector weights with Tech being just 3.3% of SDY.
SDY Sector Breakdown: Heavy Into Industrials, Light on Tech
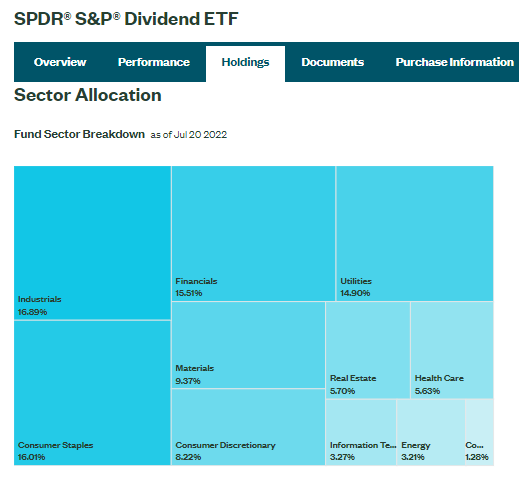
SSGA Funds
The Technical Take
While the yield is compelling and SDY’s valuation looks good, what does the chart say? I see cause for some concern. Notice how the $119-$122 range has been a battleground area for SDY. It held on to a few tests from late last year through this past May. Unfortunately for the bulls, downward price action took the ETF below $119 with vigor (notice the price gap and continuation during the middle of last month). On a few rebound attempts, sellers emerged at that same range.
SDY: Resistance Near $120
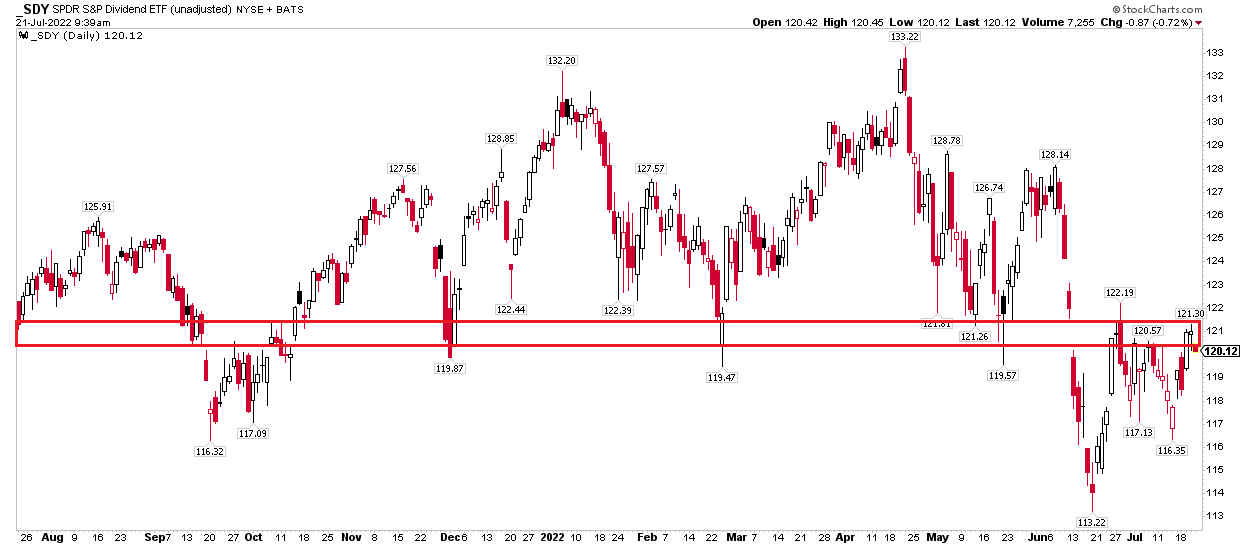
Stockcharts.com
The Bottom Line
Dividends are no doubt important for long-term investment growth. There are some worrisome signs seen in global dividend changes this quarter and last. Still, the equity factor has performed well in 2022. SDY is a way to play large-cap U.S. dividend growers, but its chart shows some bearish signs right now after a downside break in June. Look to get long shares above $122 but take profits on bounces until that share price move happens.
Be the first to comment