NicoElNino
By Maya Beyhan
In quantum mechanics, Schrödinger’s Cat refers to the paradoxical consequences of a thought experiment: can a cat be simultaneously dead and alive? A similarly counterintuitive phenomenon can be found in the context of climate-based analysis: whereby an index may boast a relatively low carbon intensity and yet, perhaps surprisingly, not be judged as aligned with the goals of the Paris Agreement. A case study illustrates the importance of considering both point-in-time and forward-looking analysis in understanding the results, as well as the value of sector-based perspectives.
Two S&P 500®-based indices, the S&P 500 ESG Index and S&P 500 Fossil Fuel Free Index, offer a particularly illuminating example. The point-in-time and forward-looking components of our analysis are provided, respectively, by the index-weighted carbon intensity and via the S&P Global Trucost Paris-Alignment dataset.1
As reported in S&P DJI’s new Climate and ESG Index Dashboard, the S&P 500 Fossil Fuel Free Index achieved a carbon intensity reduction of 10.6% relative to the S&P 500, while the S&P 500 ESG Index achieved a higher carbon intensity reduction of 21.0%.2, 3 But such figures are based only on the most recent emissions figures of constituents—a point-in-time perspective.
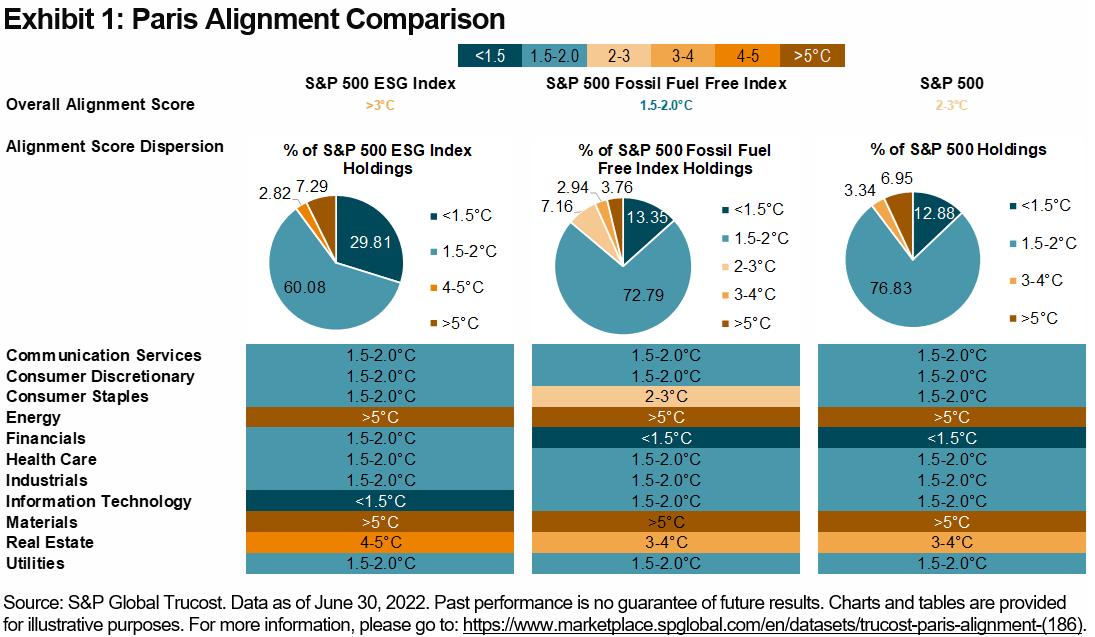
The results of the forward-looking analysis show a different picture: the S&P 500 ESG Index achieves a Paris-Alignment score of > 3°C, notably even higher than the benchmark S&P 500’s score of 2-3°C. On the other hand, the S&P 500 Fossil Fuel Free Index receives a score of 1.5-2°C. Exhibit 1 provides further detail, including a sector-level breakdown for each of the three indices.
Exhibit 1 (S&P Global Trucost )
Exhibit 1 also illustrates a sectoral perspective on the drivers of the index scores: the S&P 500 ESG Index holds a weight of 7% in sectors with a Paris-Alignment score of > 5°C, 4% higher than the S&P 500 Fossil Fuel Index’s weight, and a little higher than the S&P 500’s. Conversely, the S&P Fossil Fuel Free Index has a 73% weight in sectors with a 1.5-2.0°C alignment and only a 3% weight in > 5°C-sectors.
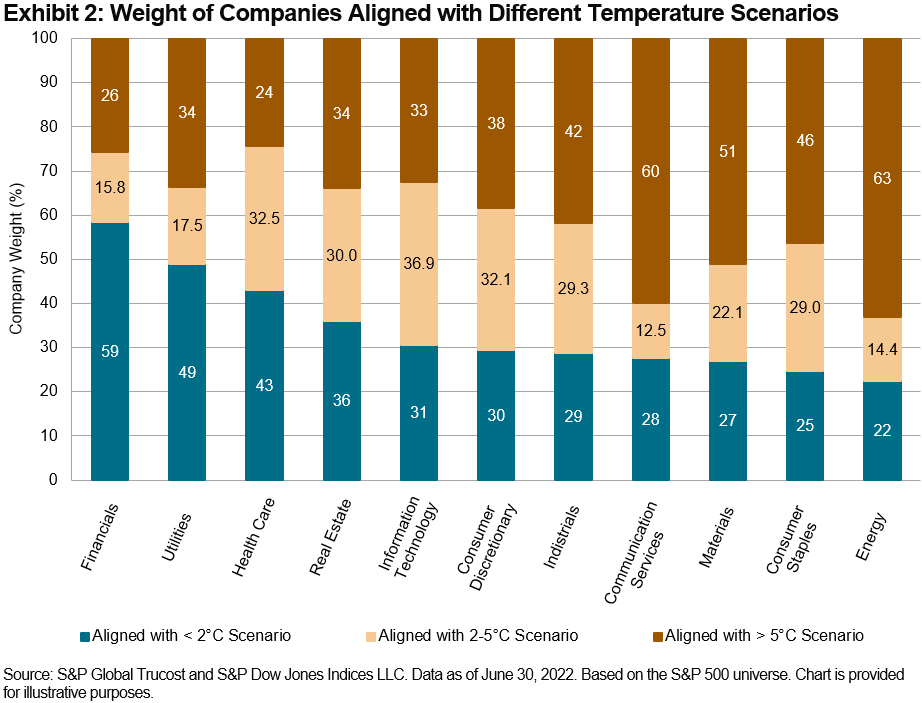
Alignment levels across sectors are highly dispersed, as Exhibit 2 emphasizes. By a significant margin, Energy companies have the weakest level of alignment, while Financials, Health Care and Real Estate, with typically lower direct emissions, show better results. The same applies to new economy sectors like Information Technology, where cost-effective abatement technologies have been easier to develop in comparison to “old economy” sectors, such as Materials.
Exhibit 2 (S&P Global Trucost and S&P Global Dow Jones Indices LLC)
The Utilities sector brings us back to the paradox set out in the beginning: the sector is well known as the highest direct emitter, and yet Exhibit 2 shows it has the second-highest proportion aligned with a < 2.0°C scenario of any sector. But a company with high current emissions may also be on a strong improvement trajectory, and large emitters can be very well aligned under transition pathway assessments. This is the case for the Utilities sector overall; a little like the infamous half-alive quantum feline, it is both dirty and clean.
Such examples illustrate the nuanced distinctions between carbon intensity and decarbonization trajectory. A detailed look at how the S&P DJI’s suite of indices performs in both dimensions is now offered free on a quarterly basis via our newly launched Climate & ESG Index Dashboard.
1 The dataset allows for the identification of the scale of company-level reductions required by 2030 and beyond to meet various climate-related objectives, such as a 1.5°C or 2°C maximum increase. More details may be found here.
2 All figures as of June 30, 2022. For more details, please refer to S&P DJI’s Climate & ESG Index Dashboard.
3 The S&P ESG Index Series does not have an explicit objective of reducing GHG or to align with any particular climate scenario.
Disclosure: Copyright © 2022 S&P Dow Jones Indices LLC, a division of S&P Global. All rights reserved. This material is reproduced with the prior written consent of S&P DJI. For more information on S&P DJI please visit www.spdji.com. For full terms of use and disclosures please visit Terms of Use.
Editor’s Note: The summary bullets for this article were chosen by Seeking Alpha editors.


Be the first to comment