

baona/E+ via Getty Images
Investment Thesis
If there’s one word to describe the Schwab U.S. Dividend Equity ETF (NYSEARCA:SCHD) this year, it’s mediocre. That’s not something most readers are used to, given how SCHD has been one of the best-performing dividend ETFs since it launched in October 2011. But it happens, it’s normal, and most importantly, it’s explainable. This year’s mediocre returns are a function of its sub-optimal allocations that nearly ignore Energy and Utilities, the two best sectors YTD. That’s why the iShares Core High Dividend ETF (HDV) has turned a profit in 2022 while SCHD is down 10%.
To be fair, the SPDR S&P 500 ETF (SPY) is down 21%, so it’s important to put things in perspective and realize that SCHD still has a:
- 0.06% expense ratio
- 3.12% trailing dividend yield
- 3.52% estimated forward yield (discussed later)
- 12.24% five-year annualized dividend growth rate
- 14.37 forward price-earnings ratio
- 13.16% forward earnings per share growth rate
These features are excellent reasons to hold while the market completes its correction, and describing SCHD’s current fundamentals and place in the high-dividend-yield category is the purpose of today’s article. I hope to convince readers that although there are better alternatives in the short term, SCHD is the best core dividend ETF available and deserves a place in your dividend growth portfolio.
ETF Overview
Strategy Commentary
Since I’ve covered SCHD in great detail several times already, as have numerous other Seeking Alpha contributors, I’ll keep this part brief. SCHD tracks the Dow Jones U.S Dividend 100 Index, selecting 100 U.S. stocks with at least ten consecutive years of dividend payments. REITs are excluded, and constituents are screened for free cash flow to total debt, return on equity, indicated dividend yield, and five-year dividend growth. In my view, this focus on cash and profitability gives it excellent stock selection capabilities.
In a previous article, I found that SCHD’s reconstitutions can sometimes be ill-timed, which can be true for any rules-based ETF. Therefore, it’s essential to review the portfolio annually in March to ensure your other investment objectives (beyond dividend yield and growth) aren’t compromised. A recent example is this March’s fairly uneventful reconstitution despite a different economic environment. With sky-high inflation and several negative market signals (decreasing revenue and earnings surprises, flattening yield curve), I was hoping for more Energy and Utilities exposure. Unfortunately, it didn’t happen, and SCHD underperformed as a result.
The takeaway is to not put SCHD or any ETF on a pedestal. It’s just an unmanaged basket of stocks and won’t always make sense. If you run into this problem again, see if you can do something to supplement any exposure gaps in the interim. SPDR sector ETFs are great for that purpose.
Sector Exposures and Top Ten Holdings
Many investors choose to compare SCHD with SPY. That’s okay from a total returns perspective, but SCHD offers much more in the form of dividend yield and growth that I’ll highlight soon. Nevertheless, here is how they compare from a sector allocation perspective. I’ve also included sector exposures for two popular high dividend ETFs: the Vanguard High Dividend Yield ETF (VYM) and the iShares Select Dividend ETF (DVY).
Morningstar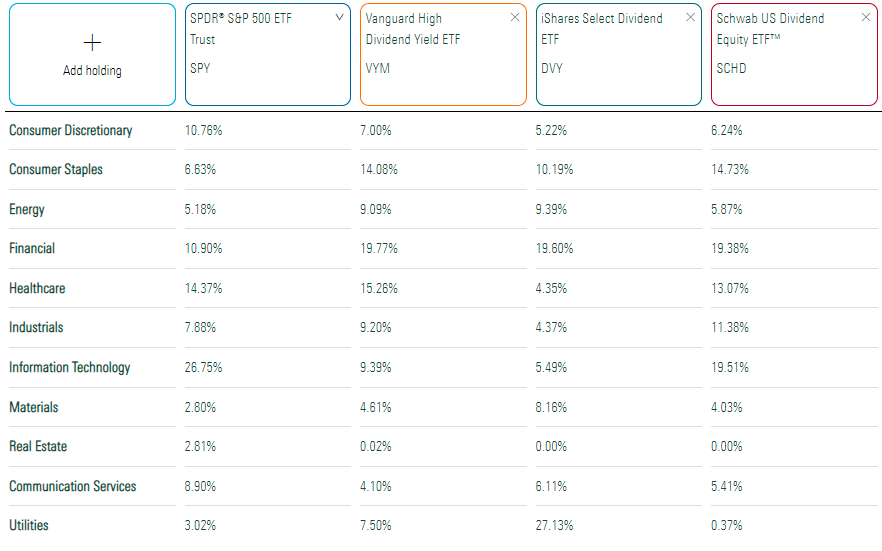
I think SCHD has the best diversification by sector out of these three comparators. No sector accounts for more than 20% of the portfolio, and the fact that REITs are excluded doesn’t make it much different than SPY. To cover that area, more specialized ETFs are necessary.
Technology is still SCHD’s largest sector, which has been a problem this year. Because it’s float-adjusted market-cap-weighted, stocks like International Business Machines (IBM), Texas Instruments (TXN), Broadcom (AVGO), Cisco Systems (CSCO), and Automatic Data Processing (ADP) all currently have weights exceeding 3%. The top ten holdings are below, totaling 41.12% of the ETF. Three Health Care companies, led by Merck & Co. (MRK), appear while Coca-Cola (KO) and PepsiCo (PEP) represent the Consumer Staples sector. Note how six stocks currently exceed the Index’s 4% maximum weighting, so look for this to be adjusted at the next quarterly rebalancing.
Schwab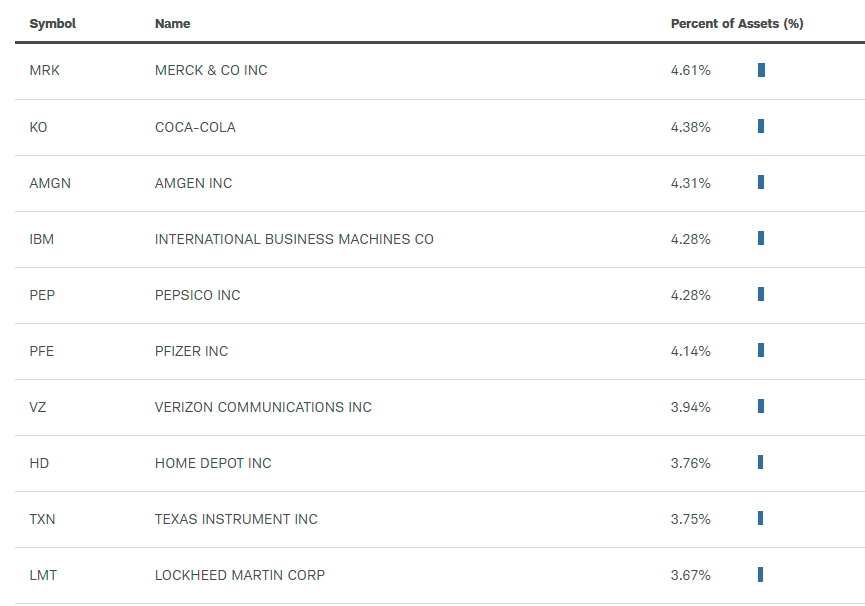
Performance History
Against the three comparators mentioned earlier, SCHD beat them on returns and risk-adjusted returns, gaining an annualized 13.50% through June 14, 2022. Its maximum drawdown of 21.54% during the Q1 2020 crash was about the same as SPY’s and about 8% better than DVY, an ETF I’ve followed closely in the last six months.
Portfolio Visualizer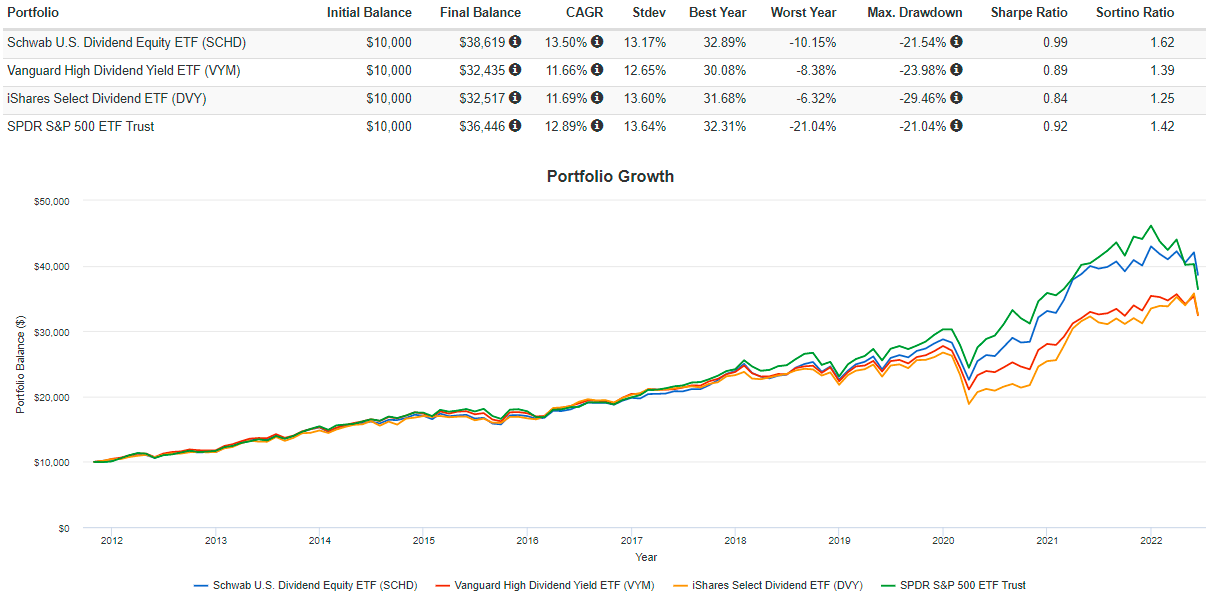
If you were to break up performance into three-year holding periods, SCHD looks even more impressive. Through May 31, 2022, SCHD has gained an annualized 20.33%, or 4-6% better than these peers. It’s only recently that SCHD has underperformed HDV and DVY, primarily because of the sector allocation issues described earlier.
Portfolio Visualizer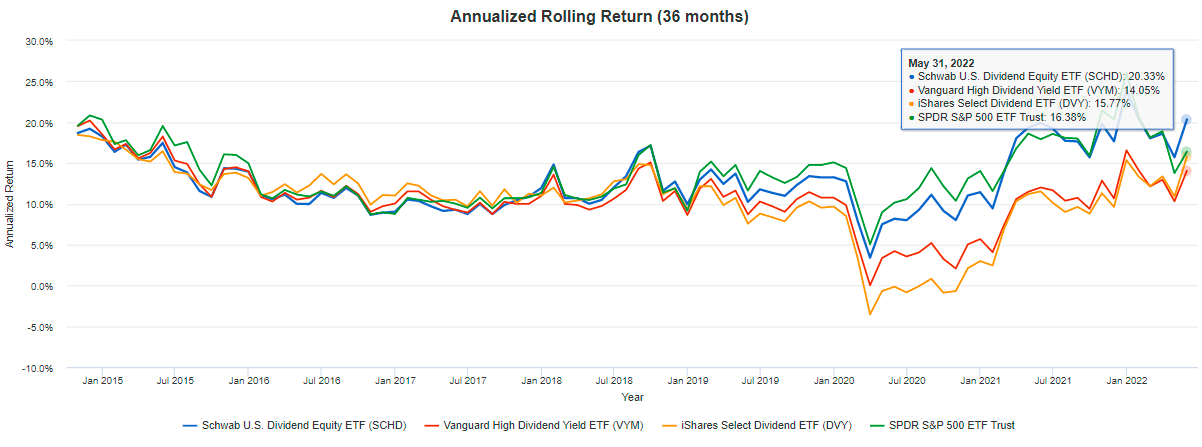
Maximizing total returns is an important objective, but SCHD provides investors with a psychological boost with its unique combination of high dividend yield and growth. For those choosing to reinvest dividends, 2021 distributions would total $1,138 on a $10,000 investment on January 1, 2012. Even those choosing to accept distributions in cash would have earned $859 in 2021 compared to $309 in 2012. That works out to a 10.77% dividend growth rate over ten years and is something that keeps many investors motivated and in the market during selloffs.
Portfolio Visualizer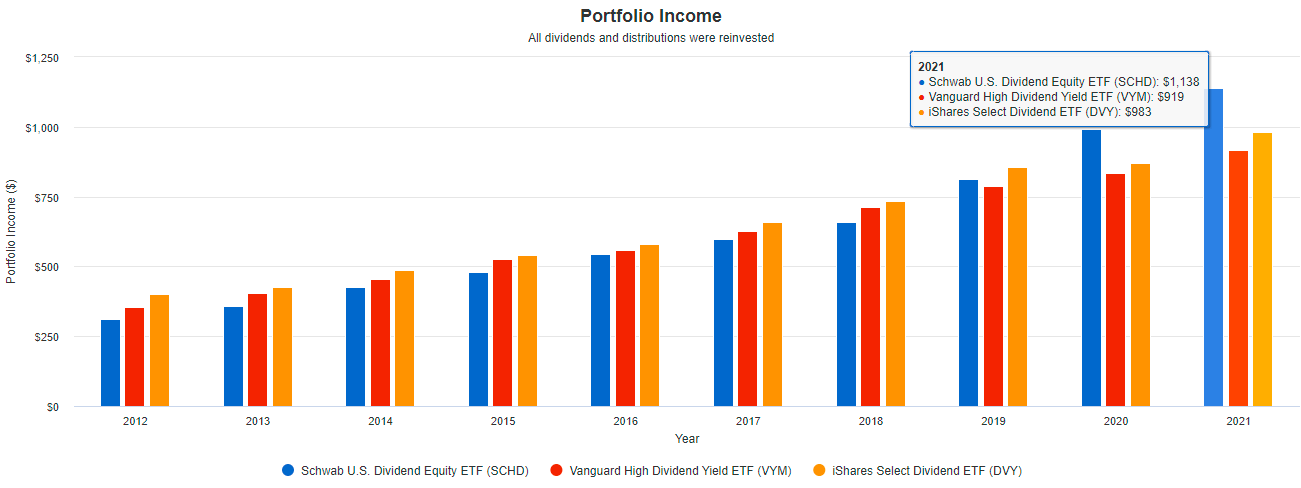
VYM and DVY’s ten-year dividend growth rate when not reinvesting dividends was only 6.87% and 6.08%, so they aren’t even in the same league as far as I’m concerned. If you want dividend yield and growth with some downside protection in bear markets, SCHD is one of the best choices.
Fundamental Analysis
On a fundamentals basis, SCHD began looking weak compared to other dividend ETFs around November of last year. At the time, S&P 500 revenue and earnings surprises were declining from ridiculously high levels, interest rates to combat inflation was about to happen, and richly valued, high-growth stocks were the logical targets. SCHD is certainly not a high P/E ETF relative to the market. However, compared to other dividend ETFs, it was. The March reconstitution did not address these problems adequately, so I chose to write mostly about others like HDV, FDL, DVY, DJD, and numerous value ETFs I thought were better plays for the environment.
I track the fundamentals of hundreds of ETFs pretty closely as part of an effort to find the best value, and part of the reason for today’s article is that I see SCHD as a much stronger play today compared to even a few months ago. This chart summarizes some of SCHD’s relative rankings with 25 other high dividend ETFs.
The Sunday Investor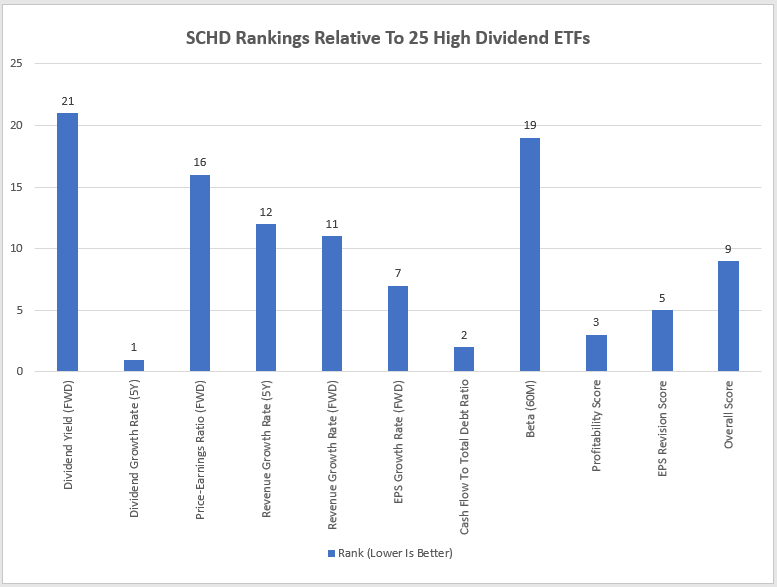
As shown, SCHD is solid in most key areas and excels in dividend growth, cash flow to total debt, and overall profitability. SCHD is mediocre in other regions like valuation (price-earnings ratio) and volatility (beta), but it doesn’t rank near the bottom on any of these metrics. One metric I’ll discuss shortly is SCHD’S Seeking Alpha EPS Revision Score. Only four other high dividend ETFs scored better (CSB, TPHD, TPHE, and DVY), but none come close to SCHD in terms of profitability.
I’ve highlighted many of these metrics for SCHD’s top 20 holdings below and compared them with VYM since it’s another cheap and popular high-dividend ETF I recommended late last year.
The Sunday Investor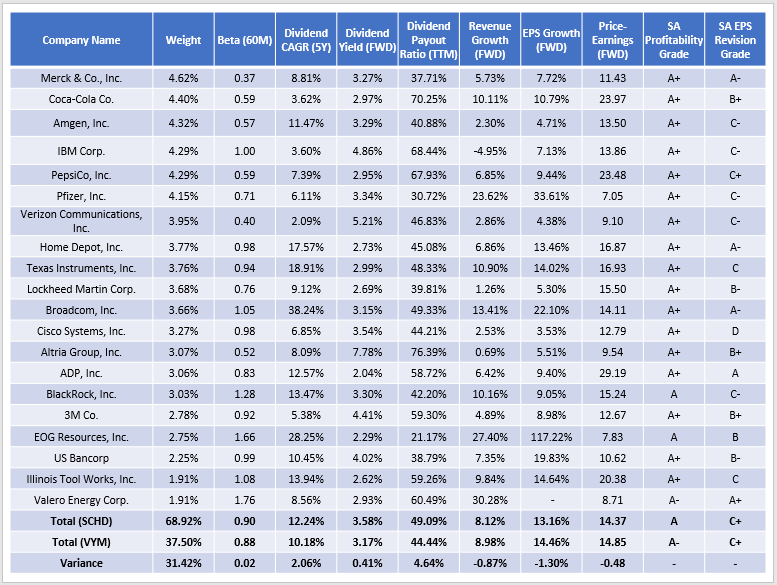
These ETFs rank pretty closely on my end, and this table helps explain why. SCHD and VYM have similar five-year betas (0.90 vs. 0.88), estimated revenue growth (8.12% vs. 8.98%), EPS growth (13.16% vs. 14.46%), and forward price-earnings ratio (14.37 vs. 14.85). However, SCHD has the edge in dividend yield, dividend growth, and overall profitability. Let’s look at a few of these features closer.
1. The weighted-average five-year dividend growth rate of 12.24% is the best among any high dividend ETF. It’s also consistent with the ETF’s 11.98% growth rate, which isn’t always a given. Fortunately, I can confidently say that SCHD’s dividend growth will likely continue until at least next March, when its Index reconstitutes next. Its 49.09% payout ratio is low enough, and since so much emphasis is placed on cash flow and profitability, I don’t see any cause for concern.
2. The forward yield of SCHD’s current constituents is 3.58%, and after subtracting the small 0.06% expense ratio, shareholders can expect to earn about a 3.52% yield based on today’s prices. That’s substantially better than the trailing yield of 3.12%, and it’s additional evidence that future dividend growth is likely.
3. Most of SCHD’s top holdings have an “A+” Seeking Alpha Profitability Grade. That’s incredible for a high dividend ETF, which some may assume are portfolios of deeply-discounted, low-quality companies. Interestingly, SCHD’s net “A” Grade is the same as SPY’s, so investors aren’t sacrificing quality. Instead, they are gaining some downside protection and growing their dividends responsibly, which should pay off in the long run.
Finally, I want to discuss the “C+” Seeking Alpha EPS Revision Grade, which doesn’t sound too great until you consider it’s the fifth-best among all high dividend ETFs. Market sentiment is simply negative, and there aren’t too many places to hide. A few industries are seeing upward analyst revisions, but most have above-average volatility that runs counter to most dividend investors’ objectives. Still, for those interested, here are the top five ETFs with the most exposure to four of these industries you may want to explore.
- Homebuilders: (ITB, PKB, XHB, HOMZ, PSCD)
- Semiconductors: (SOXQ, XSD, FTXL, SOXX, PSI)
- Commodity Chemicals: (FXZ, PYZ, IYM, JHMA, WBIY)
- Steel: (XME, PYZ, FXZ, PSCM, JHMA)
Investment Recommendation
SCHD is an excellent choice for dividend investors with medium and long-term time horizons because it consistently offers double-digit dividend growth and a relatively high yield. Due to its focus on cash generation and overall profitability, I don’t foresee quality ever being an issue. That, plus an ultra-low 0.06% expense ratio, are reasons SCHD is a terrific core holding.
It’s important to remember that no strategy works best under all market conditions. We’ve seen that this year, as SCHD has lagged many other high dividend ETFs despite soundly beating the S&P 500. I expect that will continue as long as inflation remains high, and I encourage you to consider adding more inflation-friendly stocks to your portfolio to fill this gap. Still, regarding metrics measuring dividend, revenue, earnings growth, valuation, and overall quality, SCHD scores well across the board, and I don’t think you can go wrong at these prices. Therefore, I’m rating SCHD as a buy, and I look forward to discussing this further in the comments section below.
Be the first to comment