


svetikd
(This article was co-produced with Hoya Capital Real Estate.)
In this article, I will take my first close look at Schwab U.S. Broad Market ETF (NYSEARCA:SCHB).
For years, The Charles Schwab Corporation (SCHW) has been a force in the investment community. In 1975, Charles Schwab seized an opportunity created by recent SEC changes to create a new kind of brokerage—a discount brokerage. In September, Schwab opened its first branch in Sacramento, California.
Some 9 years later, in 1984, Schwab introduced Mutual Fund MarketPlace, with 140 no-load funds. In 1996, following the advent of the internet, web trading went live. During the late-1980s through the early-2000s, the company both grew at a rapid pace and experienced a period of difficulty following the bursting of the dot-com bubble.
Following years as a stalwart in the low-cost mutual fund arena, Schwab entered the quickly-expanding ETF marketplace, launching 4 new ETFs in November, 2009. SCHB was one of these ETFs.
Today, almost 13 years later, SCHB remains a solid choice in terms of a core holding in one’s portfolio. In this article, however, we will look at whether there is anything in particular that distinguishes SCHB at this point in time, or whether it is now simply one of many options.
Schwab U.S. Broad Market ETF – Digging In
First of all, from a cost standpoint, SCHB is a very efficient core holding. With a rock-bottom expense ratio of .03%, SCHB is directly competitive with other major players such as Vanguard Total Stock Market Index Fund ETF (VTI) and iShares Core S&P Total US Stock Market ETF (ITOT).
Here is how SCHB’s summary prospectus describes the index tracked by this ETF.
To pursue its goal, the fund generally invests in stocks that are included in the Dow Jones U.S. Broad Stock Market Index.The index includes the largest 2,500 publicly traded U.S. companies for which pricing information is readily available. The index is a float-adjusted market capitalization weighted index that reflects the shares of securities actually available to investors in the marketplace.
Stocks must have at least 10% of their shares available to the public and pass a minimum liquidity requirement to be considered for addition. As can be seen, at a fundamental level the index targets the top 2,500 eligible securities according to their float-adjusted market capitalization ranking.
According to Morningstar, however, the fund uses an interesting technique to minimize portfolio turnover. It uses buffer rules to keep existing constituents in the portfolio until they fall below the 3000th ranking, reducing unnecessary turnover around the lower cap bound. As of this writing, however, at 2,503 holdings the fund is very close to its target.
Here’s the question, though. Does all of this make any noticeable difference compared to other total-U.S. market ETFs that dive even deeper into the pool, so to speak, as opposed to focusing on the top 2,500 holdings?
As it turns out, not really. Above, I referenced both VTI and ITOT as competitors for SCHB. Using their respective pages on Seeking Alpha, I captured the holdings breakdown for SCHB and ITOT, respectively.
First of all, for SCHB.
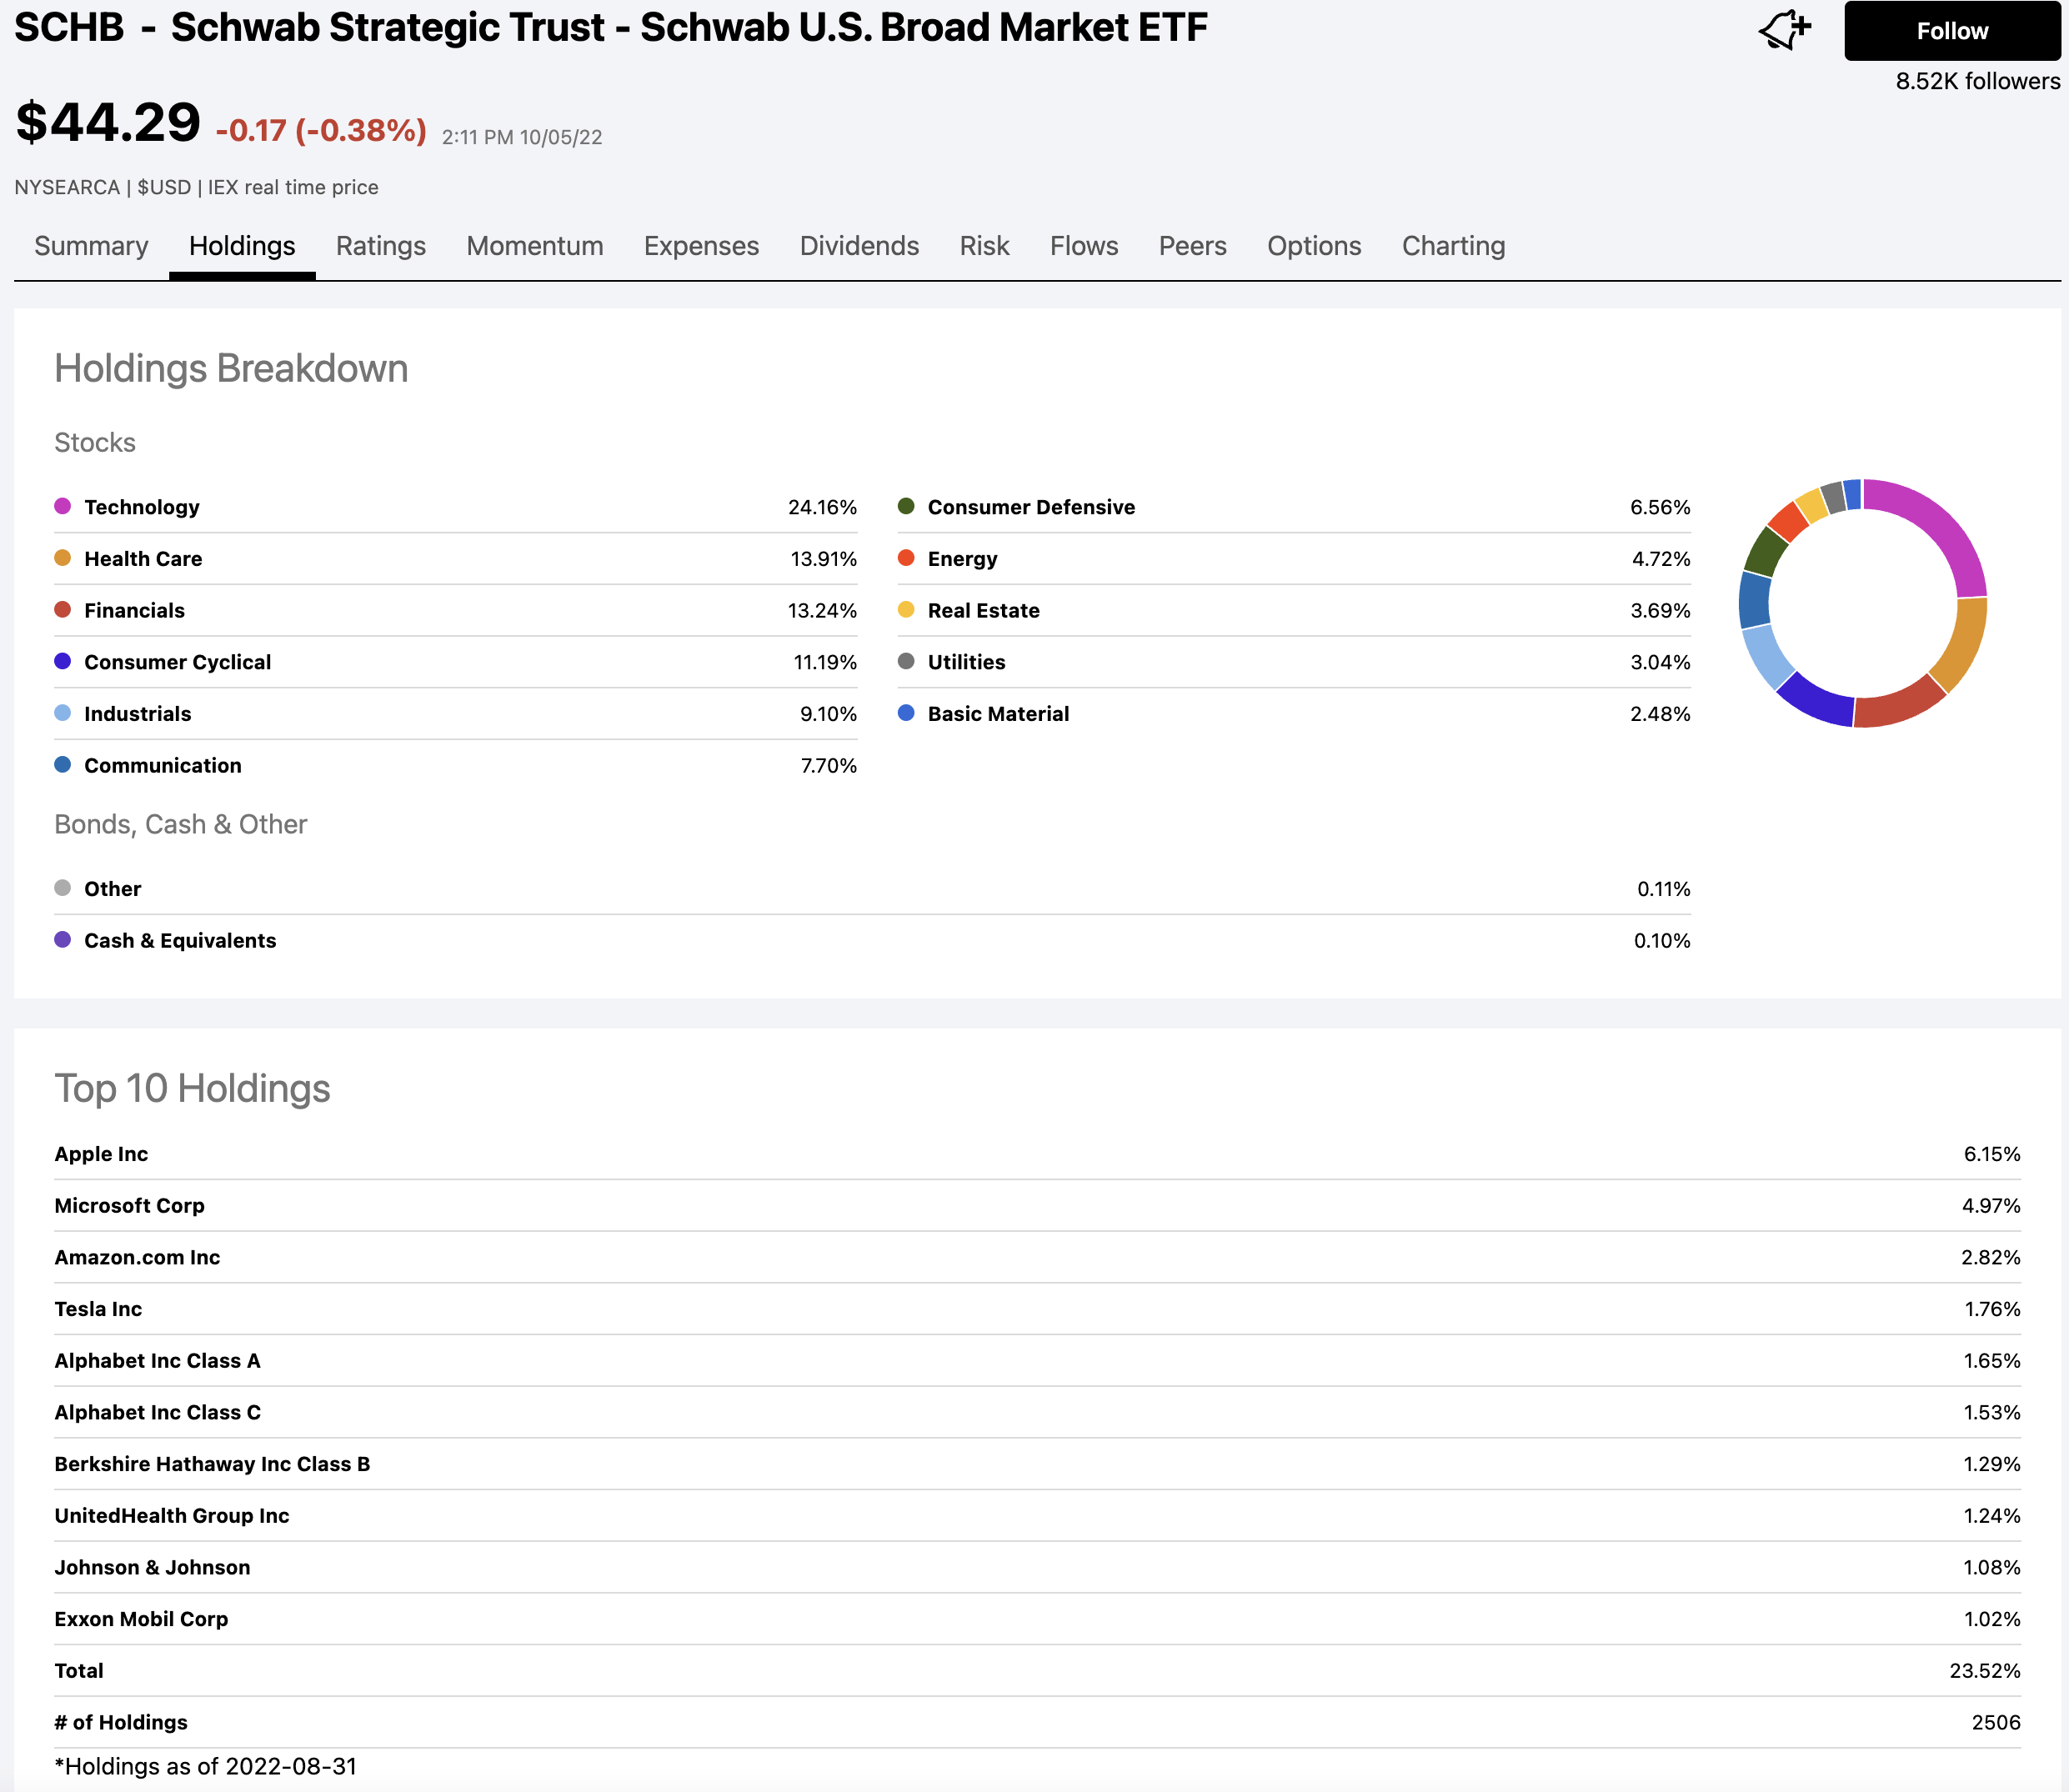
SCHB: Sector Breakdown & Top 10 Holdings (Seeking Alpha)
Next, for ITOT.
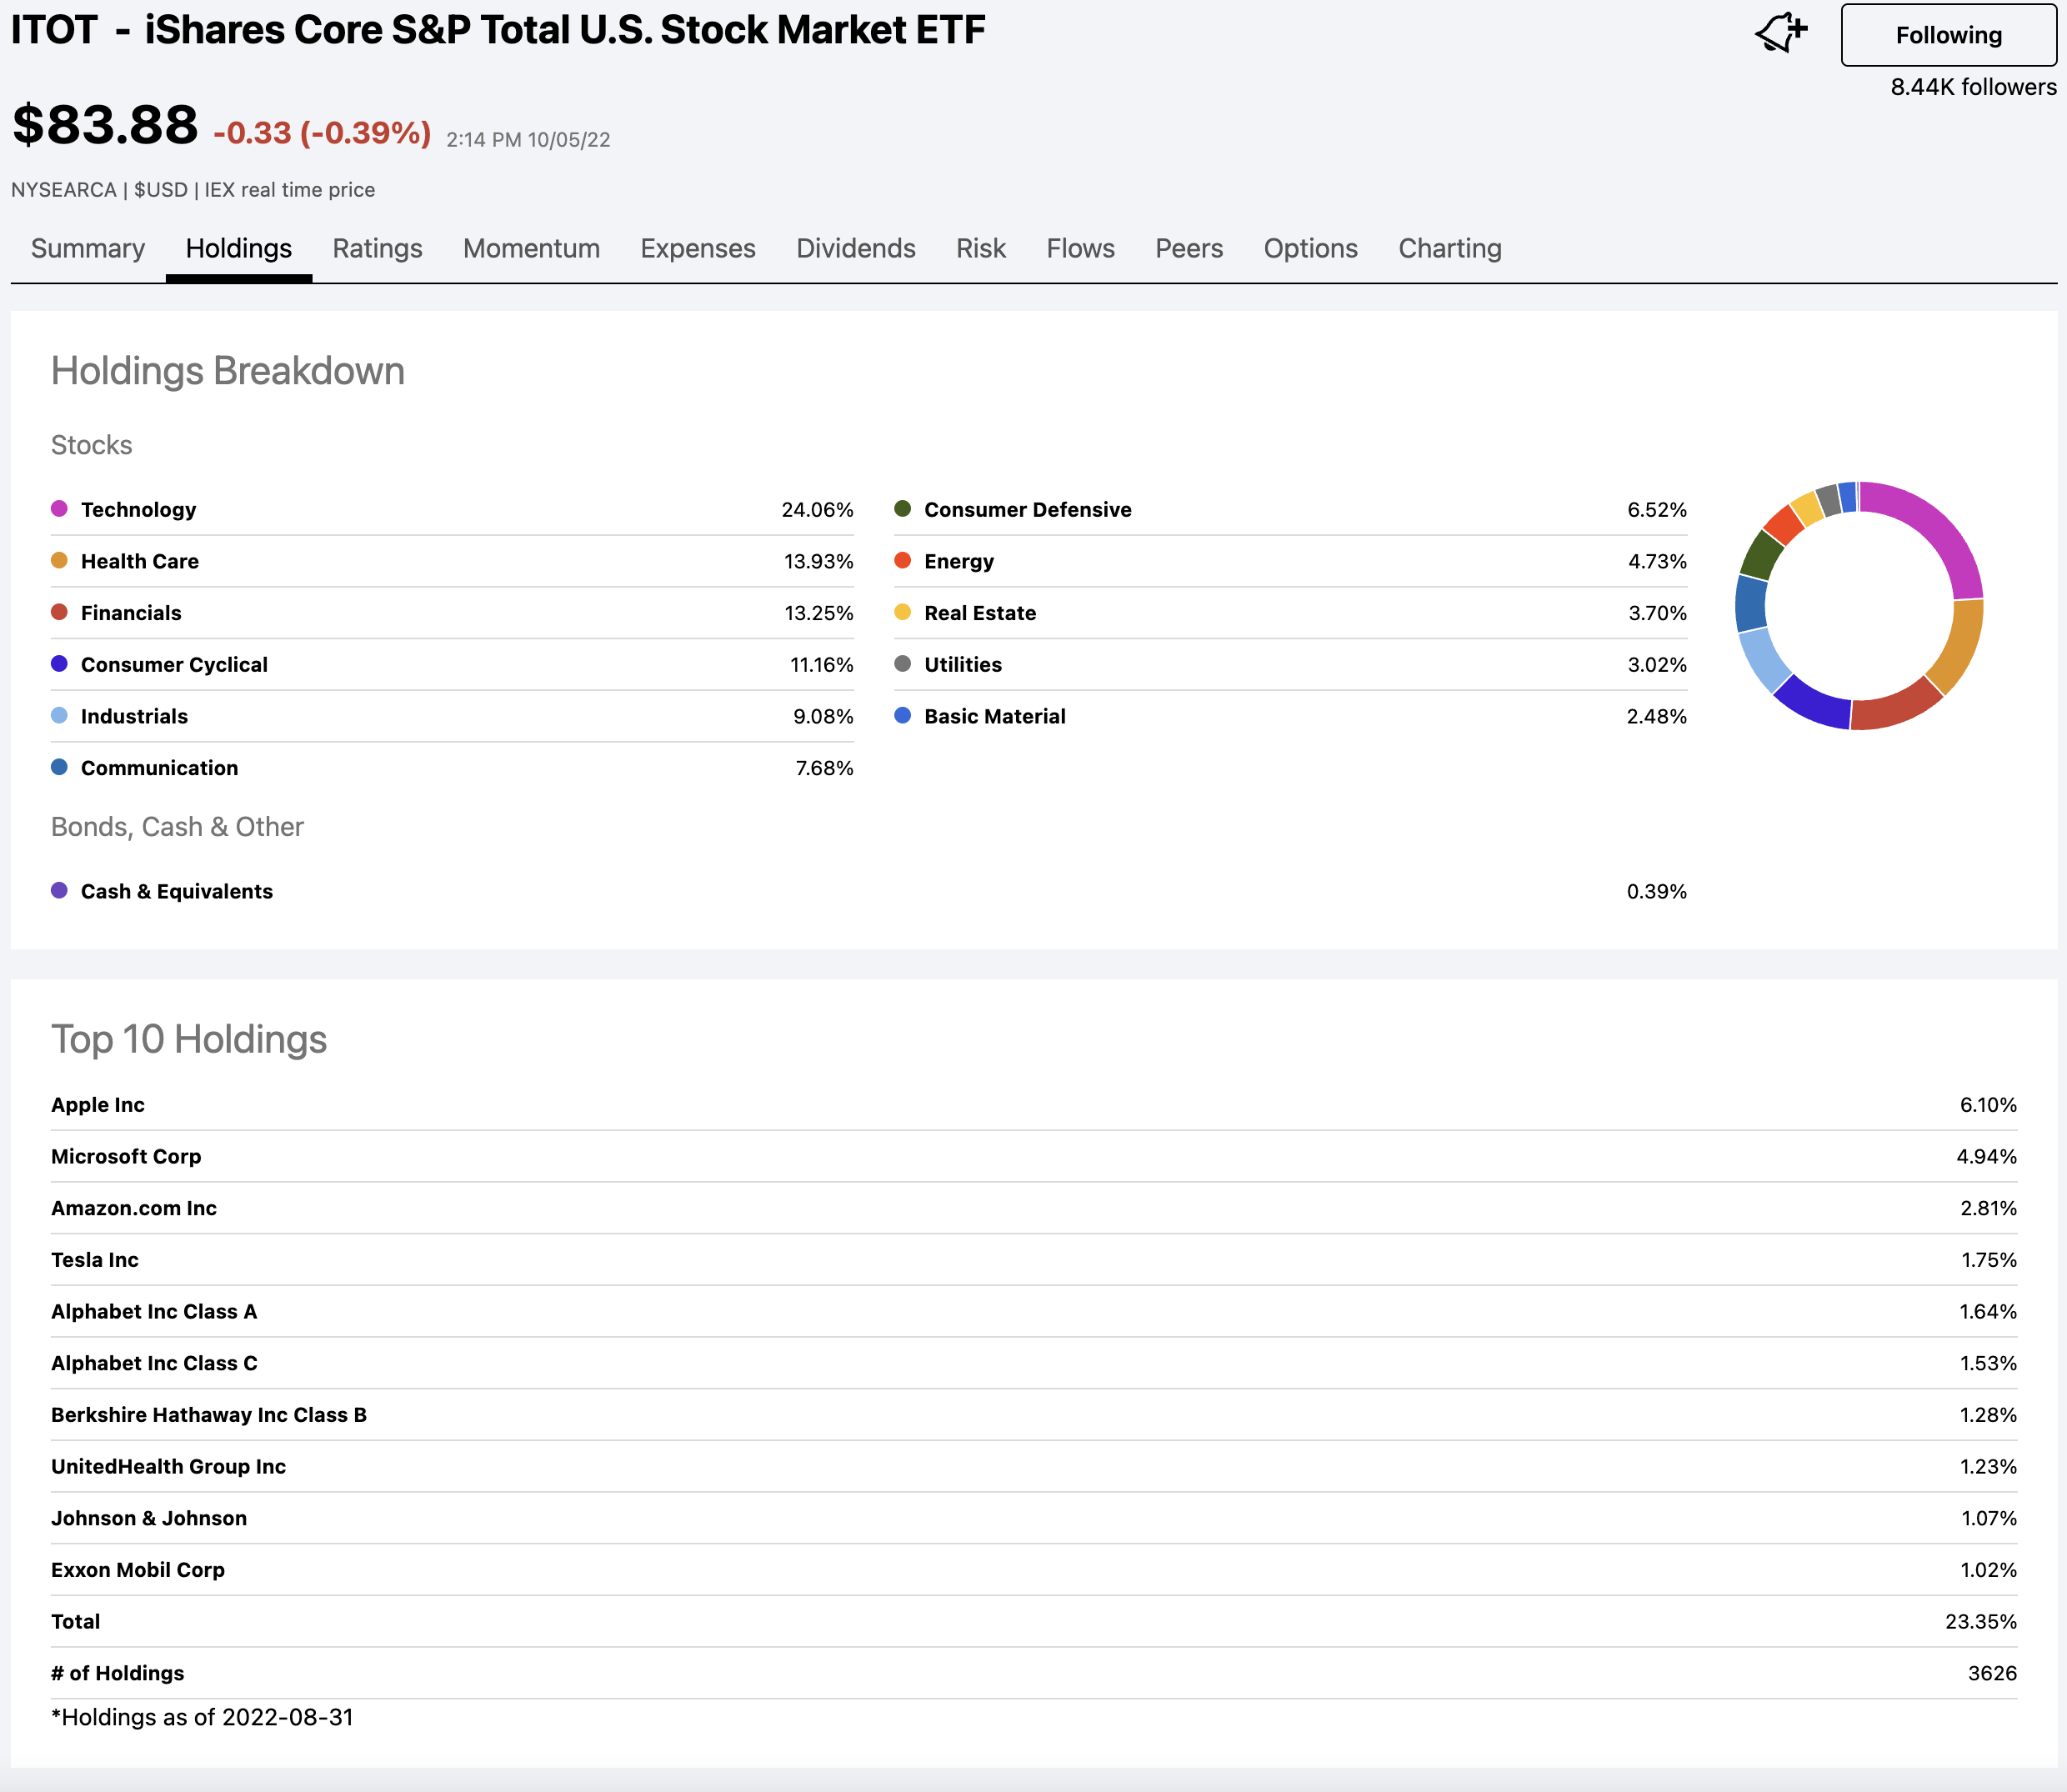
ITOT: Sector Breakdown & Top 10 Holdings (Seeking Alpha)
One quick note. I chose ITOT for this comparison, as it sort of “splits the difference” between the indexes used for VTI and SCHB. As of 8/31/22, VTI contained some 4,059 holdings. SCHB, in contrast, contained 2,506. With 3,626 holdings, ITOT comes in right in the middle.
Please, though, look as closely as you like, either at the sector breakdown or the Top 10 holdings of the two ETFs. The biggest difference I can find anywhere amounts to 0.1%, the difference between the 24.16% Technology sector weighting in SCHB vs. 24.06% in ITOT. Not at all surprisingly, then, the weighting of any of the Top 10 components varies by no more than one or two hundredths of one percent.
If you were to pull up the same comparison using VTI, you would find essentially the same thing.
Performance Comparison: SCHB, VTI, And ITOT
What about performance, though? Might it be the case that SCHB’s tighter focus on the top 2,500 securities offers some benefit in eliminating the lowest-quality companies from the total field, thereby offering even marginally better performance?
To take a look at this, I pulled up a backtest using Portfolio Visualizer. For any who would like to take a closer look, here’s a link to the backtest.
For what it’s worth, this backtest is fully representative of SCHB’s historical performance. As the newest ETF of the 3, it was SCHB’s inception date of 11/03/2009 that was the limiting factor in how far the backtest could go.
Have a look.
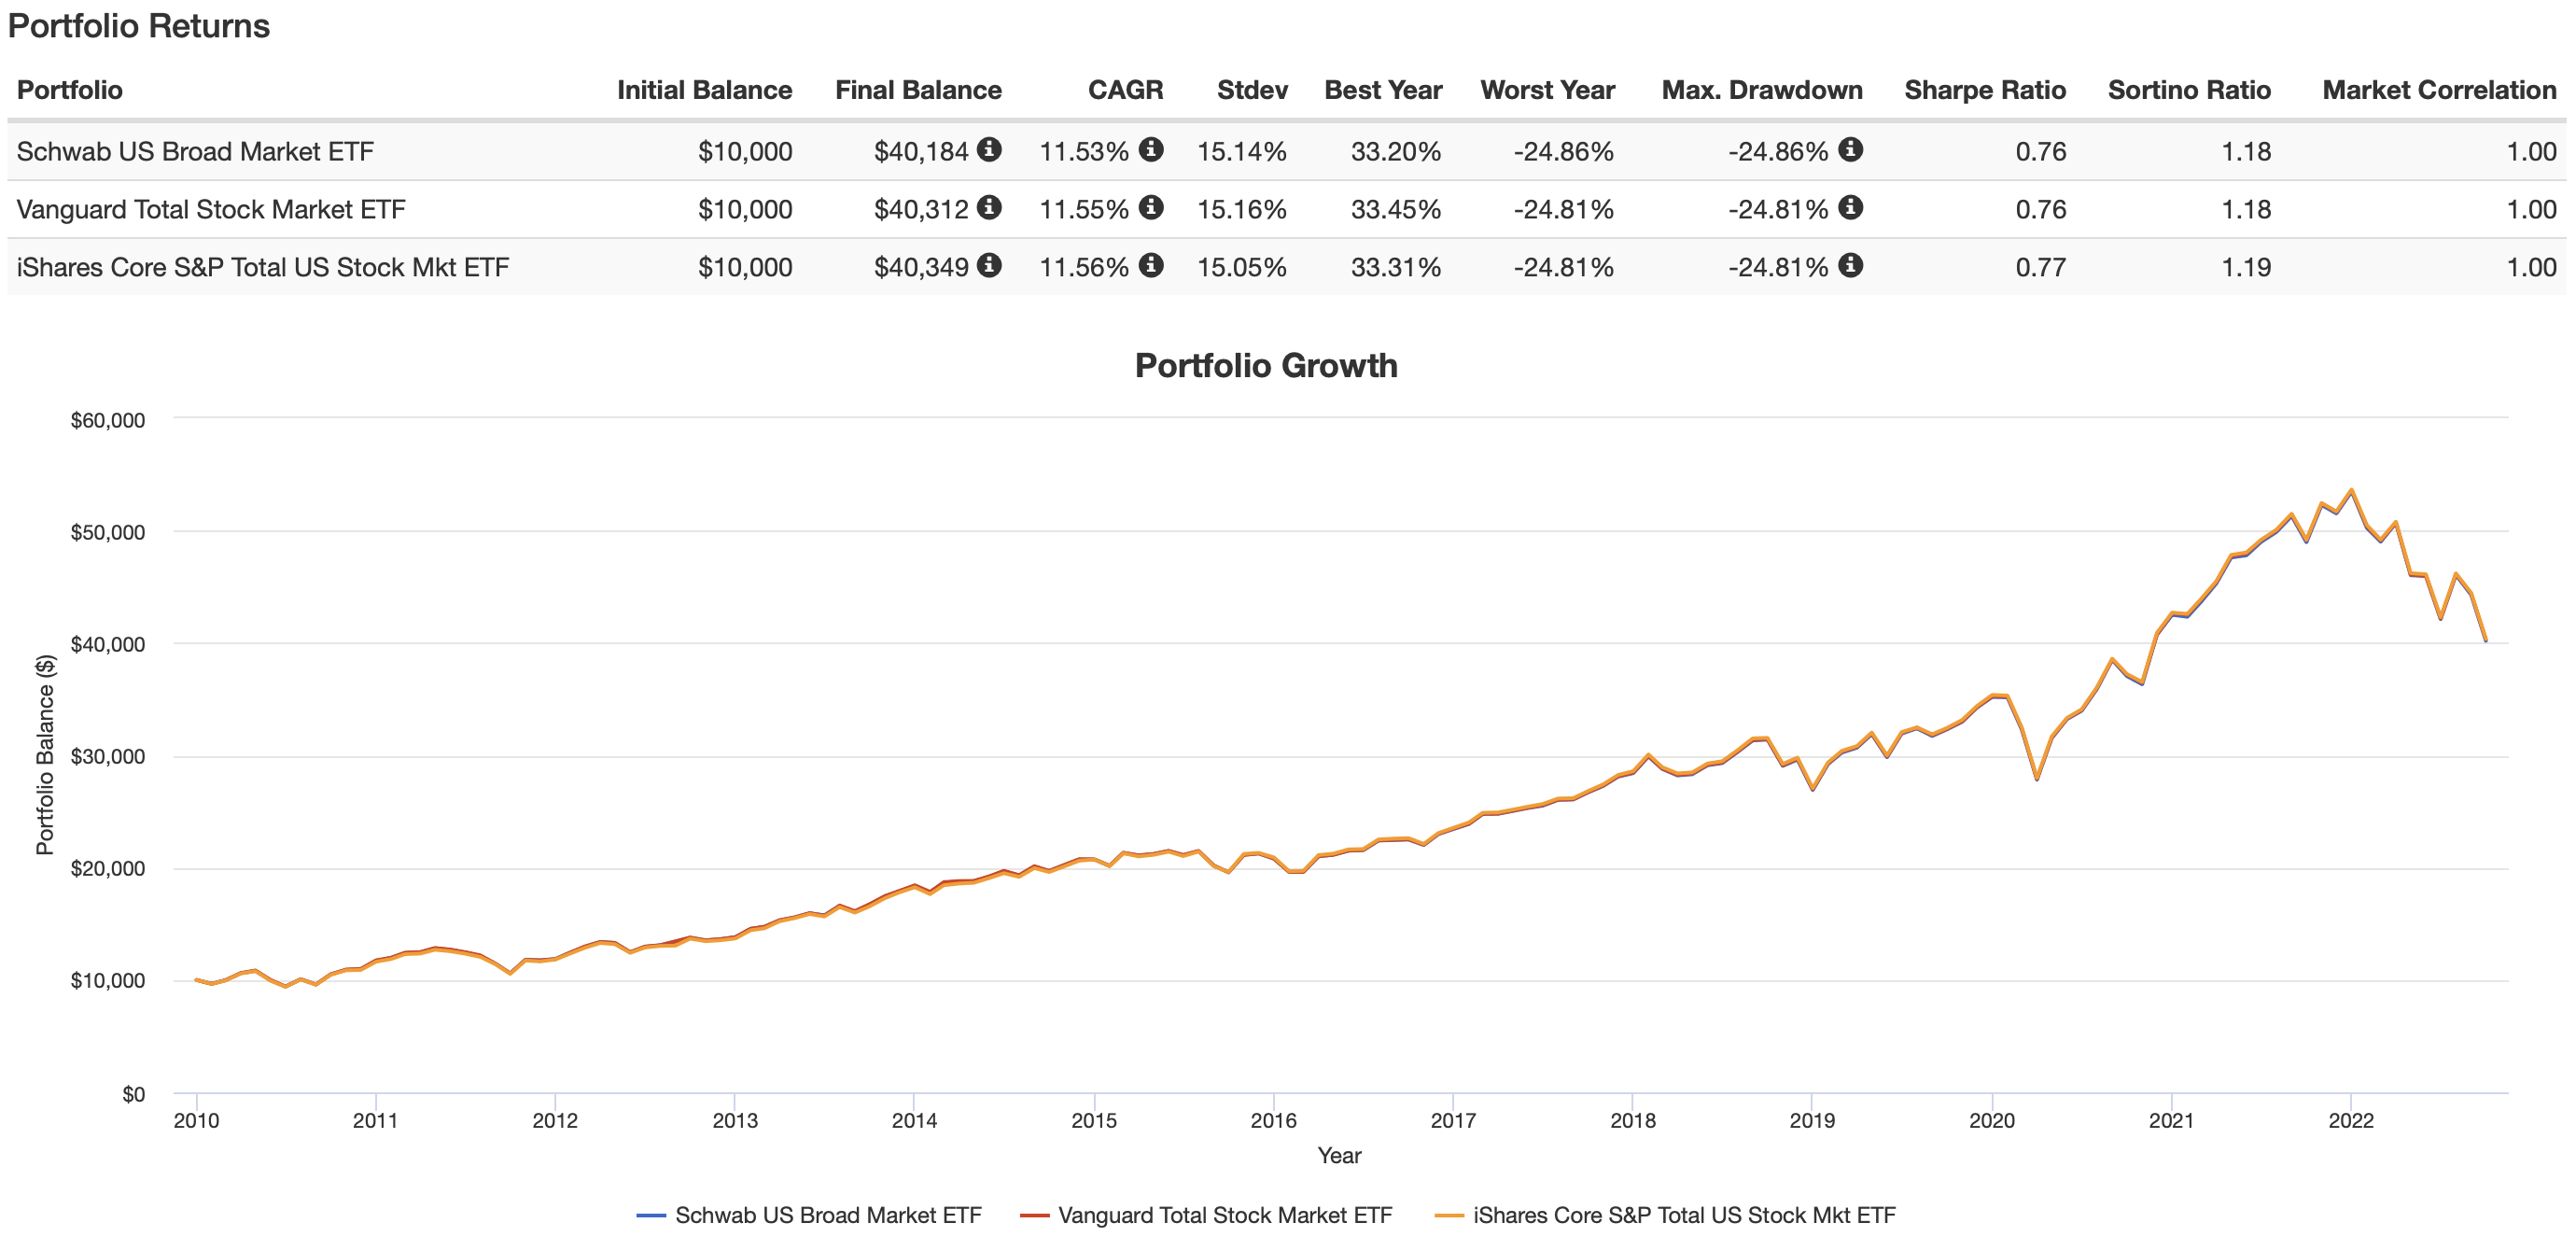
SCHB, VTI, ITOT: Performance Comparison (PortfolioVisualizer.com)
To be fair, the big picture takeaway is that all 3 ETFs have produced virtually identical performance. However, it appears to clearly answer the question as to whether the techniques employed by SCHB have led to outperformance. In fact, it is the opposite, albeit to a negligible degree.
In short, then, if an investor is already in SCHB, there is no compelling reason to change this. On the other hand, for an investor evaluating VTI, ITOT, and SCHB in terms of making an initial investment, in all honesty, I would pick either VTI or ITOT.
Summary and Outlook
In my most recent article here on Seeking Alpha, summarizing the Q3 performance of the ETF Reliable Retirement Portfolio, which I manage on behalf of Hoya Capital Income Builder, I offered the following comments in the closing section.
Interestingly, a couple of months back, I wrote a fairly comprehensive summary of a recent note from Zoltan Pozsar, Investment Strategist at Credit Suisse.
Here is what I later wrote concerning what I was pondering, both for my personal portfolio as well as for the ETFRRP.
My takeaway is that the next key area I am watching for is right around 3,500-3,600. At 3,600, you have a 25% decline in the S&P.
. . . Bearing in mind that, as a retiree, I need to remain somewhat cautious with my allocation, I feel like I might be willing to move to 55% stocks at 3,600. Perhaps 56% at 3,400.
As it happens, the S&P index closed Q3 at exactly 3,585.62. Clearly, what I theorized based on my reading of Pozsar’s note, as well as other sources, came to pass.
In the first couple of days of October, the market has staged a fairly substantial relief rally. However, I believe there will be another leg down before things stabilize. In the above quote, you will see reference to the S&P at 3,400. Extrapolating from Pozsar’s note, linked above, this does not appear to be out of the question.
More recently, Morgan Stanley has offered a viewpoint along the same lines.
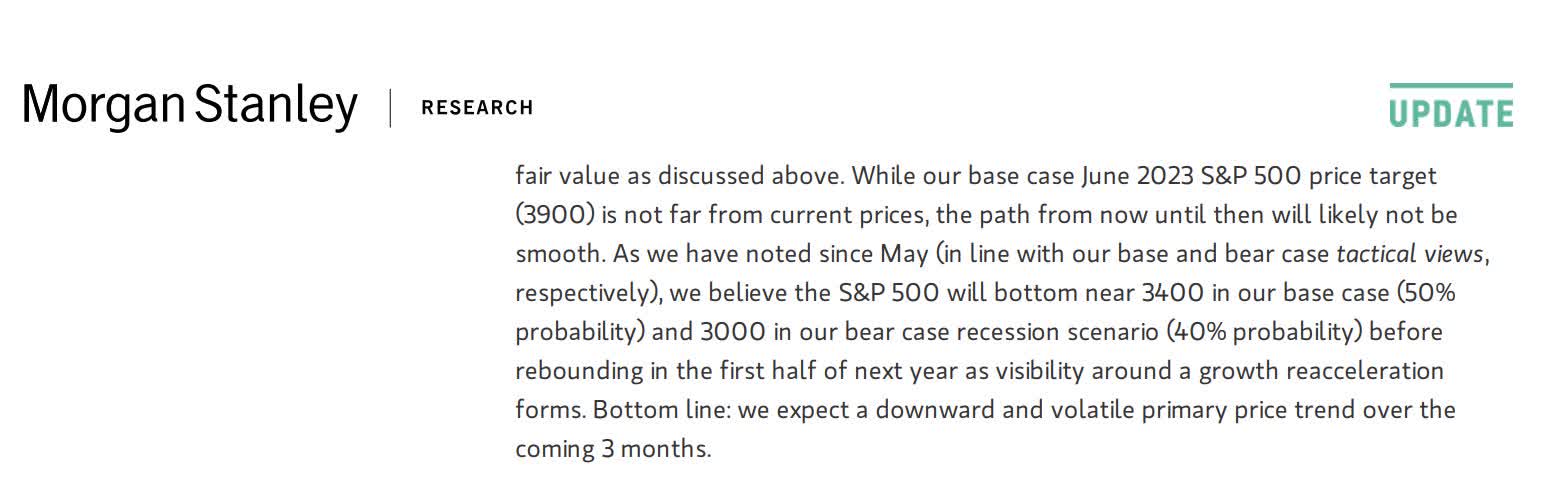
S&P 500 Forecast (Morgan Stanley)
Given all of this, if you are looking for a first entry point into either SCHB or either of its competitors referenced in this article, I might be willing to dip my toes in at the current time. However, I believe there may be yet better opportunities ahead.
I hope you have found this article helpful. Please, drop any questions or comments in the comments section below.
Be the first to comment