

Marvin Samuel Tolentino Pineda/iStock via Getty Images
Introduction
Vancouver-based Sandstorm Gold (NYSE:SAND) released its first-quarter 2022 results on May 11, 2022.
Note: This article updates my preceding article on Sandstorm Gold published on February 20, 2022. I have been following SAND quarterly results since 2015.
1 – 2021 Production and revenues snapshot
It was a solid quarter with a record gold equivalent production of 18,741 Au Eq. Oz (17,744 Au Eq. Oz last year) and record revenues of $35.37 million, with an average price per GEO reaching $1,889 per ounce.
Net income was $9.14 million in 1Q22 compared to $4.97 million in the comparable quarter a year ago. Sales costs were $5.4 million, nearly the same year over year.
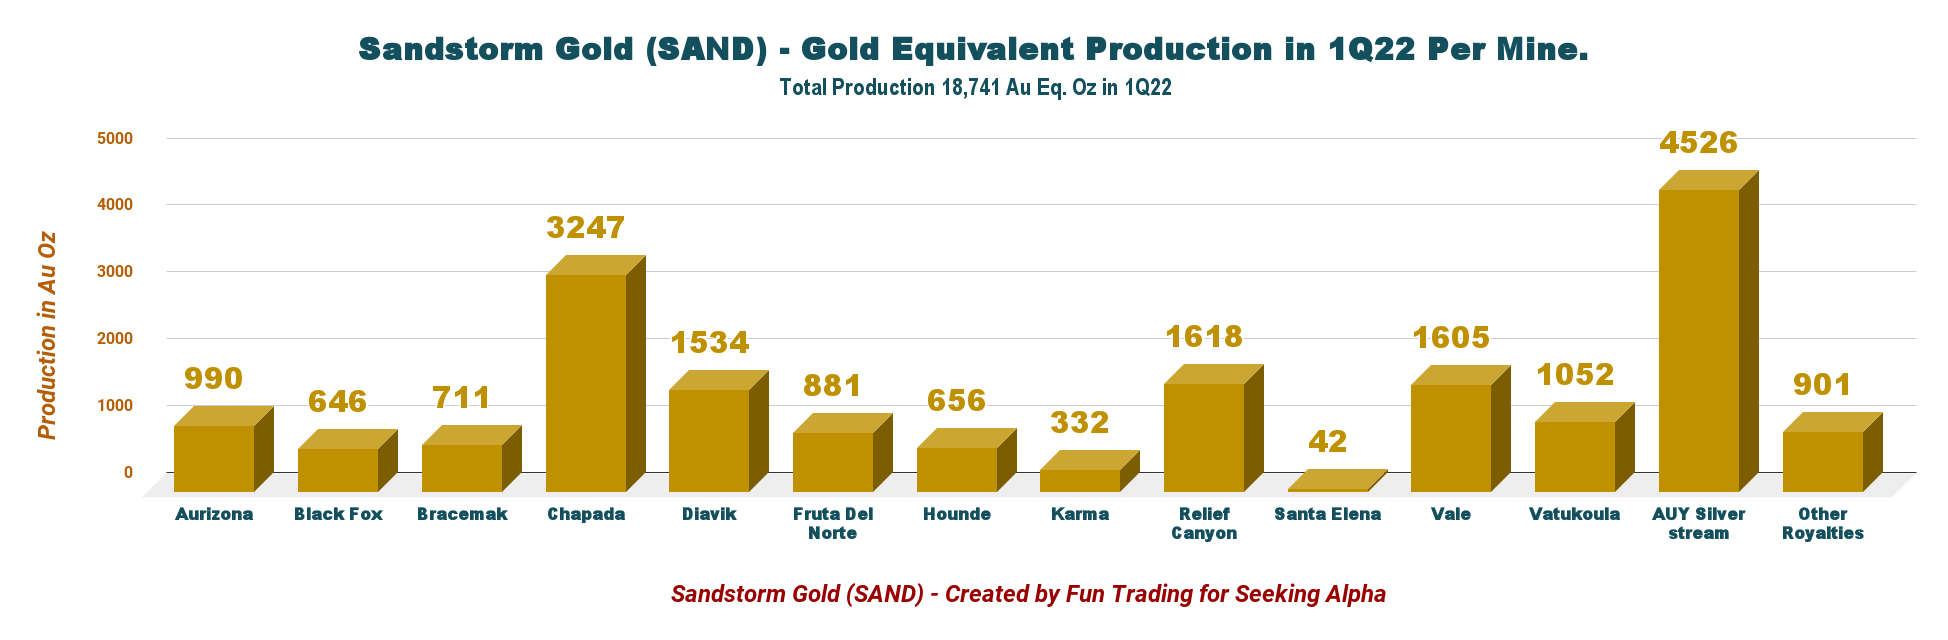
The company added The Vatukoula gold mine this quarter, as shown below:
SAND: Quarterly gold equivalent production per mines 4Q21 versus 1Q22 (Fun Trading)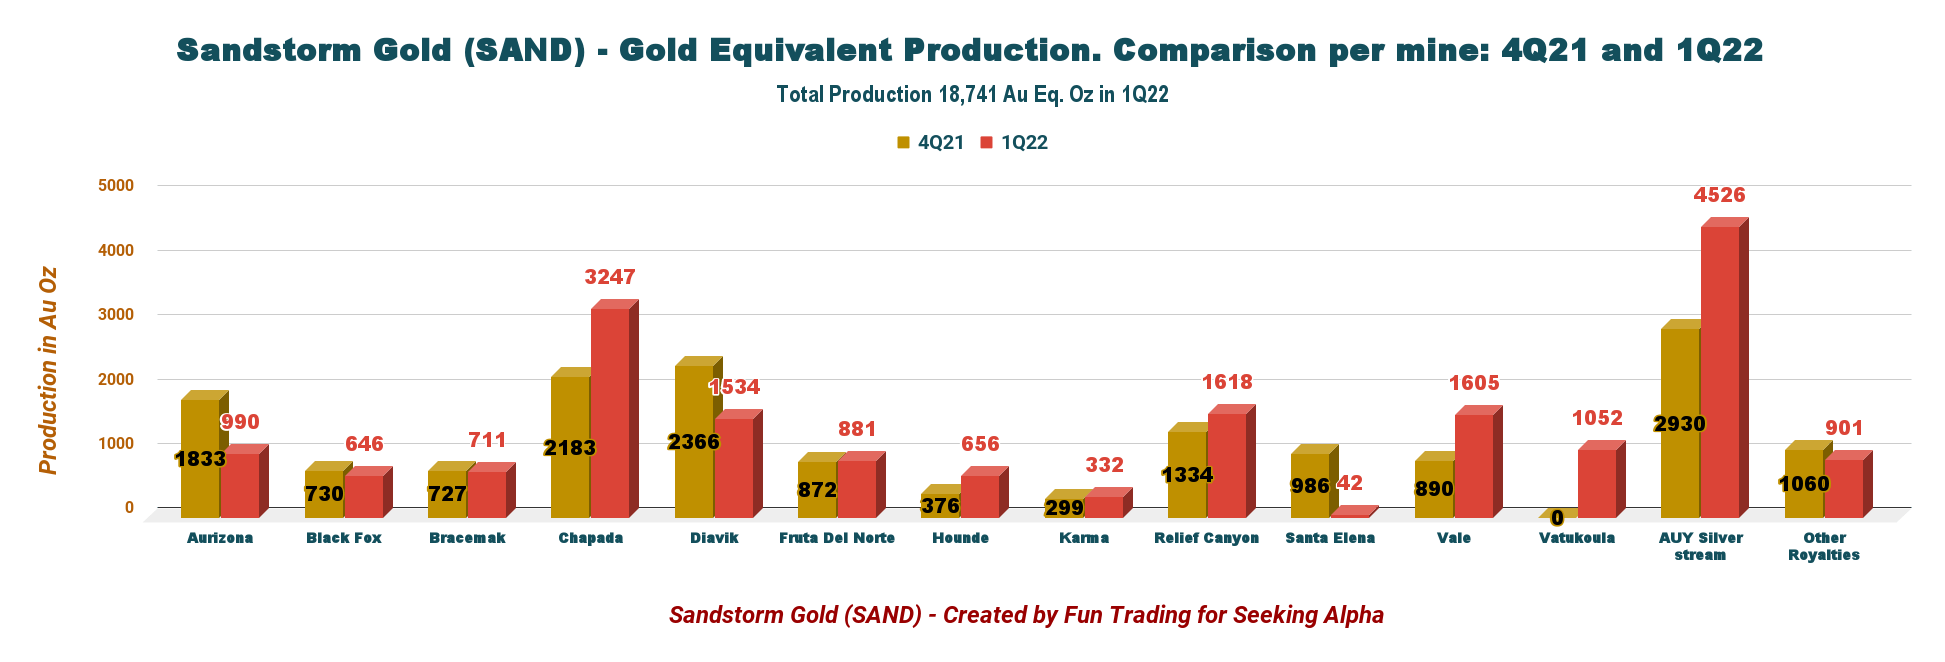
Note: In April 2022, the Company closed its $60 million financing package with Bear Creek Mining to facilitate its acquisition of the producing Mercedes gold-silver mine in Mexico from Equinox Gold Corp (EQX). The financing package included a $37.5 million Gold Stream and a $22.5 million convertible debenture.
More importantly, On May 2, 2022, Sandstorm Gold announced two significant transactions.
1.1 – SAND acquired Nomad Royalty (merger) for an estimated $590 million.
For more details, I covered the two transactions in my article on May 3, 2022.
Nomad owns a portfolio of 20 royalty and stream assets, of which seven are producing mines. In 2021, the portfolio generated $27 million in revenue and approximately 16K GEOs. Sandstorm indicated that the transactions added about $1.1 billion to its portfolio.
Nomad’s shareholders obtained upfront consideration of 1.21 Sandstorm Shares for each Nomad Share held, implying C$11.57 per Nomad share based on the closing price of SAND on April 29, 2022. The transaction is expected to be completed in H2 2022.
The total pro-forma shares outstanding after the merger will be approximately 284 million (including the BaseCore equity transaction). Existing SAND shareholders will own about 67% of the Newco.
SAND Nomad merger (Sandstorm Gold)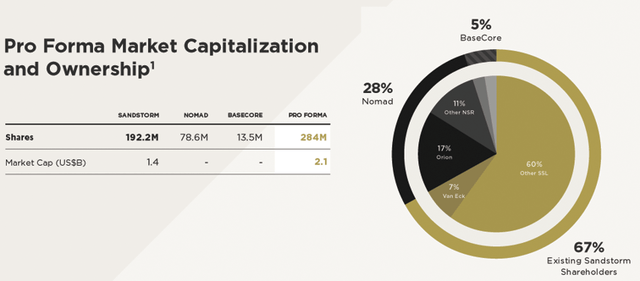
1.2 – Acquisition of nine royalties plus one stream from BaseCore Metals LP for $425 million cash and $100 million in SAND shares.
The transaction is expected to close this quarter and is funded with an upsized credit facility of $500 million for the first $425 million. SAND will issue 13.5 million shares (see chart above) for the remaining $100 million.
One crucial asset acquired is the 1.66% NPI on the Antamina mine in Peru (copper/zinc), the World’s third-largest copper mine owned by Teck Resource, BHP Plc., Glencore Plc, and Mitsubishi Corp.
SAND Transaction Nomad presentation (Sandstorm Gold)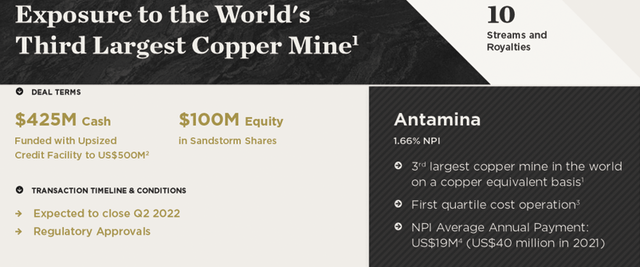
CEO Nolan Watson said in the conference call:
last week, we announced two company transforming acquisitions totaling US$1.1 billion. And because of those transactions, we’re excited that in addition to these record revenue and cash flow results this quarter, we’ll now be expecting new revenue and cash flow records going forward for years to come.
Note from the press release:
Concurrent with the transactions described above, Sandstorm entered into an agreement with the Bank of Nova Scotia and BMO Capital Markets securing a commitment to upsize the Company’s existing revolving credit agreement to borrow up to $500 million with an additional uncommitted accordion of up to $125 million, for a total of up to $625 million. The upsize is contingent upon closing the BaseCore acquisition
1.3 – 2022 guidance raised to 80K-85K GEOs
The transactions raise Sandstorm’s 2022 production guidance by approximately 22% from 65K–70K gold equivalent ounces GEO to 80K–85K GEO and increase long-term production guidance by 55% from 100K GEO to 155K GEO in 2025.
1.4 – Investment Thesis
These new transactions and merger with Nomad create a significant event for Sandstorm Gold and its shareholders. It is not an easy task to project its possible benefits and how the Newco’s shareholders will profit from this significant addition.
The diluted share will go higher, and production and revenues with a market cap of $2.1 billion from $1.4 billion. Bigger is not necessarily better, and the market reaction was quite adverse.
SAND: Shares outstanding diluted estimated history (Fun Trading)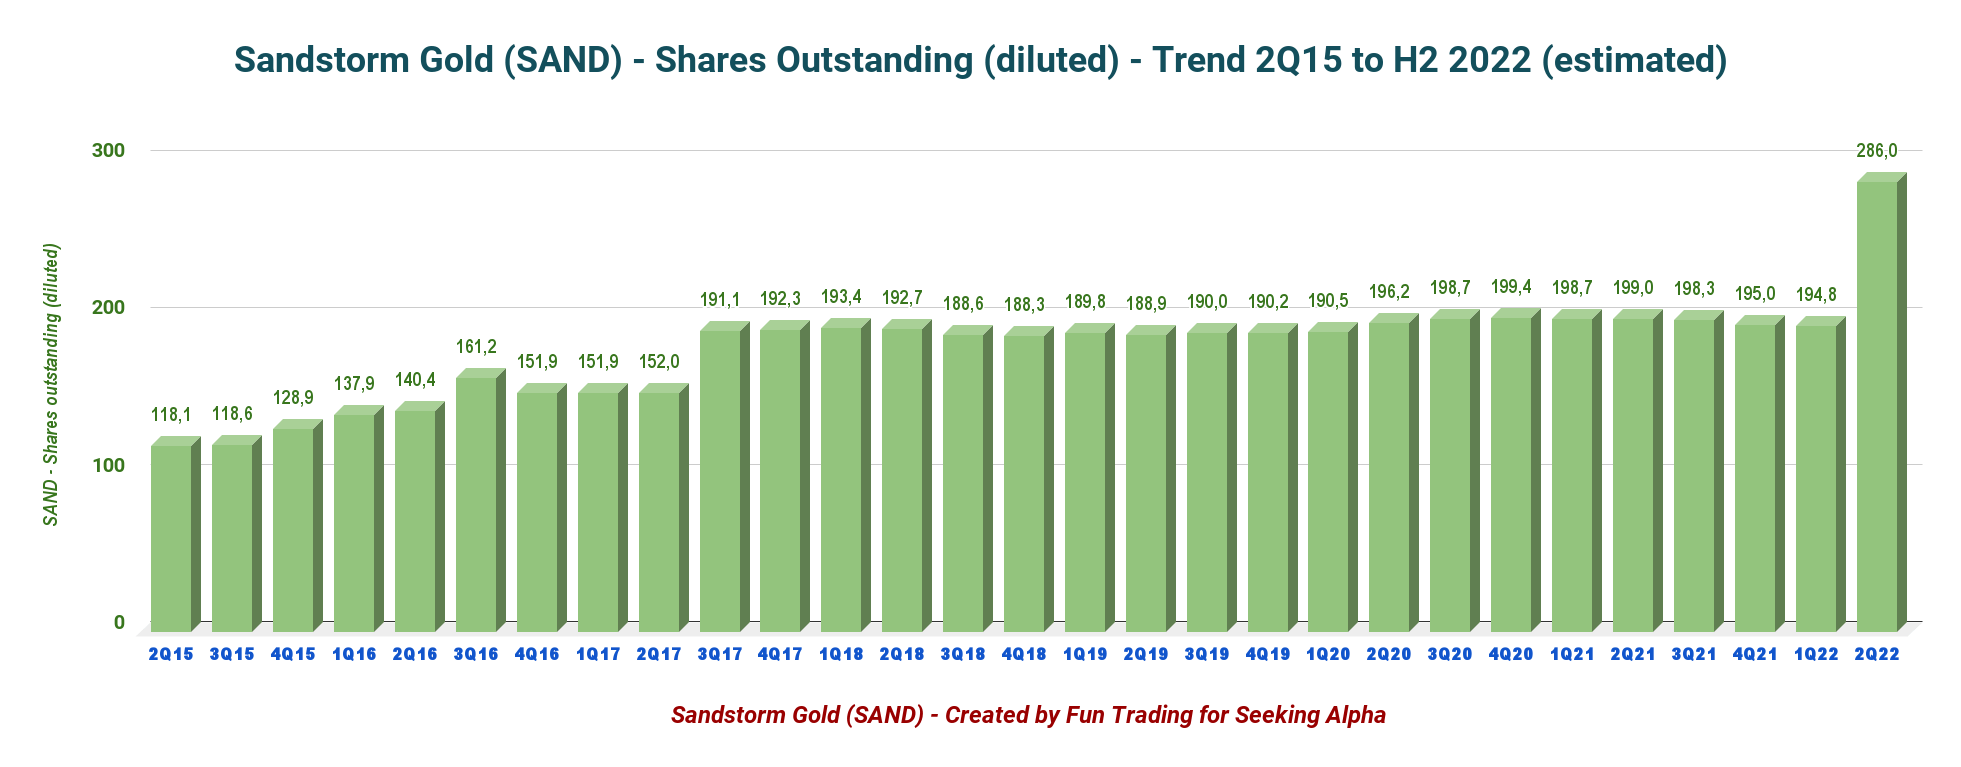
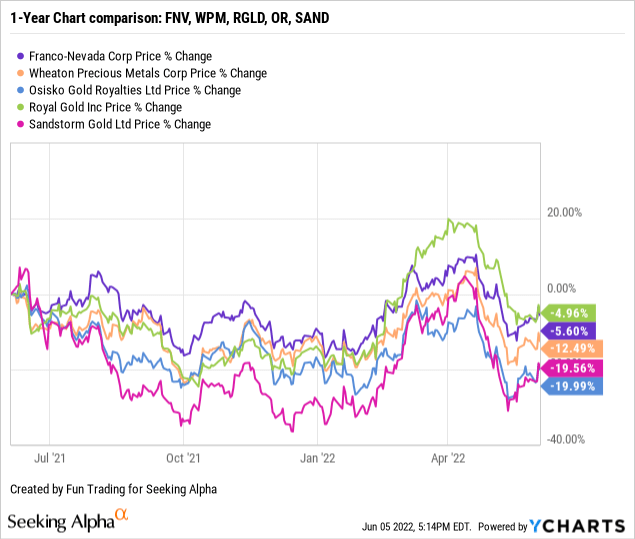
SAND continues to be an excellent trading tool. Still, I am reticent to consider the stock a proper long-term investment like Franco-Nevada (FNV), Royal Gold (RGLD), or Wheaton Precious Metals (WPM). However, I can see some potential long-term.
Thus, one excellent strategy that I often recommend in this sector in my marketplace, “The Gold and Oil Corner,”, especially for SAND, is trading a minimum of 60% LIFO of your whole SAND position and keeping a core long-term position for a much higher stock price. The company is paying a small dividend now or about 0.9% (0.68% net for the USA).
I believe it is the best strategy (the backbone of my marketplace) that will shield you from “surprises.” However, only US investors can trade LIFO. Please read the note at the end of the article.
2 – Stock Performance
Sandstorm Gold continues to be one of the weakest performers in this segment and is down 20% on a one-year basis.
Sandstorm Gold – Financial Results Snapshot 1Q22 – The Raw Numbers
| Sandstorm Gold | 1Q21 | 2Q21 | 3Q21 | 4Q21 | 1Q22 |
| Revenues in $million | 31.00 | 26.45 | 27.60 | 29.82 | 35.37 |
| Net Income to shareholders in $million | 4.97 | 8.64 | 6.62 | 7.40 | 9.14 |
| EBITDA in $ million | 19.59 | 22.73 | 20.17 | 20.67 | 25.72 |
| EPS Diluted | 0.03 | 0.04 | 0.03 | 0.04 | 0.05 |
| Cash From Operating Activities in $ million | 23.72 | 20.00 | 17.91 | 19.51 | 22.36 |
| CAPEX in $million | 0 | 121.04 | 8.96 | 22.69 | 3.11 |
| FCF in $million | 23.72 | -101.04 | 8.95 | -3.19 | 19.25 |
| Total cash in $ million | 142.87 | 45.81 | 37.65 | 16.17 | 31.61 |
| Total Debt in $ million | 0.0 | 0.0 | 0.0 | 0.0 | 0.0 |
| Shares outstanding diluted in million | 198.73 | 199.01 | 198.31 | 194.96 | 194.84 |
| Dividend per share in $ | 0 | 0 | 0 | 0 | 0.015 |
| Production | 1Q21 | 2Q21 | 3Q21 | 4Q21 | 1Q22 |
| In K Au Eq. | 17.4 | 18.0 | 15.5 | 16.6 | 18.7 |
| Gold price | 1,777 | 1,796 | 1,779 | 1,789 | 1,887 |
Source: Company report analysis by Fun Trading (data are available since 2015 only for subscribers)
Part I – Balance Sheet Details
1 – Quarterly Revenues and Trends: Total revenues of $35.37 million in 1Q22
SAND Quarterly Revenue history (Fun Trading)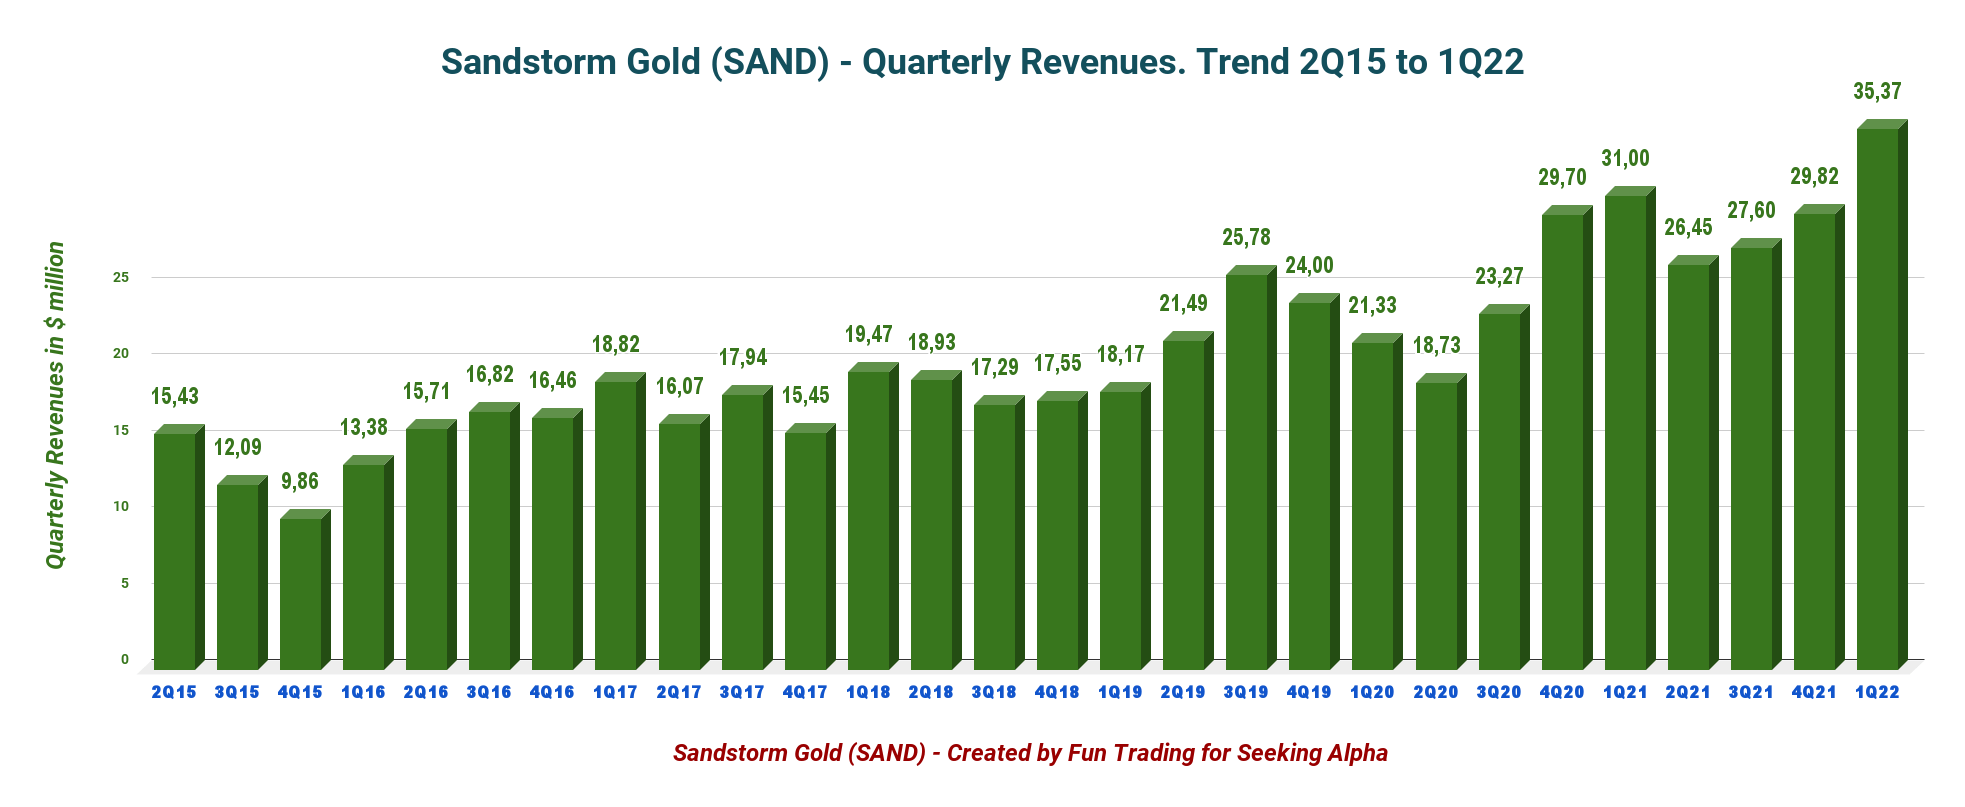
The net income was $9.14 million in 1Q22 or $0.05 per diluted share compared to $4.94 million or $0.03 per diluted share the same quarter a year ago.
The cash costs per attributable ounce are up to $283 per ounce, resulting in cash operating margins of $1,604 per ounce for the first quarter.
SAND Quarterly Cash Costs history (Fun Trading)
2 – Free Cash Flow was a loss estimated at $19.25 million in 1Q22
SAND: Quarterly Free cash flow history (Fun Trading)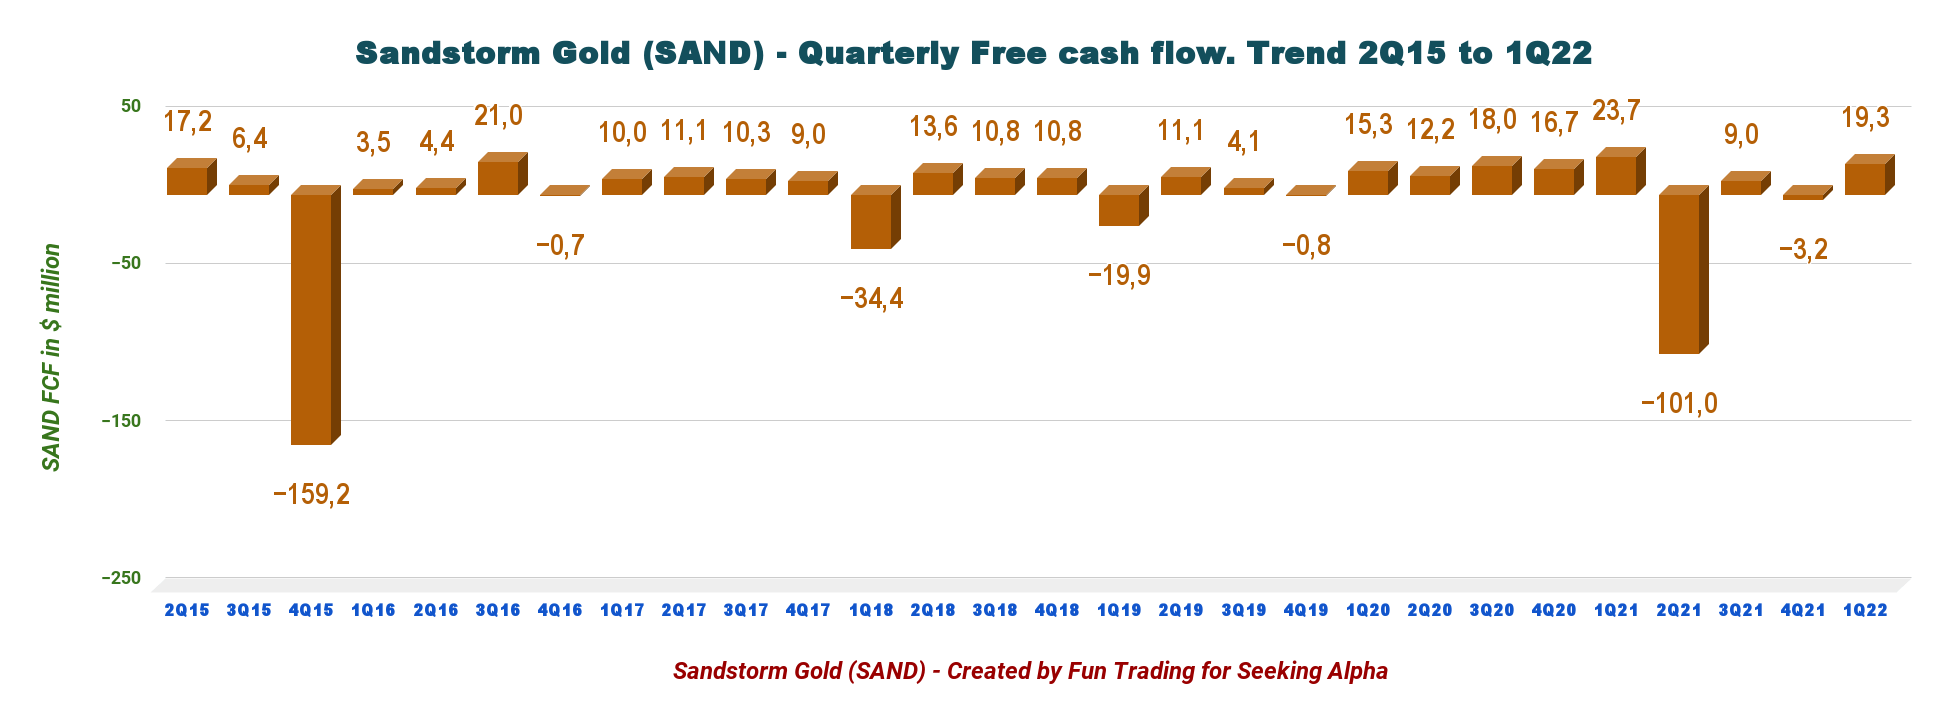
The free cash flow was $19.25 million in the first quarter of 2022, and the trailing 12-month free cash flow was a loss of $76.03 million.
The quarterly dividend is now $0.015 per share, or a dividend yield of 0.88%.
3 – Total shares outstanding diluted have barely changed despite the buyback
This topic is essential for Sandstorm Gold because of the number of warrants and options the company has used previously.
SAND: Quarterly Shares outstanding diluted history (Fun Trading)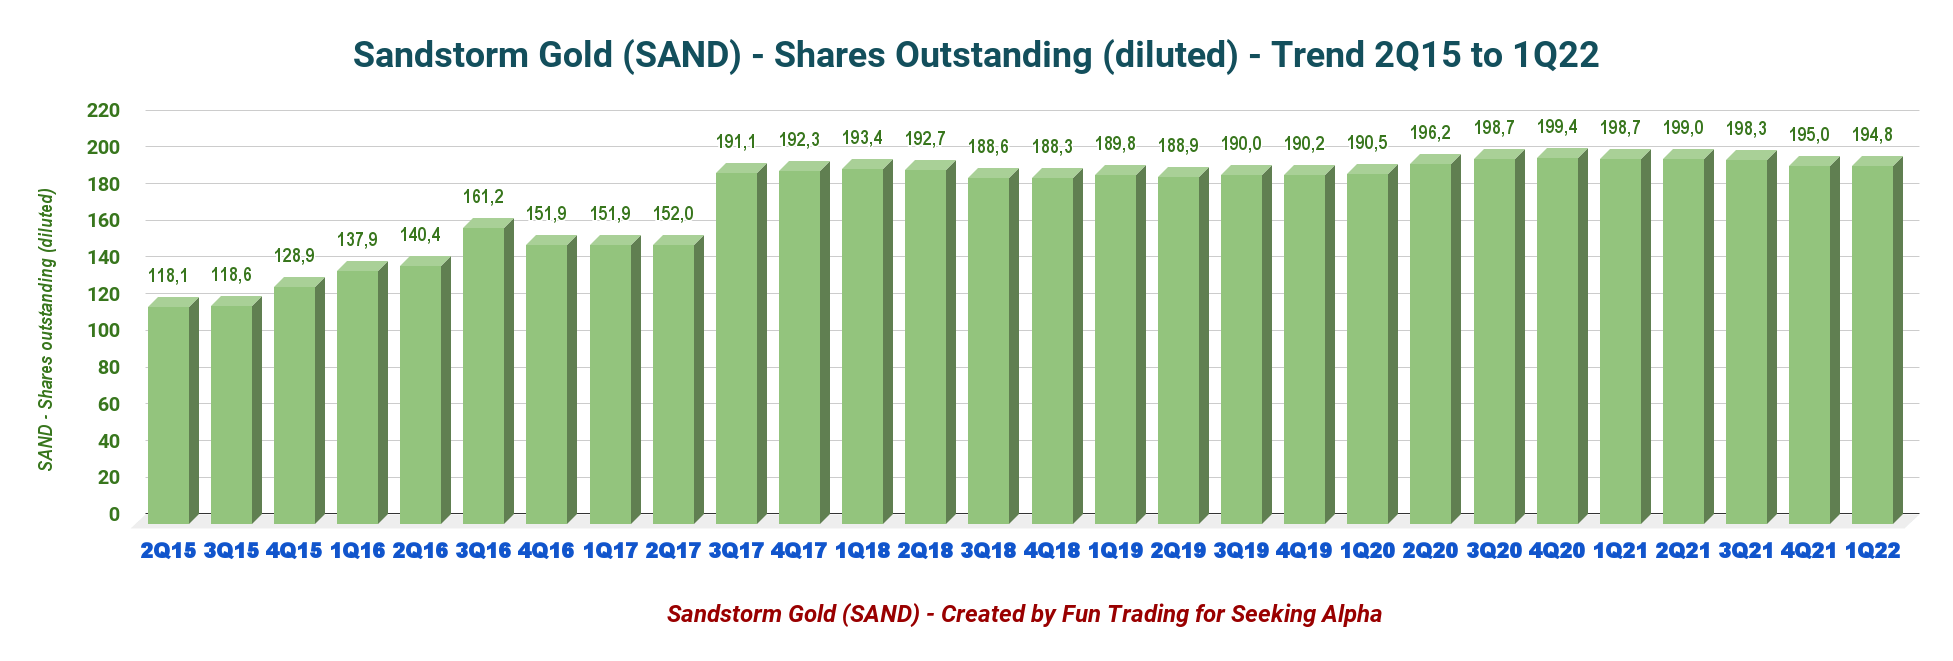
The total outstanding shares diluted is now 194.84 million, nearly at a record high even if the company indicated that it purchased 21 million since 2018.
4 – The company has no debt, and its cash position was $31.61 million at the end of March 31, 2022.
SAND: Quarterly Cash versus Debt history (Fun Trading)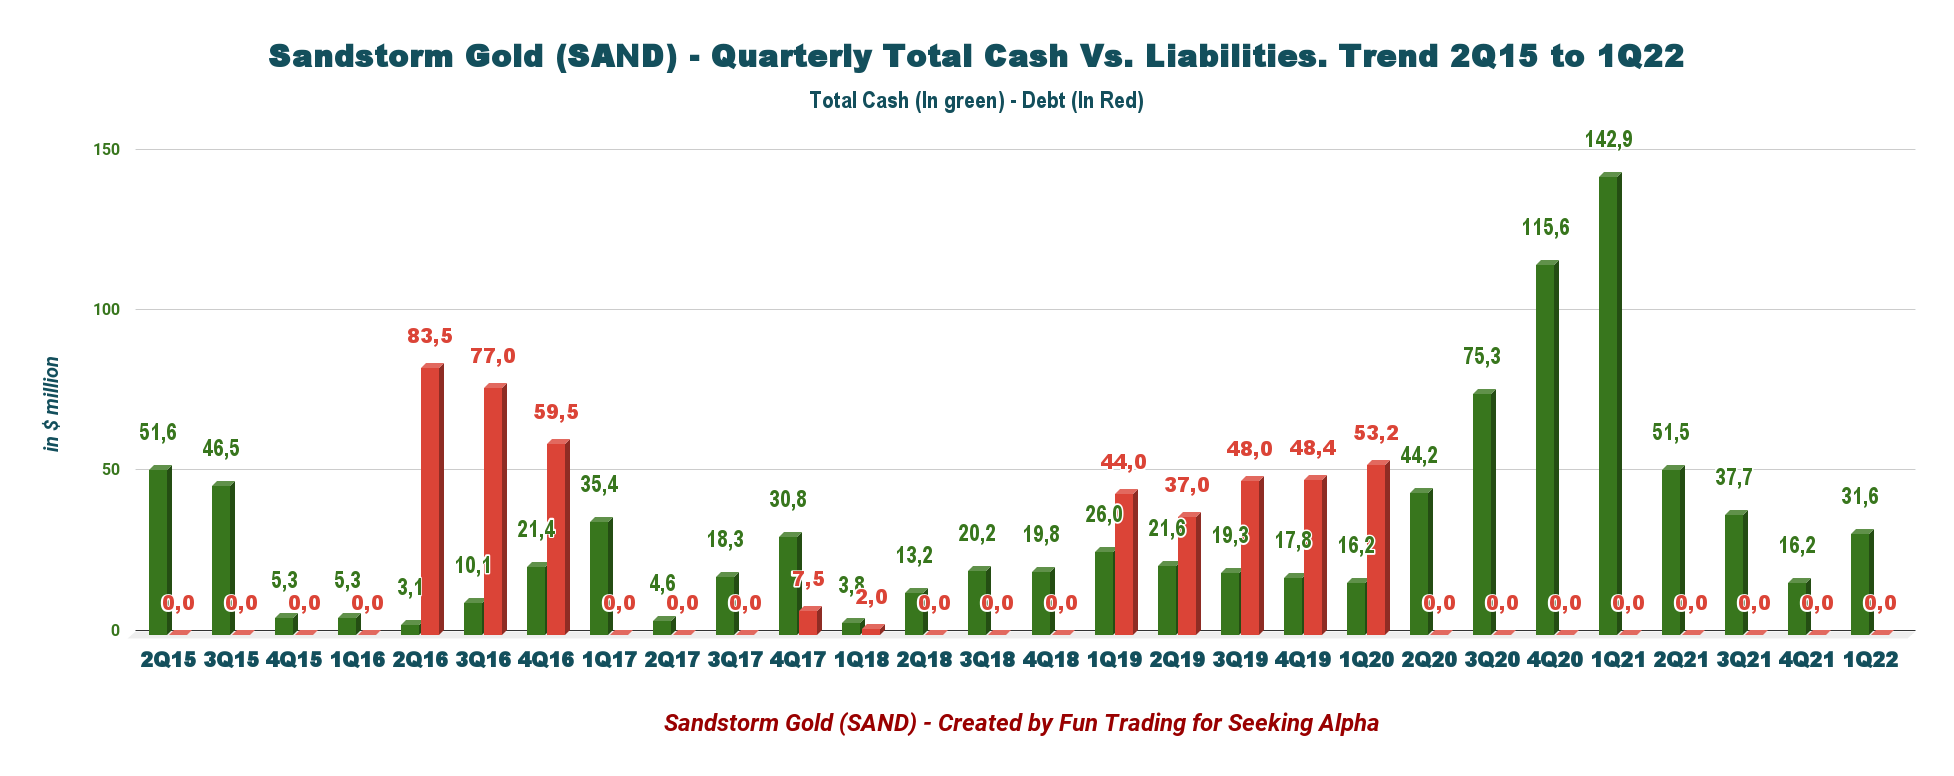
Part 2 – Gold Production details
SAND: Quarterly Gold equivalent history (Fun Trading) SAND: Quarterly Gold equivalent per mine in 1Q22 (Fun Trading) SAND: Quarterly Gold price realized history (Fun Trading )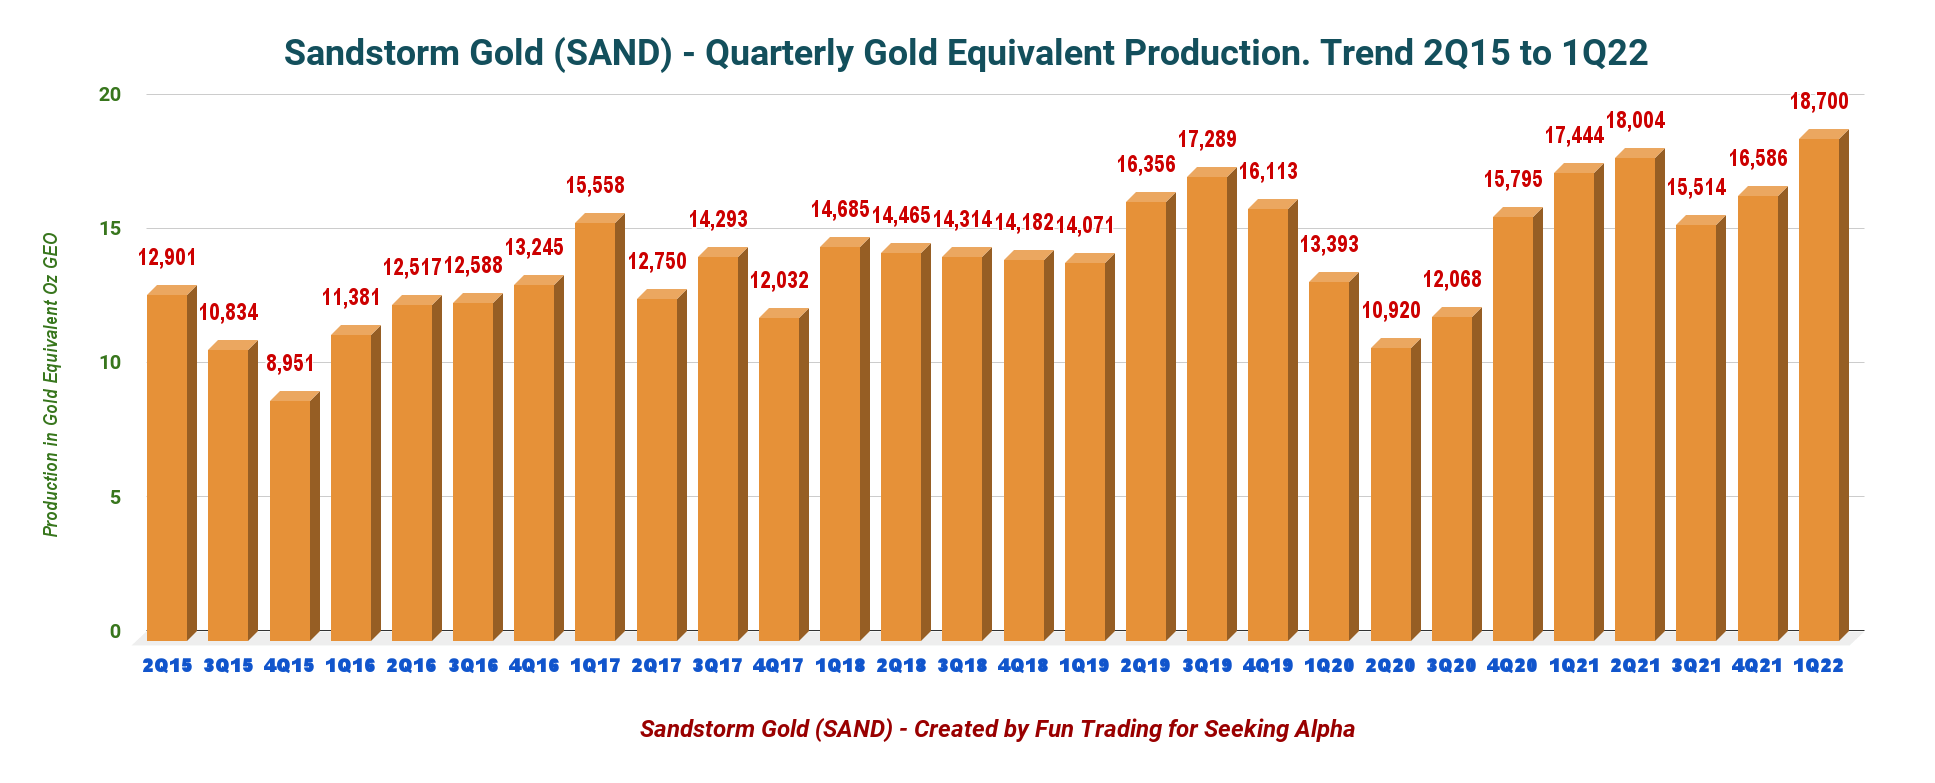

Technical Analysis and commentary
SAND: TA Chart short-term (Fun Trading)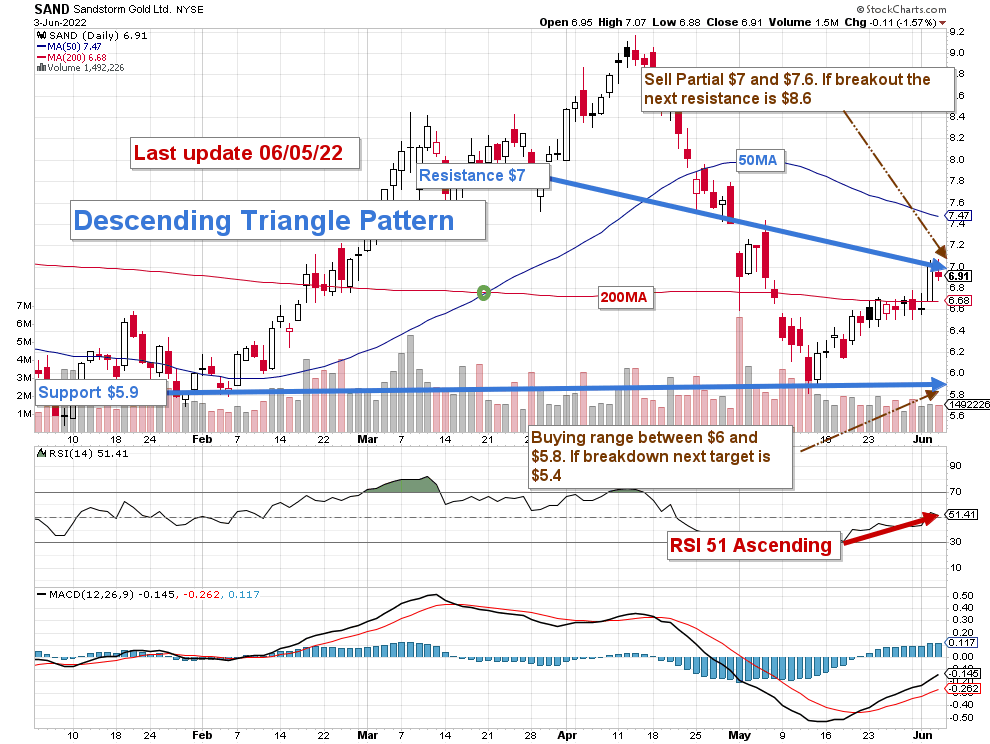
The trading strategy for SAND is to sell at a resistance range of $7 to $7.10, about 50% of your position, and eventually sell another part on any pattern breakout at $8.60. Conversely, it is reasonable to buy and accumulate between $5.80 and $6.10, with potential mid-support around $6.50 and lower support at $5.40.
The gold and silver prices are at $1,850 and $22, but it is fragile support due to the Fed’s hawkish position.
Gold and Silver comparison 1-Year (Fun Trading Stockcharts)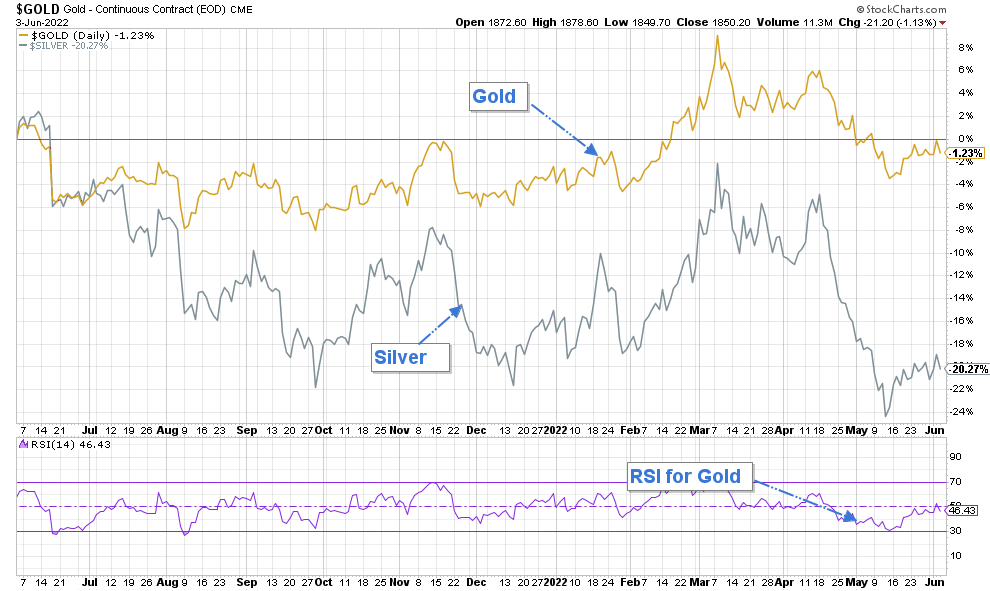
The gold price quickly dropped after the Fed decided to hike by 50-point in early May, and the Fed will likely continue hiking for the next few quarters due to high inflation.
The gold price could weaken and eventually break down and reach $1,750 per ounce.
Note: The LIFO method is prohibited under International Financial Reporting Standards (IFRS), though it is permitted in the United States by Generally Accepted Accounting Principles (GAAP). Therefore, only US traders can apply this method. Those who cannot trade LIFO can use an alternative by setting two different accounts for the same stock, one for the long term and one for short-term trading.
Warning: The TA chart must be updated frequently to be relevant. It is what I am doing in my stock tracker. The chart above has a possible validity of about a week. Remember, the TA chart is a tool only to help you adopt the right strategy. It is not a way to foresee the future. No one and nothing can.
Author’s note: If you find value in this article and would like to encourage such continued efforts, please click the “Like” button below as a vote of support. Thanks.
Be the first to comment