

S&P 500 PRICE OUTLOOK: STOCK MARKET BOLSTERED BY VOLATILITY COMPRESSION, BUT VIX INDEX FUTURES SIGNAL FEAR STILL LINGERS
- S&P 500 price outlook has improved while cross-asset volatility benchmarks normalize from financial crisis highs
- VIX Index remains pressured as market complacency builds on the back of FOMC liquidity and fiscal stimulus measures
- VIX term structure suggests extreme fear still lingers and that the stock market recovery remains in jeopardy
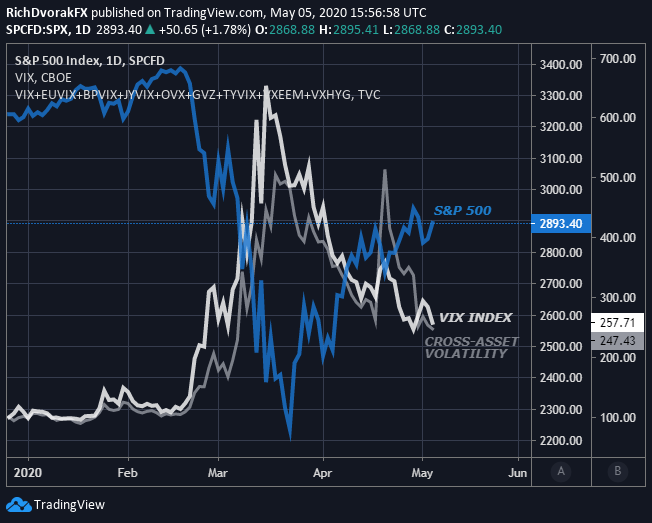
The S&P 500 has rebounded more than 30% since the popular stock market index bottomed on March 23. Stocks recovered sharply following a series of unparalleled efforts from global governments and central banks – like unlimited QE from the Fed and $2.3 trillion coronavirus stimulus bill from US Congress. A retracement lower in measures of volatility, such as the S&P 500 VIX Index, likely encouraged the improvement in trader sentiment as well.
| Change in | Longs | Shorts | OI |
| Daily | -8% | 4% | 1% |
| Weekly | 1% | 9% | 7% |
S&P 500 PRICE OUTLOOK BRIGHTENED AS VIX INDEX, CROSS-ASSET VOLATILITY RECEDED
Chart created by @RichDvorakFX with TradingView
Generally speaking, there is a strong inverse relationship observed among the direction of risk assets, like stocks, and level of market volatility. This is indicated by the negative correlation typically held between S&P 500 price action and the VIX Index.

Recommended by Rich Dvorak
Traits of Successful Traders
An influx of coronavirus optimism since mid-March, though supportive of the S&P 500, has largely kept the VIX Index and several cross-asset volatility benchmarks under pressure. The retracement lower in market volatility over recent weeks might seem encouraging on the surface, but VIX Index term structure indicates that investor uncertainty remains extremely high, and leaves the stock market rally in jeopardy, even as spot VIX falls.
VIX INDEX TERM STRUCTURE SHOWS EXTREME UNCERTAINTY STILL LINGERS AMID CORONAVIRUS RECESSION RISK, REINTRODUCED US-CHINA TRADE WAR UNCERTAINTY
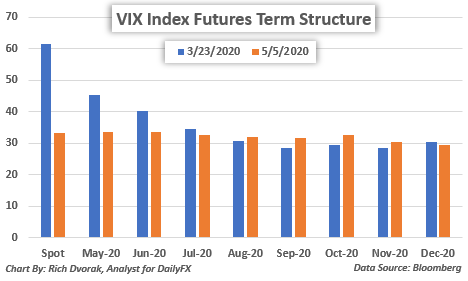
Just like the normalization of past volatility cycles, the VIX Index has gravitated back lower toward its historical mean after exploding higher earlier this year. While the VIX Index may have pulled back from its strongest level since the global financial crisis, the popular fear-gauge suggests extreme fear and uncertainty still lurk on the horizon.
VIX term structure illustrates how stock market volatility expected later on in the year continues to hang around alarming levels. Also, VIX Index futures settling this August, September, October and November trade higher today relative to their March 23 close when the stock market bottomed. Moreover, the VIX looks roughly anchored to 30% across the curve. This is notably above the long-term average of about 19%.
Recommended by Rich Dvorak
Get Your Free Top Trading Opportunities Forecast
S&P 500 price outlook nevertheless appears at risk of souring abruptly again in light of ‘sticky’ volatility readings, as well as in consideration of the likely unavoidable coronavirus recession. Stocks also face fresh headwinds from reintroduced US-China trade war uncertainty while Trump talks tariffs. That said, keeping close tabs on VIX term structure, in addition to cross-asset volatility benchmarks, like crude oil volatility, could provide investors with valuable insight as to where the broader stock market might head next.
Keep Reading – Stock Market Forecast: Should I Sell in May and Go Away?
— Written by Rich Dvorak, Analyst for DailyFX.com
Connect with @RichDvorakFX on Twitter for real-time market insight
Be the first to comment