

BeyondImages/E+ via Getty Images
There are a number of benefits to equal-weighted portfolios, and many of us equally weight our own holdings to reduce the risk from any single position disproportionally hurting our overall returns. Market weighting advocates might argue that the biggest and best companies rise to the top, have the widest moats, and offer the most stability and liquidity, and of course there is some truth to that. However, smaller companies often have more room to grow, can sustain higher dividend growth rates, and are not as prone to political or regulatory risk as the largest components of each sector. Plus some sectors like utilities and tech have a wide gulf in market caps between their largest company or two and the rest, resulting in one or two companies heavily influencing the returns of a “diversified” exchange-traded fund (“ETF”) despite its holding dozens of stocks.
Given all of this, it is surprising there are so few equal weight ETFs, and that those that do exist have relatively low popularity compared to their market-weighted peers. So, today I’d like to shed a light on the Invesco S&P 500 Equal Weight Utilities ETF (NYSEARCA:RYU), which offers investors a useful alternative to the leading market weight utilities ETF, XLU.
What You Get, And What You Don’t
First let’s zoom out for an overview of RYU’s industry and market cap allocations within the broader utilities sector:
RYU Subsector Allocations (Invesco)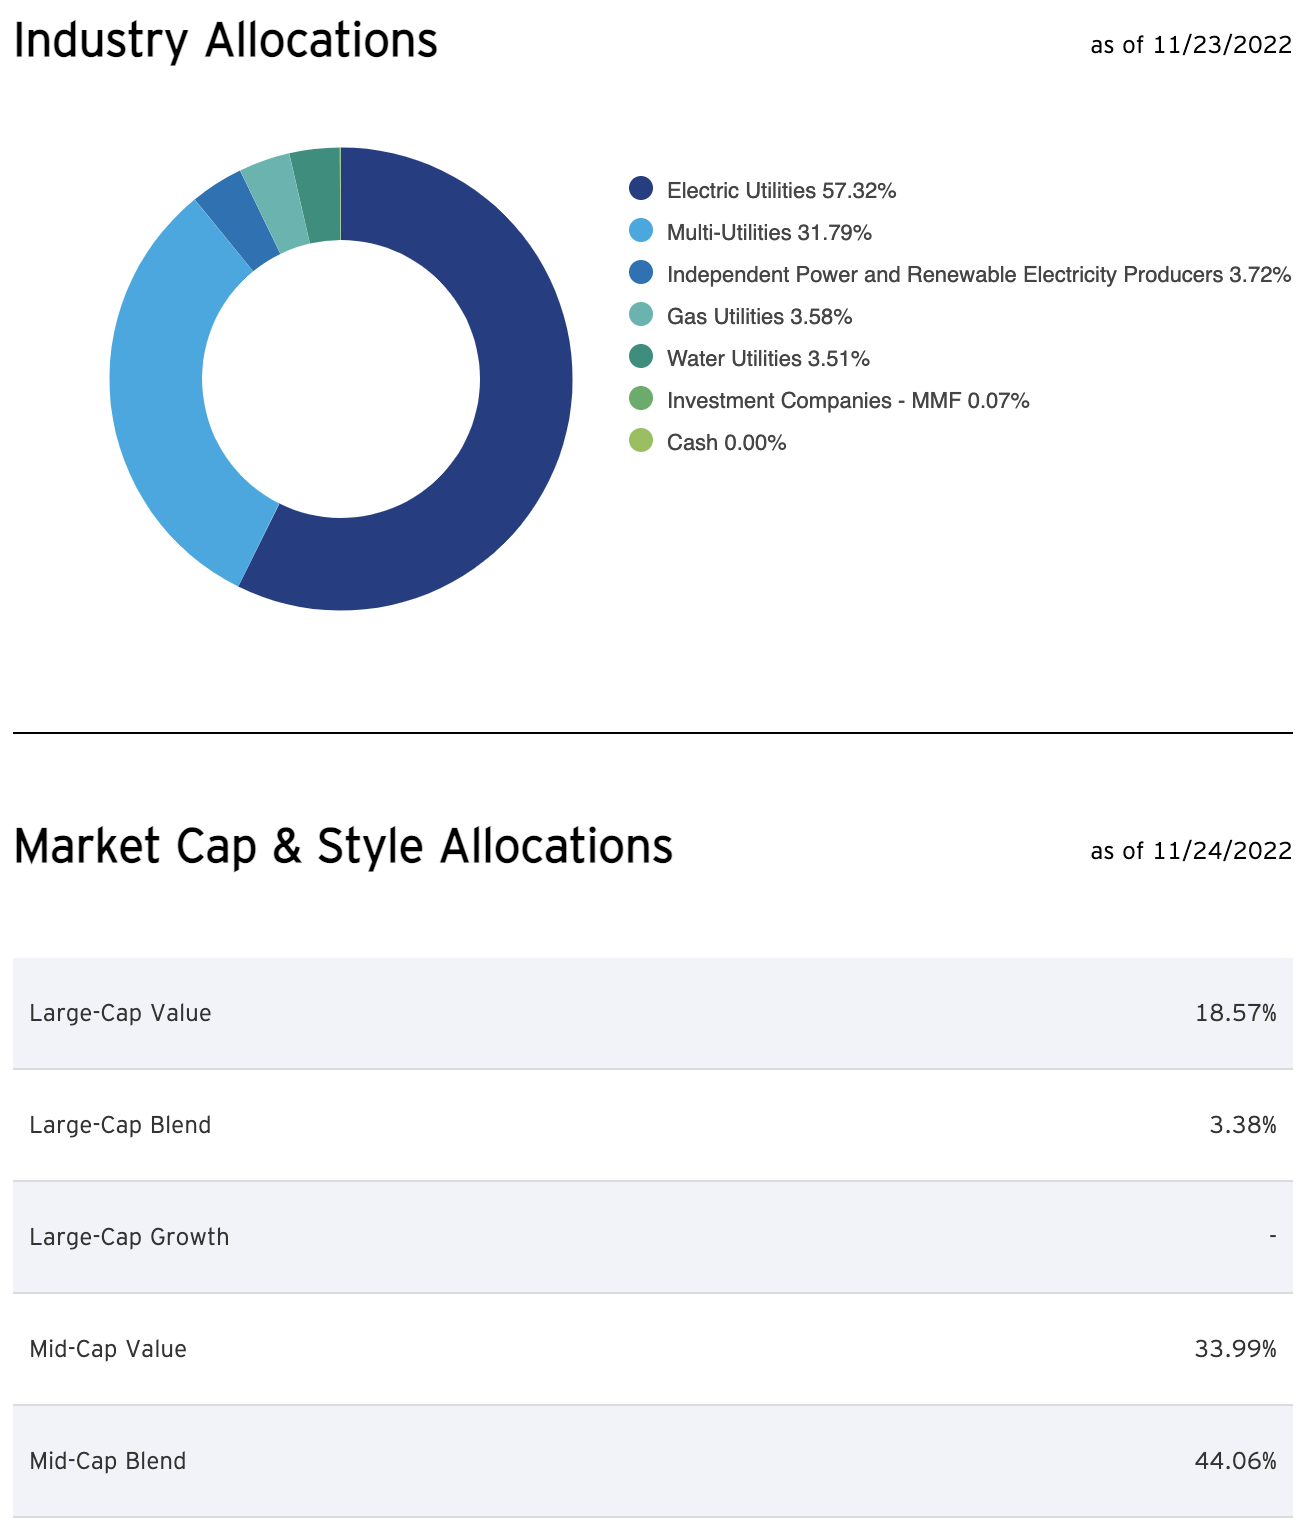
We see that RYU can mostly be considered a mid-cap value fund with some large cap exposure and no small caps or growth stocks. As we’ll see below, its equal weighting gives it less of a large-cap concentration than XLU and other market-weighted peers like VPU, and likewise we can assume that it will also offer more exposure to XLU’s smaller index constituents such as pure play water and gas utilities. However, at around 3.5% each, those stocks are not given much overall weight in RYU’s index allocation either.
At 31.8% of RYU’s index, the multi-utilities category provides ample natural gas exposure, but the lack of water utility exposure is something that many investors find frustrating about utility sector ETFs in general. Aside from its only water holding American Water Works Company, Inc. (AWK), most water utilities are smaller in size and fairly localized, so they don’t make the market cap cutoff for sector ETF inclusion. Waste removal stocks are unfortunately also not included in utilities indexes, as they are not considered utilities but rather are classified as commercial services in the industrials sector.
This is unfortunate from a risk-adjusted return perspective, because while water utilities and trash companies typically pay lower dividends than their electric and gas utility peers, many have higher dividend growth rates, longer dividend growth records, and offer lower volatility and higher long-term revenue growth rates with somewhat less environmental and regulatory risk. Hopefully someday we might get a trash-plus-utilities ETF that offers the best of all market caps and utility types (and if this exists already, please let me know in the comments!), but until then our utility ETF, water ETF, and environmental services ETF kids will have to play in different pools.
Risks of Market Weighting
RYU and XLU make for an ideal comparison because they have the same index components but use different weighting methodologies — in other words, they hold the exact same 30 stocks. We know that RYU weights each stock equally when it rebalances its holdings annually which results in a starting weight of 3.33% for each position, so let’s start by looking at its current weightings against XLU’s to see how they compare. I’ve highlighted where RYU has more (green) or less (red) exposure than XLU to each company.
RYU & XLU Holdings (Author)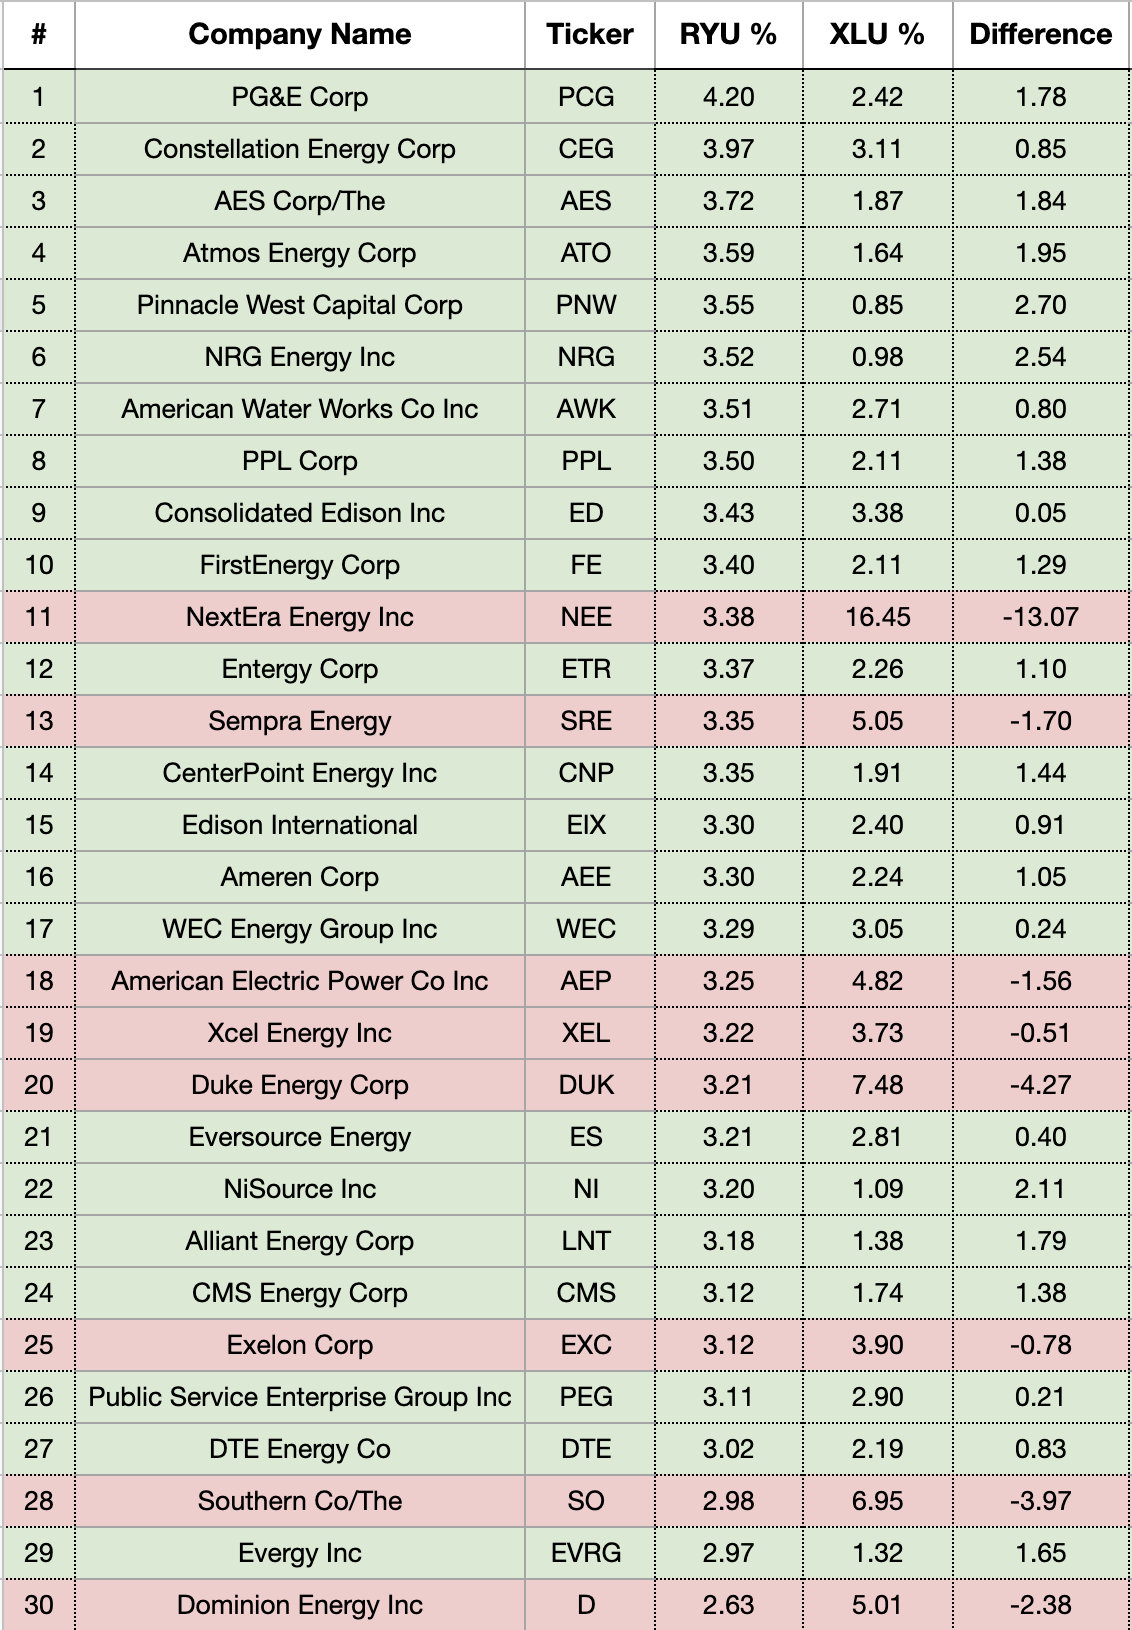
The first thing I notice above that the two Florida-based utilities, NextEra (NEE) and Duke (DUK) comprise a massive 24% of XLU’s index. Even though NEE’s unregulated renewables business is widely spread out across the U.S. and Canada, its regulated utility business remains in Florida, and together with Duke gives XLU quite a lot of exposure to Florida, which obviously entails a high degree of long-term climate risk and a fair amount of political risk as well, given Governor Ron DeSantis’s mercurial position on solar energy and his willingness to go after “woke” companies like Disney (DIS) for political gain. Of course, NEE has historically been the fastest-growing utility in the country with the largest renewables footprint in the world, so the lower NEE exposure could also be seen as a drawback for RYU.
The second thing that strikes me is that XLU has greater exposure than RYU to a few companies that I view as lower quality in the sector, either because they are in relatively poor financial shape like Dominion (D) or because they have low or inconsistent dividend growth profiles like Duke and Exelon (EXC), respectively. I like that with RYU, the equal weighting provides for a truer average of both the quality and dividend profiles of its holdings, however, in practical terms this mostly matters in terms of those companies’ share performance, because RYU’s dividend history itself is quite inconsistent, with no current dividend growth record versus XLU’s 11-year streak.
RYU Dividend History (Seeking Alpha)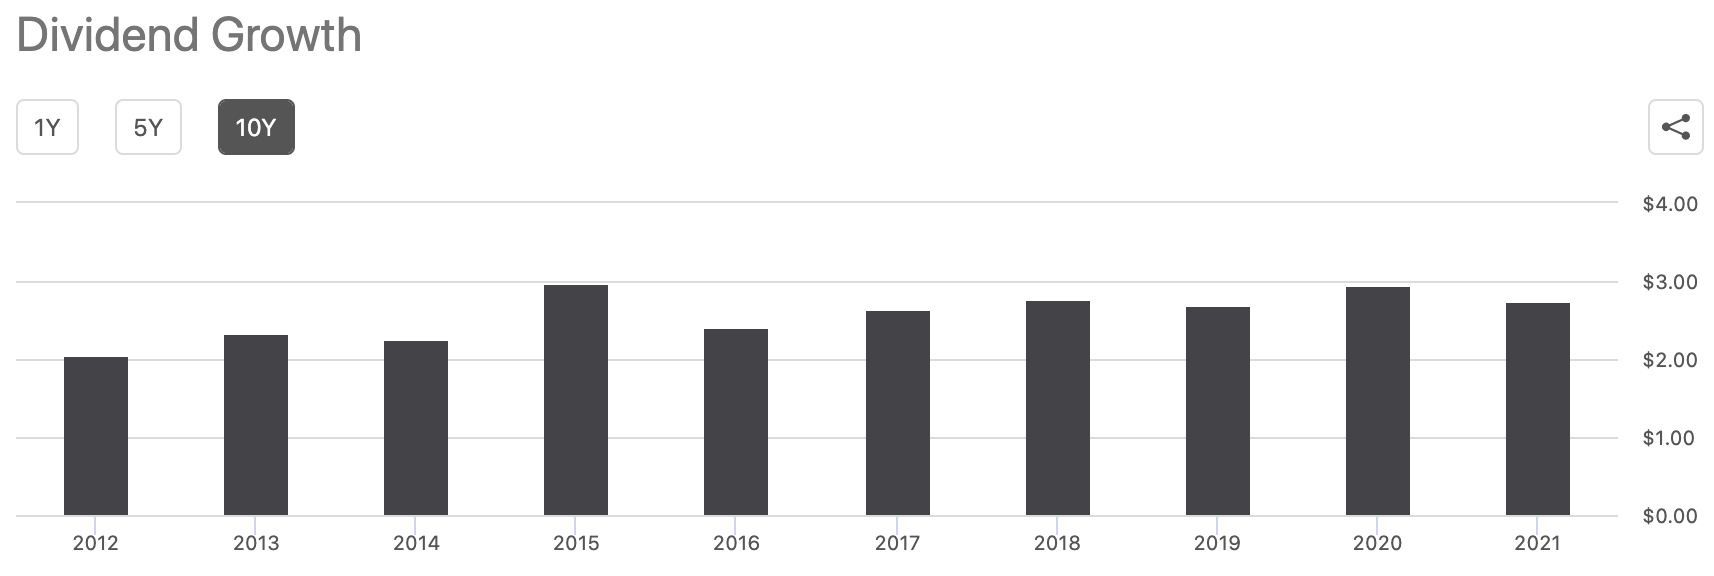
Benefits of Equal Weighting
Looking at the holdings above, another thing that stands out is that RYU offers more exposure than XLU to a vast majority of the 30 stocks in the index — 22 of 30, to be exact. If this seems obvious, it might be a sign that we as investors sometimes take for granted the heavily lopsided weighting methodologies that many market-weighted indexes utilize. For each index, it’s good to remember that at some point a human (or their software program, or dartboard) decided how large the largest index component could be, so we are right to be critical of weighting schemes that seem sub-optimal for fully representing a sector or that unnecessarily expose retail investors to a high degree of single-company risk.
One reason I like equal-weight ETFs in general is that they’re great for when you want to invest in a sector quickly, whether for a time-sensitive swing trade or simply because you don’t have the time or desire to research several ETFs and their top 10 holdings. You know that you’re not getting outsized exposure to any one company and that you’ll get a solid average return from the movement of the sector, even if it underperforms its market-weighted peers in the meantime. If I’m hoping to capture a sector rebound, the last thing I want is for one stock like NEE to have a bad week or month and hurt my potential returns.
Another benefit is that you can take one look at an equal weight ETF like RYU and know how each of its stocks have performed year-to-date, or at least since the ETF’s most recent rebalancing date. It’s instantly helpful to see that the top 10 holdings are also the best-performing holdings and vice-versa for the bottom holdings, and although the weightings don’t vary wildly between the top and bottom, it’s nice to know from a momentum perspective that, as the year goes on, you will have slightly higher exposure to the stocks that have recently been performing well such as PCG, which has had excellent YTD returns, and slightly less exposure to stocks that have been performing worse such as Dominion.
Historical Performance
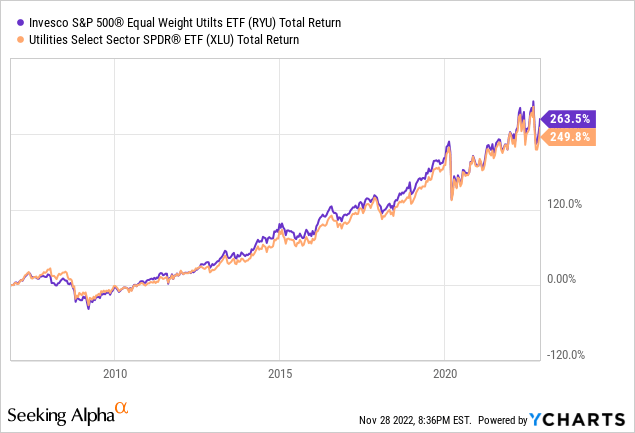
Despite RYU’s higher net expense ratio of 0.40% versus XLU’s 0.10%, its lower exposure to NEE’s outsized historical gains, and its spottier dividend record, RYU has actually outperformed XLU by 14% in total returns since its inception:
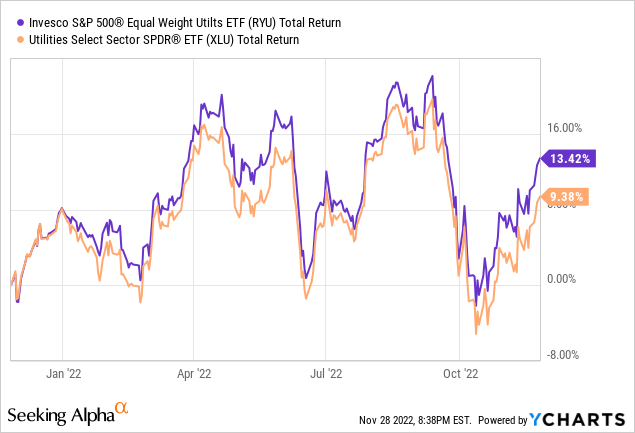
On a one-year basis, however, its outperformance has been slightly more pronounced, likely due to its lower exposure to the large-cap utility stocks that have been underperforming the sector in the face of rate hikes such as D, DUK, and lower-yielding NEE:
Lastly, while I mentioned swing trading as one use case for equal-weighted ETFs, it’s important to keep in mind that RYU is a much smaller fund at ~$400MM in assets compared to XLU’s $15.5B, so its liquidity is lower and its trading spreads are typically wider. This won’t be a major issue for most investors, and my own experience has been that execution tends to be close to the spot price. However, for larger purchases it’s important to know that XLU’s bid/ask spreads are often within 1-2 cents of each other, whereas RYU’s can be 5-20 cents apart depending on its volume.
Conclusion
RYU may have several drawbacks compared to its larger market-weighted counterparts, but its equal weight methodology provides several advantages as well, and on the whole it has not only kept pace with XLU but has outperformed it both since RYU’s inception and over the past year.
I currently rate RYU a hold due to its recent rebound and an uncertain outlook from the Fed regarding the length that interest rates, and thus Treasury yields, might be held higher in order to tame inflation. That said, Invesco S&P 500 Equal Weight Utilities ETF remains a wonderful ETF both for shorter-term swing trades and long-term holding for investors who are willing to trade consistently rising dividends and higher liquidity for more equal exposure to the stocks in the S&P 500 utility index.
Be the first to comment