

Lemon_tm/iStock via Getty Images
Written by Nick Ackerman, co-produced by Stanford Chemist. This article was originally published to members of the CEF/ETF Income Laboratory on March 16th, 2022.
Cohen & Steers REIT & Preferred Income Fund (NYSE:RNP) is a basket of preferred stocks and real estate investment trusts (REITs), making it an excellent fit for a solid income play. RNP is attractively priced at the same time, as 2022 hasn’t been too kind to most investments and the closed-end fund discount/premium mechanic. Investors in RNP did start this year off on a bright note with an increase in their monthly distribution level.
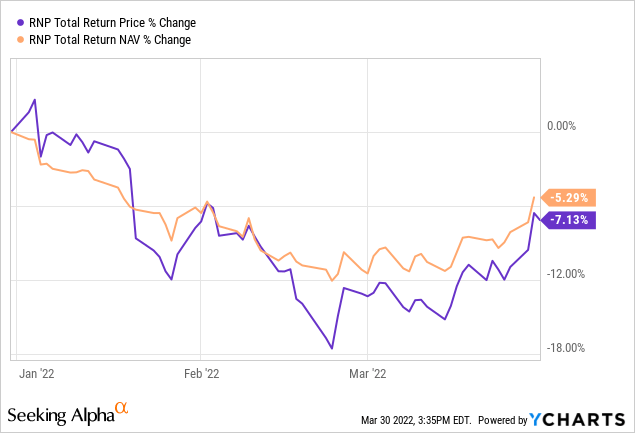
RNP’s discount has widened to a reasonably attractive level relative to where it was trading over the last year. Over the longer term, the discount isn’t nearly as attractive as the average. However, I think the overall market declines should also be considered when evaluating the trading level. When considering both of those, the fund is more attractively priced than it was just a few short months ago. More recently, a rather strong rebounding market has pushed the fund up sharply in the last few days. A volatile market can make great deals turn into just good deals quite quickly.
A significant factor for RNP is that higher rates could negatively impact the fund since the fund is half preferred. It is also a leveraged fund, which means higher rates could boost their borrowing costs – but not significantly right away.
The managers at Cohen & Steers had moved to mitigate the impact of higher rates. They had done this by changing a majority of their leverage to fixed-rate financing. At the end of 2021, they had a weighted average term on the fixed financing sleeve of 4.6 years. That should see the impact for RNP negated relatively speaking.
RNP Leverage Info (Cohen & Steers)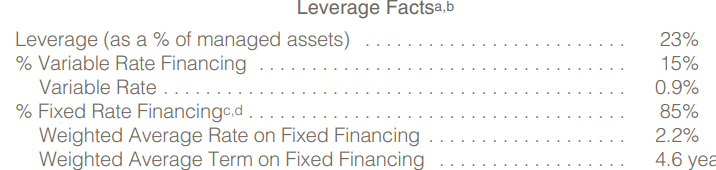
The Basics
- 1-Year Z-score: -0.61
- Discount: -3.48%
- Distribution Yield: 6.20%
- Expense Ratio: 1.04%
- Leverage: 26.88%
- Managed Assets: $1.7 billion
- Structure: Perpetual
RNP’s objective is “high current income” and a secondary objective of “capital appreciation.” To achieve this, they invest just as their name would suggest; “investment in real estate and diversified preferred securities.” They will invest in both U.S. and global positions. Most of the portfolio has been held in the U.S. or North American investments.
However, some European exposure has been showing up at the end of 2021. Perhaps at a bad time as Russia invaded Ukraine. That has undoubtedly led to some increasing risks in that region of the world.
The fund is quite large, which could help explain the lower expense ratio relative to other CEFs. The fund’s expense ratio comes to 1.78% when including leverage expenses. As we touched on above, with most of their leverage at a fixed rate, this shouldn’t move too materially higher over the next few years.
The leverage itself should still be a consideration before investing. At the current level, it doesn’t seem to be too excessive considering the sleeve of preferred shares, but that still does mean greater risks. This fund wouldn’t be appropriate for conservative investors.
Performance – Long-Term Solid Results
RNP might be having a weak start to 2022 – as most investments have, but over the longer term, they have delivered for investors.
Cohen & Steers Annualized Returns (Cohen & Steers)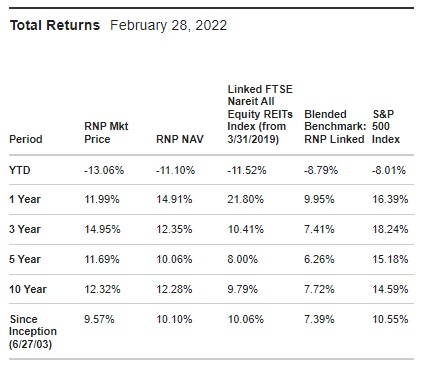
Against the FTSE Nareit All Equity REITs Index, the fund has done a fairly good job at outperforming over the longer term. That is a bit surprising considering the preferred sleeve of the portfolio.
That’s where the blended benchmark RNP-linked returns come in as a more comparable figure. It is taking 50% of the FTSE Nareit All Equity REITs Index and 50% of the ICE BofA Fixed Rate Preferred Securities Index. In that case, they’ve outperformed on every time frame except for the YTD. With the YTD, we are seeing the ugly side of leverage play out.
Since the YTD share price performance has been dropping further than the NAV, we get the widening discount which is one of the strong selling points of RNP at this time. The average discount over the last year came to just 2.26%. The fund even flirted with a premium ever so briefly on a few occasions over the last year. This puts the current discount at a 1-year z-score of -0.61, which still represents a fairly attractive entry level.
That being said, it would also be fair to point out the longer-term average of the fund. Over the last ten years, the fund’s discount has been significantly wider for a rather lengthy period of time.
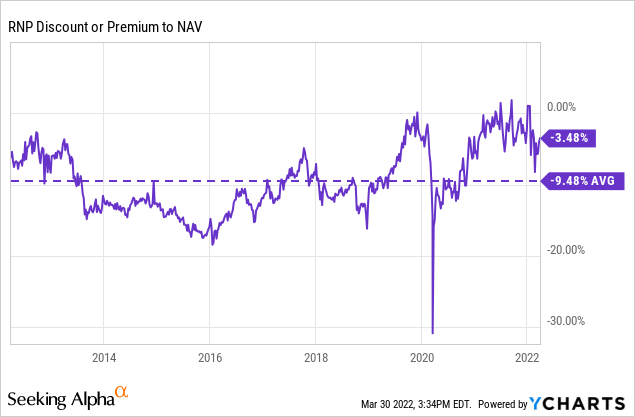
I believe it should also be pointed out that during the really low periods of around 2014 to 2016, they were paying out a quarterly distribution. We’ve seen funds that pay out monthly distributions generally receive more attention from investors. After all, who doesn’t want their paychecks more frequently?
Distribution – Boost To Start Off 2022
Speaking of distribution, investors received a boost to start off the year – a bright spot in what is turning out to be a rather bleak year. This distribution boost had been the first one since it was a quarterly payer.
In fact, the monthly equivalent distribution would have been $0.372 when they were paying out $0.37. So it was a small increase when they switched back to a monthly distribution; however, it hadn’t truly been a substantially meaningful boost since around the start of 2015.
RNP Distribution History (CEFConnect)
At the same time, I believe that the distribution yield is still well within a reasonable and sustainable level, even after the latest market declines. The distribution rate comes to 6.20%. The NAV distribution level comes to 5.98%.
For their distribution, they will rely on a fairly large portion of capital gains. Their REIT portfolio isn’t really full of the higher yielders in the space. Instead, they are focusing on holdings REITs with more growth as a focus, in my opinion.
Over the last year, we have also seen a decline in net investment income year-over-year. This will be something to watch going forward, but I don’t think it necessarily means we should see a cut anytime soon either. When they raised their distribution, I’m sure this was factored in. NII coverage for fiscal 2021 came in at almost 49%.
RNP Annual Report (Cohen & Steers)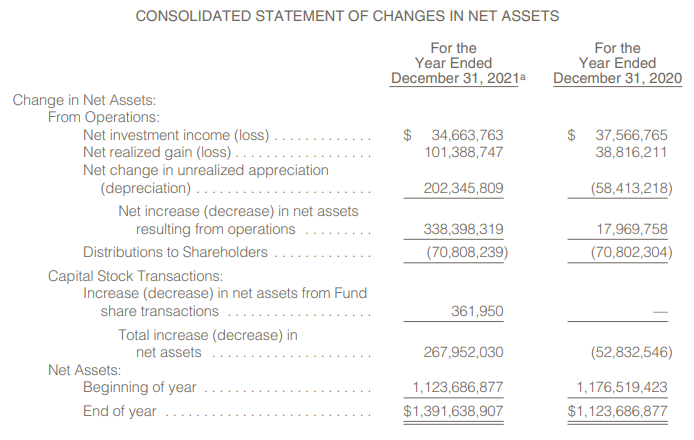
In terms of tax purposes in 2021, the fund reported classifications mostly as we should expect. The largest portion was classified as capital gain distributions, and the rest was qualified dividend income. Preferred and REITs dividends are often classified as qualified. That could make this fund a fairly strong fit for a taxable portfolio if you have other, less tax-friendly holdings you can put into a tax-sheltered account.
RNP Tax Classifications (Cohen & Steers)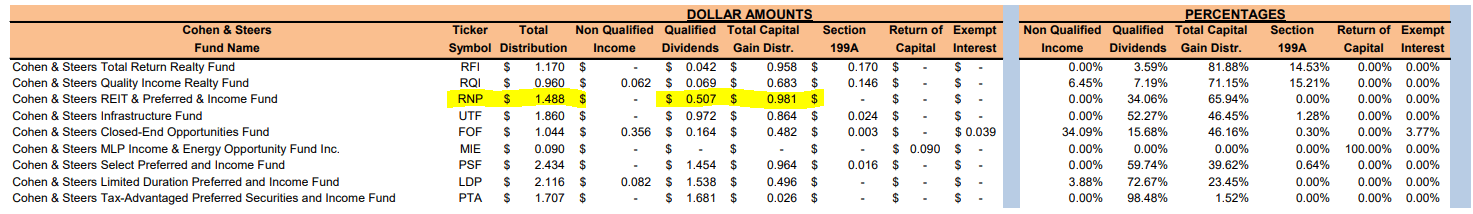
RNP’s Portfolio
RNP’s managers can be fairly active; last year, the fund reported a turnover rate of 40%. It came in at 57% and 53% in the two previous years. Those two prior years were the most active.
What stays relatively similar is the actual breakdown of the portfolio in terms of sector diversification. Even the geographic diversification hasn’t changed too much, besides more European exposure. At the end of 2021, equity was the largest asset in the fund. The fixed-income sleeve followed rather closely, where they lumped together preferred and capital securities.
RNP Sector Diversification (Cohen & Steers)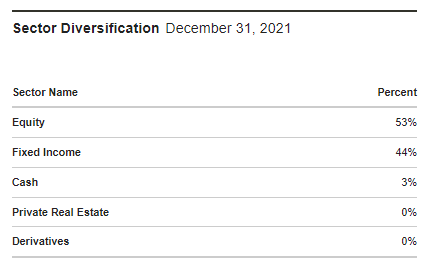
This was only a small shift from the end of June 2021, equity at that time accounted for 52% of the fund, and fixed income was 46%.
We also see an immaterial shift in geographic diversification from the middle of 2021 as well. U.S. exposure was at 54% previously, North America was 30%, and Europe was the same at 12%.
RNP Geographic Allocation (Cohen & Steers)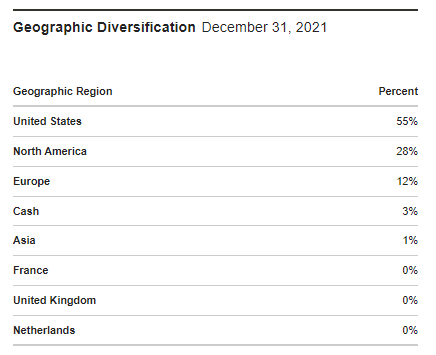
What we also see in RNP is that sector diversification often puts banking and insurance as the largest exposure for the preferred sleeve. This is often the case as these financial institutions are a large issuer of preferred debt. When looking at other preferred funds, this is also the case and isn’t anything unusual. In the REIT portfolio, we have infrastructure, healthcare and industrials once again come in as the largest exposures. However, industrials have increased enough to take over in the number two spot of weighting.
RNP Sector Diversification (Cohen & Steers)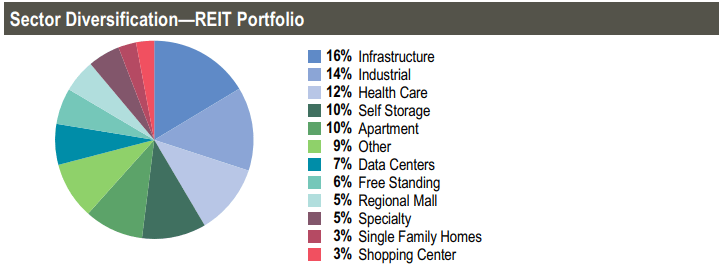
Unfortunately, Cohen & Steers is always slow to update their holdings. They only seemingly update quarterly instead of monthly that some other fund sponsors provide. With that caveat, here were the largest holdings at the end of December 2021.
These ten largest holdings make up 29.4% of the fund’s portfolio. That was an increase from the 27.1% they had reported previously. That is quite substantial because CEFConnect puts the total number of holdings at 310. That would mean the top largest positions make up a disproportionately large allocation for the fund.
RNP Top Ten (Cohen & Steers)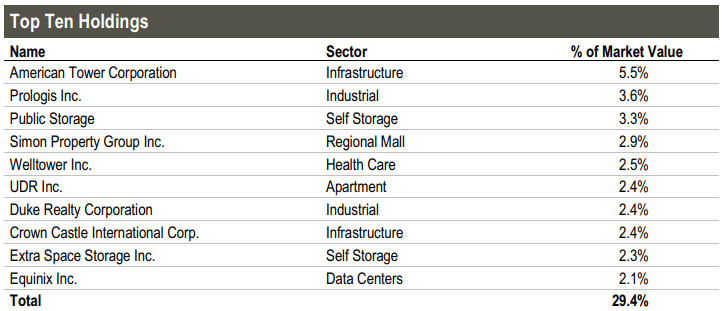
Once again, the largest position comes in as American Tower Corp. (AMT). AMT being the largest position goes back to at least the middle of 2019. Around that time, I covered RNP showing the position as the largest. In my first article on RNP, Prologis (PLD) was the largest holding – that article goes all the way back to 2018 when I first started writing on Seeking Alpha.
The weighting for AMT has increased quite substantially too, as it was previously 5%. Public Storage (PSA) had fallen to the third-largest position when it was once holding second place. The weighting for that holding even inched up a bit. PLD had a sizeable increase as the weighting previously was 2.7%. These top three positions increasing their weight contribute to why the top ten have become more concentrated overall.
At the end of 2021, RNP held 339,684 shares of AMT. At the end of September 30th, 2021, they reported carrying 306,938 shares. PLD share count did not move from 389,135 over the quarter. The share count also didn’t move from the 157,674 that RNP was carrying for PSA. That can help explain that despite the massive outperformance of PLD and PSA over AMT over the last six months, the weighting of AMT actually rose.
Since we are looking at six months here, we also see the performance around the first quarter of 2022. That wouldn’t have been reflected with RNP yet regarding what they are holding as of today. Again, to reiterate, they aren’t providing the most regular updates for investors. However, we can clearly see the performance of these three stocks relative to each other over Q4 in 2021.
YCharts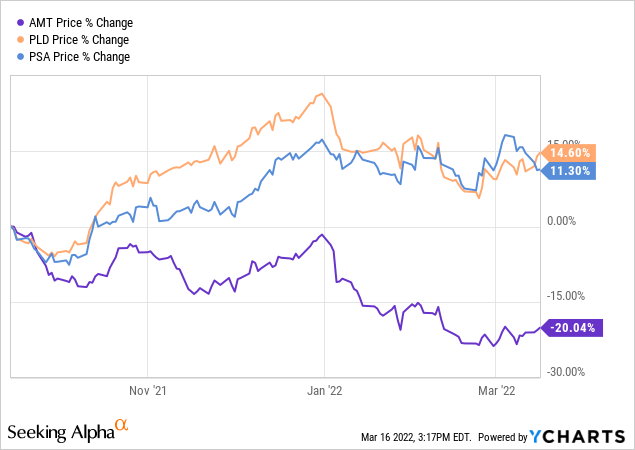
The substantial weighting bump over the quarter that we saw for PLD came directly from the fund’s large outperformance around the end of 2021. Since that time, the performance has become similar to PSA’s performance.
While we don’t want investments to go down, it seems that it is logical that the managers picked up more shares of AMT. The underlying fundamentals of the business are still sound, in my opinion. I provided more detailed thoughts relatively recently about AMT under the Cash Builder Opportunities profile.
Conclusion
RNP is a solid play here at the current valuation for long-term investors. The fund’s discount widening and the overall decline in the share price itself are presenting an opportunity. There are risks in the shorter term for the fund, but they are more mitigated with their mostly fixed-income borrowings. That means interest expenses shouldn’t climb out of control over the next four years.
At the same time, the underlying portfolio being in preferred investments could be under pressure. Even in that case, it isn’t all doom and gloom. A portion of their preferred is in fixed-to-floating rate securities. They don’t provide this specific metric, but all the holdings can be seen in their latest Annual Report. That should provide less interest rate risk over the medium term as floating rates can kick in, just in time when the fixed rate of borrowings starts to fall off.
Be the first to comment