

Hirurg/iStock via Getty Images
Thesis
In a recent article published on March 17, 2022, entitled “Annaly Capital: Still Attractive Among mREITs, But mREIT Itself Under Pressure,” I argued – correctly – why the yield spread will further shrink and pressure the mREIT (mortgage real estate investment trust) industry. But I then made a bullish call on Annaly Capital (NLY) anyway based on the following (my exact words quoted):
- … as a leader in the sector, Annaly offers a reasonable combination of scale, safety, and valuation relative to other peers.
- But investors need to be aware that the mREIT sector itself is under pressure with the start of a new macro credit cycle, and NLY has its own unique challenges in addition.
And, of course, you know what has happened since then. The yield curve indeed inverted and the profit of the mREIT sector (including NLY) was pressured. And NLY suffered a maximum drawdown of more than 18% since I argued for the bull thesis. Even as of today, NLY is still underwater by more than 9%. The only saving grace is that the S&P 500 index has also lost about the same amount since then.
It is a simple lesson: no one is safe on a sinking boat. Yet I just had to relearn it.
Source: Seeking Alpha data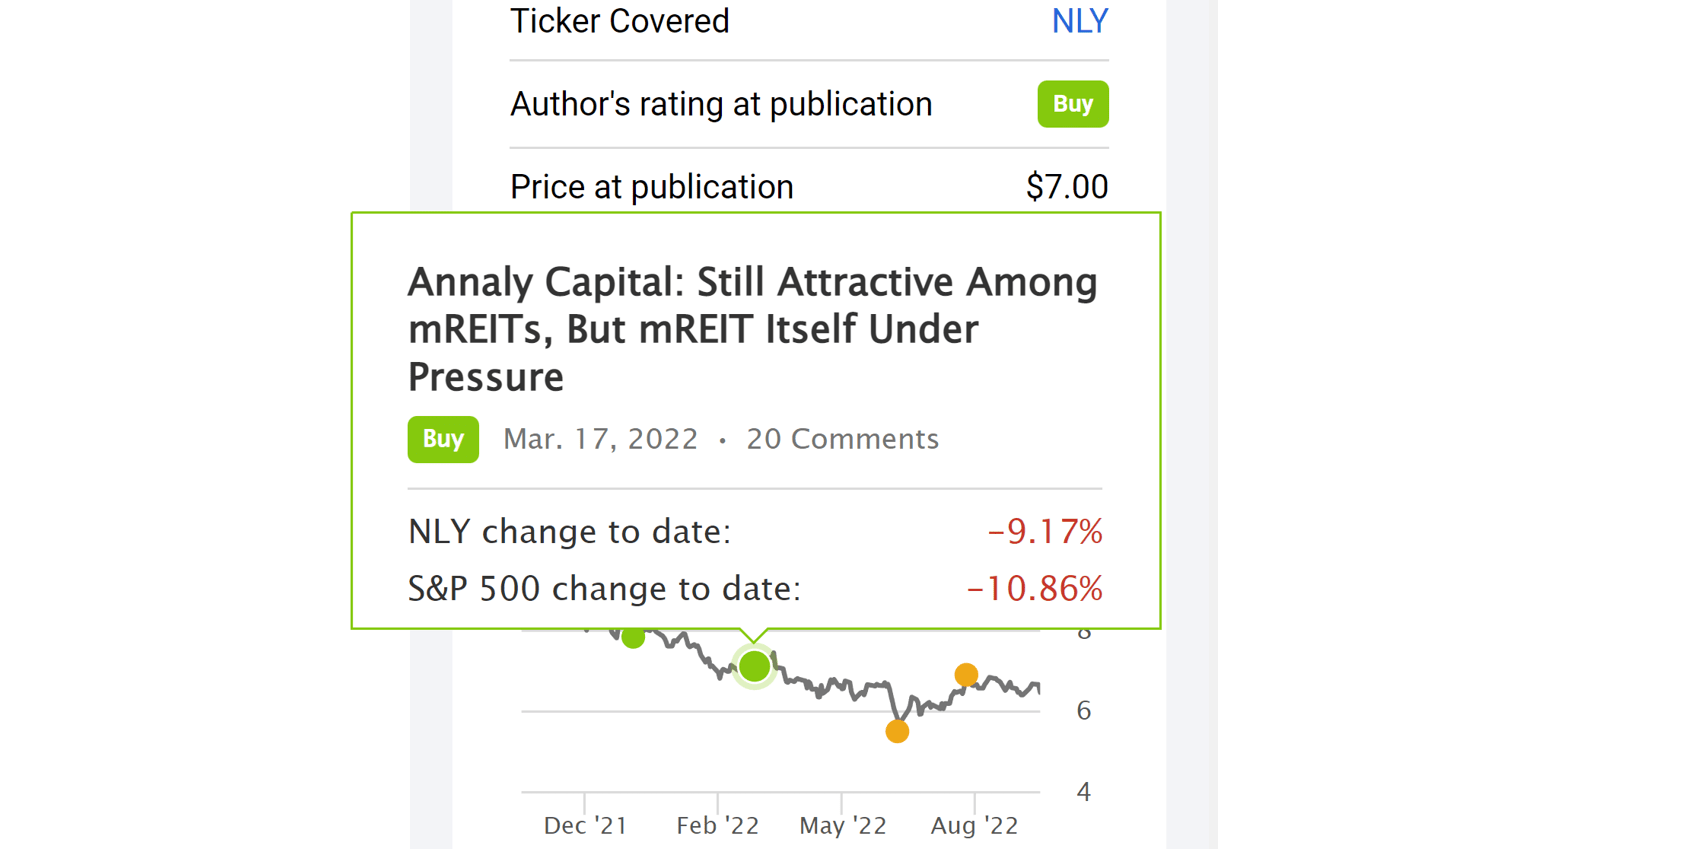
Looking forward, I see the mREIT sector suffering more pain for several fundamental reasons. And given that I’ve just relearned the above lesson, you will see why I am seeing two other leading mREIT stocks, Rithm Capital Corp. (NYSE:NYSE:RITM) and AGNC Investment Corp. (NASDAQ:NASDAQ:AGNC), in a similar situation. Both have been suffering substantial profit declines and also book value losses in recent quarters, as you can see from the figure below.
To wit, RITM has been earning on average $105M per quarter in recent years and its current quarterly earning is only $19.15 million. The picture for AGNC is even worse. Its average earning has been about $44 million per quarter. But currently, it is deep in the red, losing more than $434 million last quarter. At the same time, both stocks have been losing book value by a substantial amount also, as you can see in the bottom panel. We will elaborate on the implications later.
Furthermore, there are also other factors besides the inverted yield curve to keep pressuring profits and book value, as we will detail next.
Source: Seeking Alpha data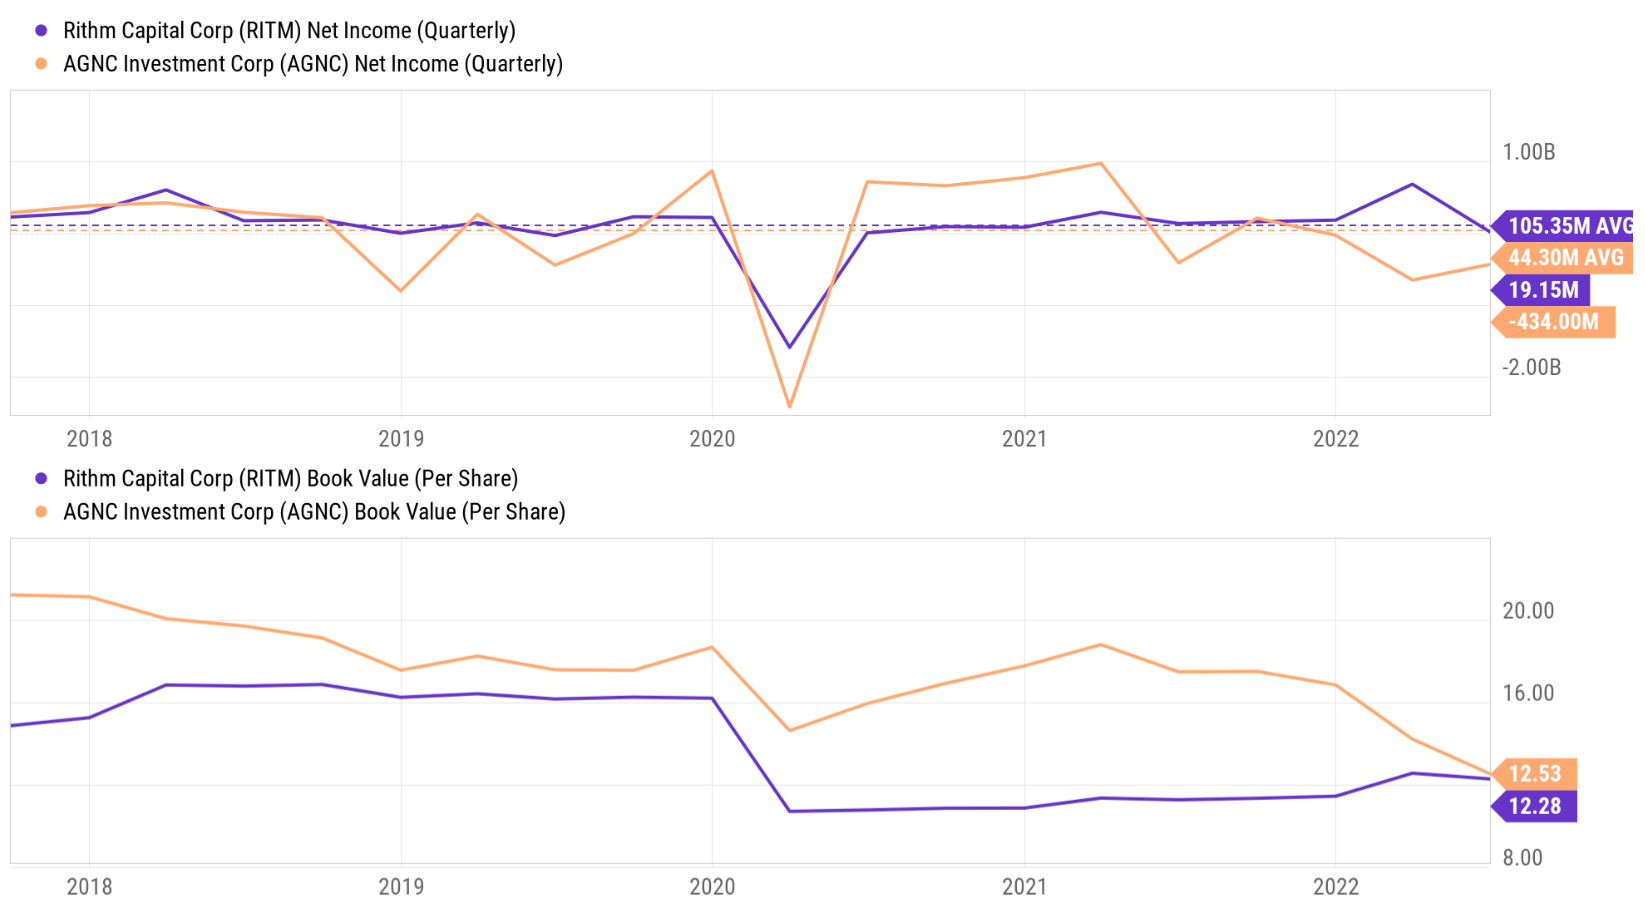
The dreaded yield curve inversion
The mREIT sector is one of the most sensitive sectors to the macro-credit cycle. My overall view of the mREIT sector has been detailed in my earlier articles. A brief recap is provided here to facilitate the rest of the discussion:
The yield spread between short-term debt instruments and long-term instruments is the most effective indicator of the credit cycle. When yield spreads expand or contract, it can signal changes in the underlying economy or financial markets. The mREIT stocks like AGNC are typically the ones that are most sensitive about such yield spread changes because they make money on the spread between the long-term and short-term rates. The thicker the spread, the easier and the more money they can make, as you can clearly see from the following chart.
The chart I was referring to was the following one. This shows how AGNC’s dividend payments, which are used to represent its profitability, change with yield spread over the credit macro-cycle.
Source: FRED and Seeking Alpha data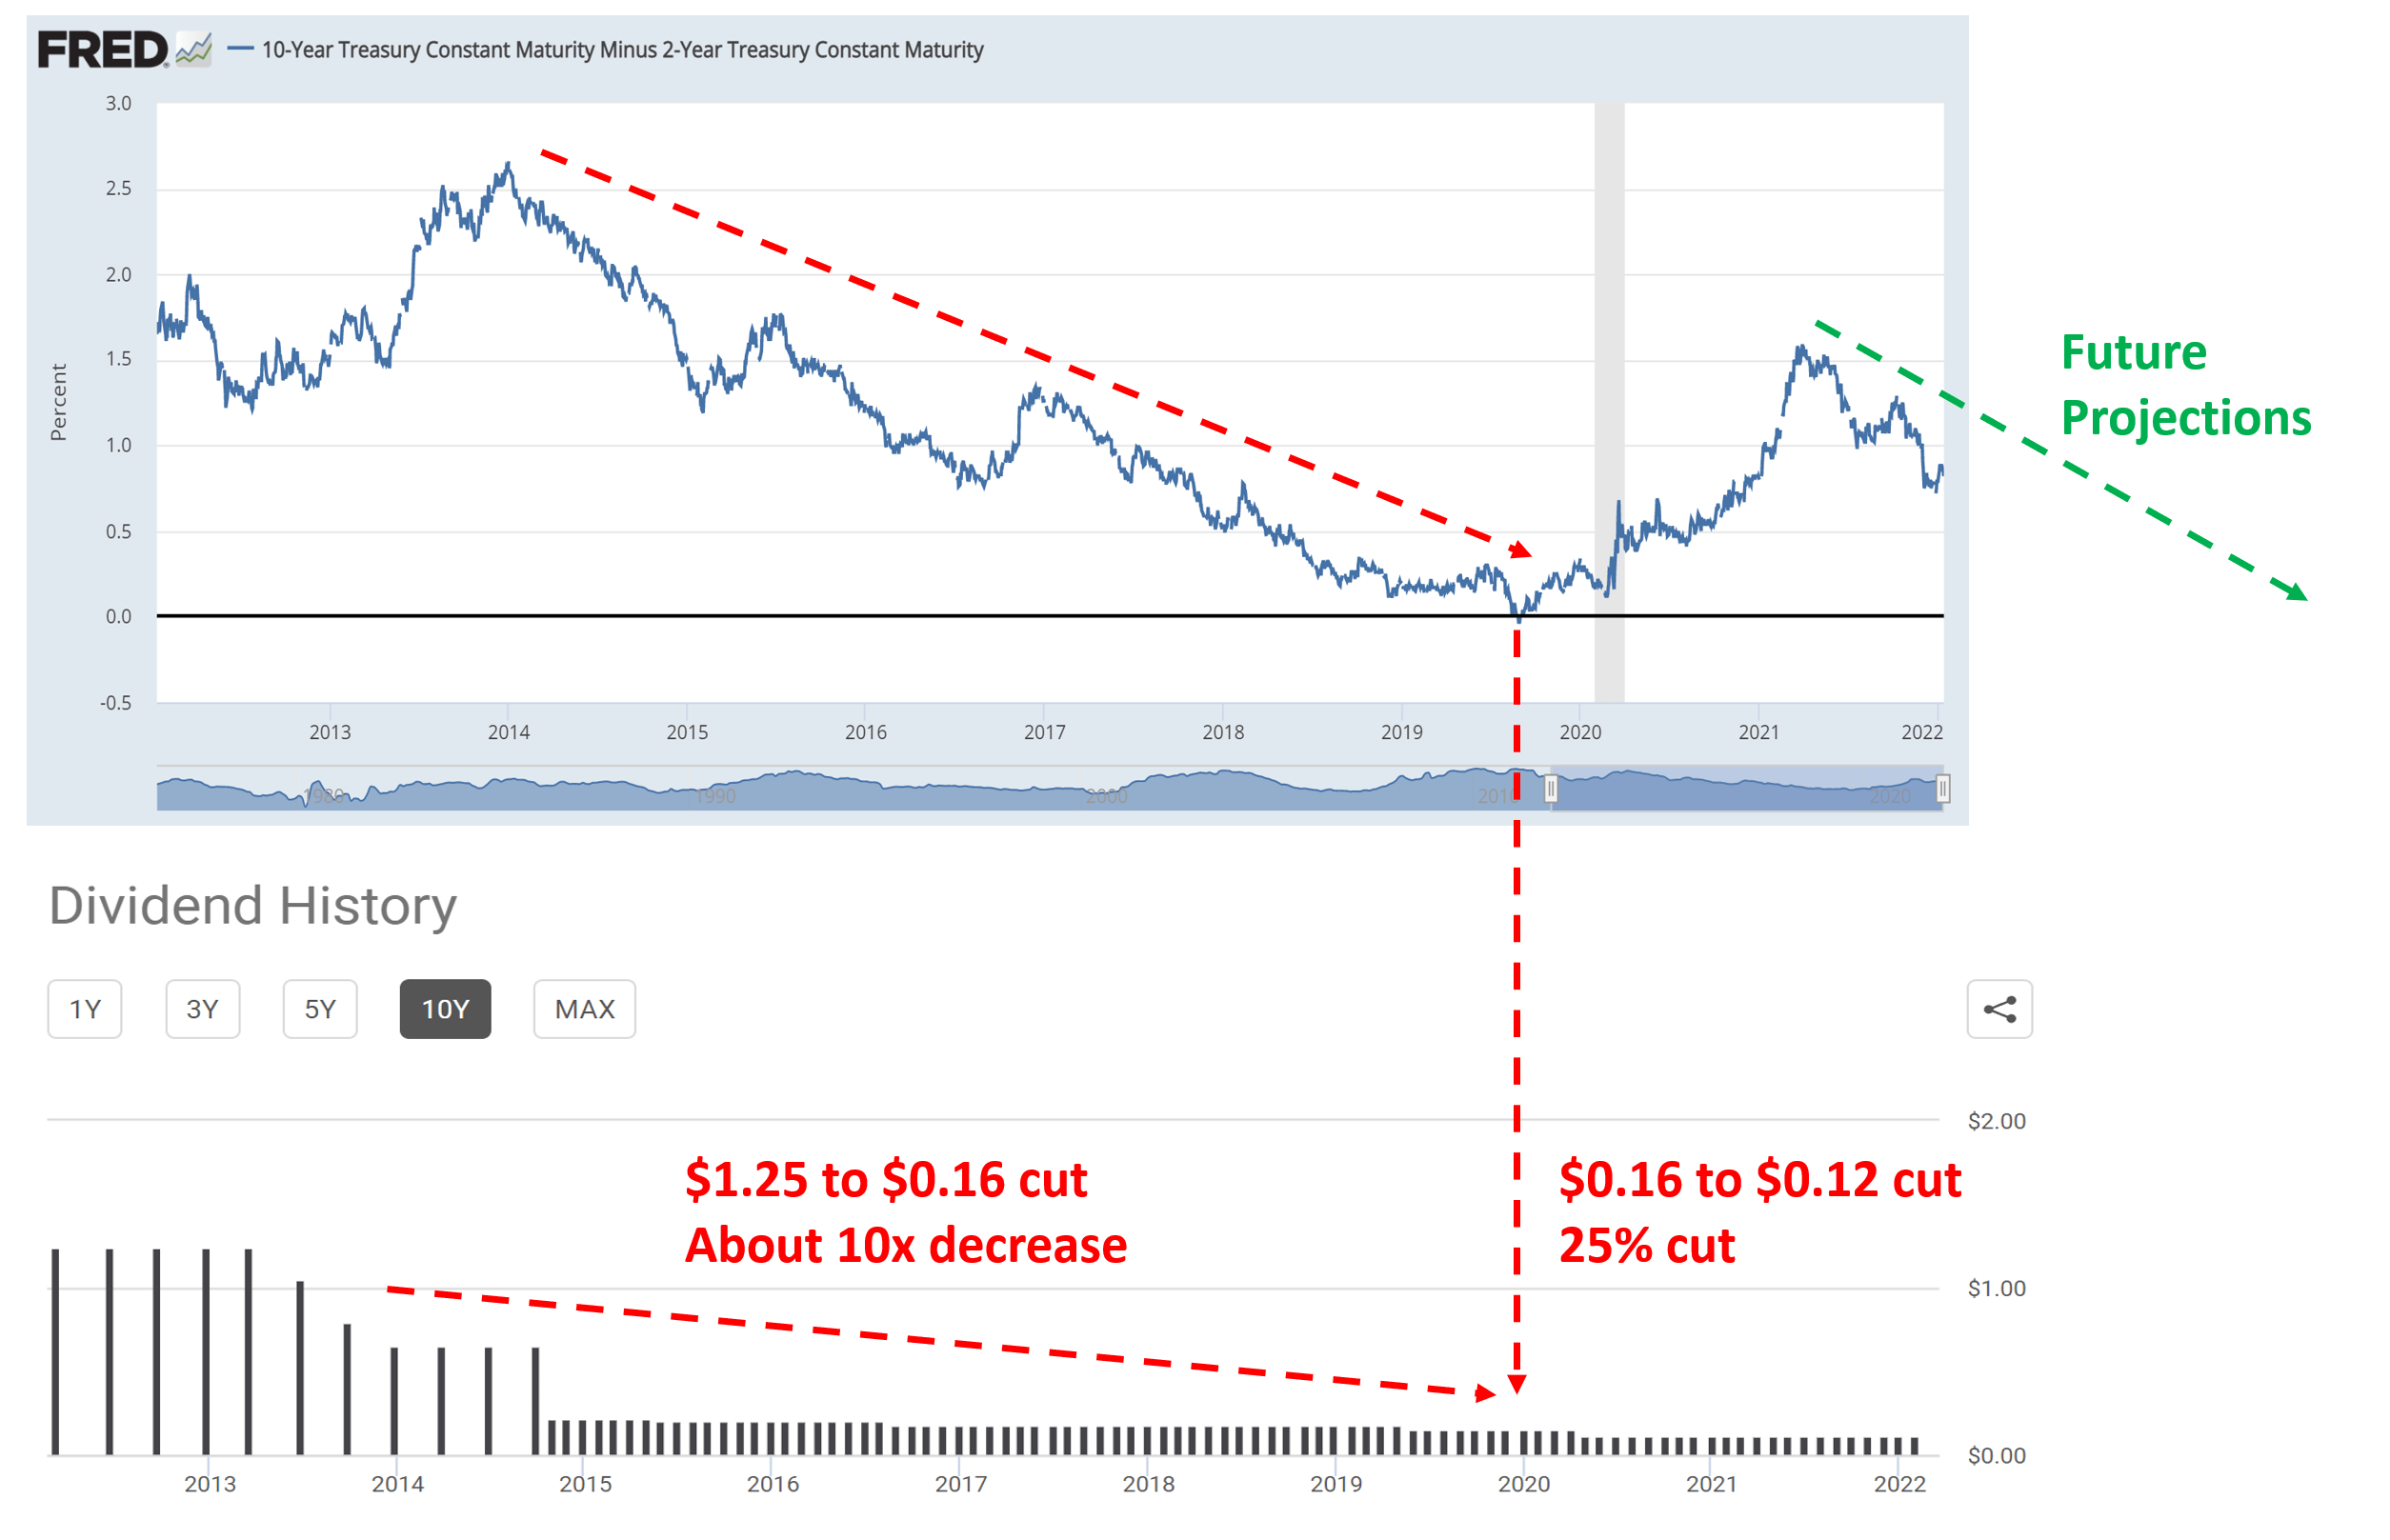
Now, unfortunately, the yield spread has changed in the wrong direction for mREITs since my earlier writing, as you can see in the chart below. At that time, the yield spread between 10-year and 2-year treasury rates was about 0.9%. Then the yield curve has briefly inverted in April 2022. Although the inversion was too brief to show up on this chart. Then the inversion occurred in earnest in early July shortly after the Fed announced its intention to continue its hawkish plan. The spread between 10-year treasury rates and 2-year treasury rates has remained negative since July 5, reached a bottom of almost -0.5% on August 8, and currently stands at -0.33% as of Sept 13.
Source: FRED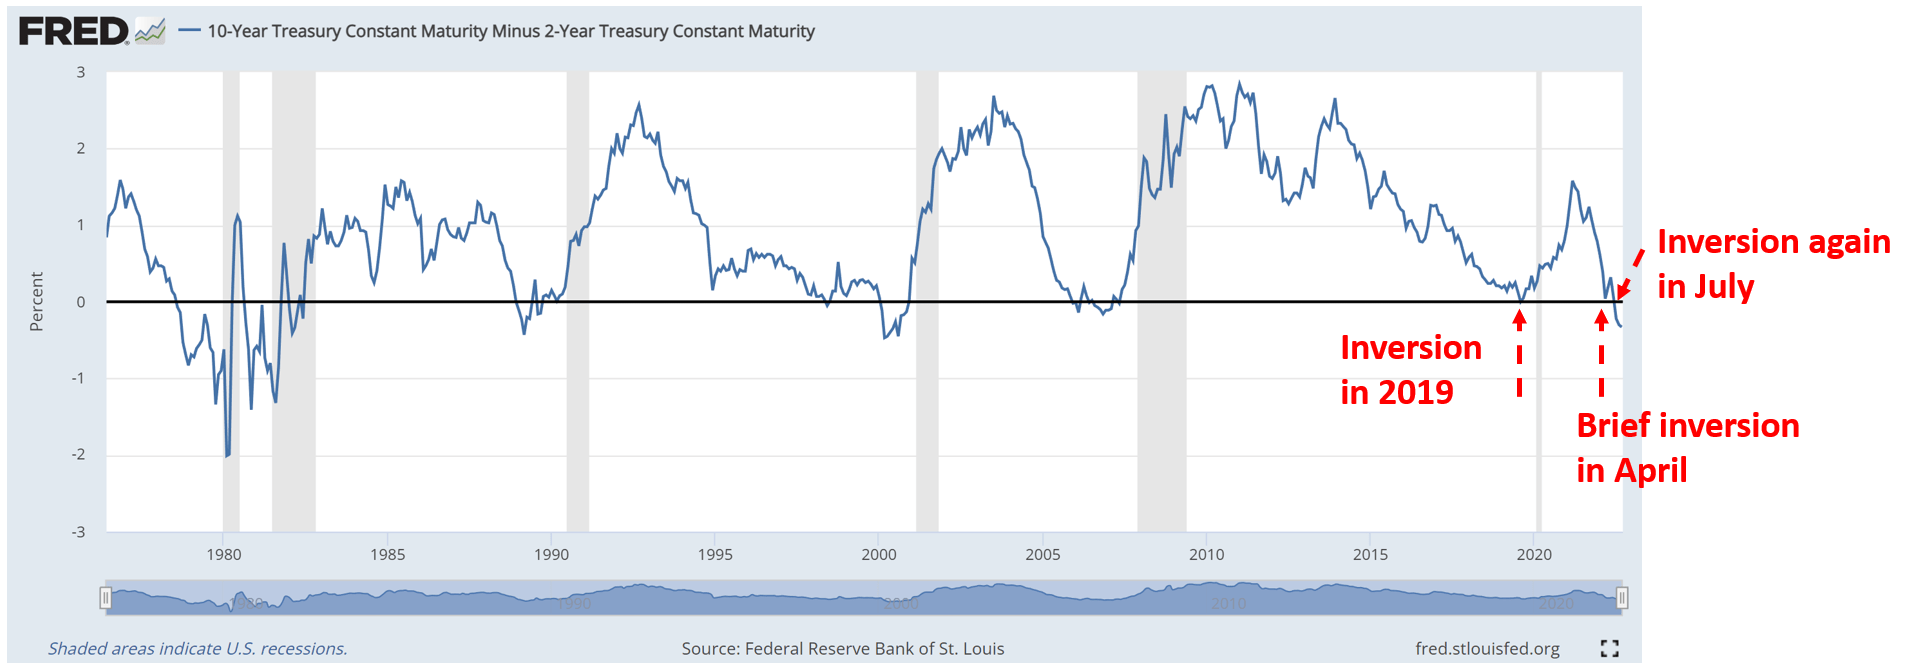
RITM and AGNC: more pain ahead
And it is no surprise that both RITM and AGNC, together with the rest of the mREIT sector, responded poorly under such a narrowing and inverted spread. The sector, represented by the VanEck Mortgage REIT Income ETF (MORT), lost more than 18% over the past year since the yield spread started narrowing, far underperforming the overall market’s 10.7% loss. As a leader in this space, AGNC fared even worse, actually suffering more losses than the sector. AGNC suffered a total loss of more than 20%. RITM fared relatively better (for reasons to be detailed later) but still lost 9.6%.
Source: Seeking Alpha data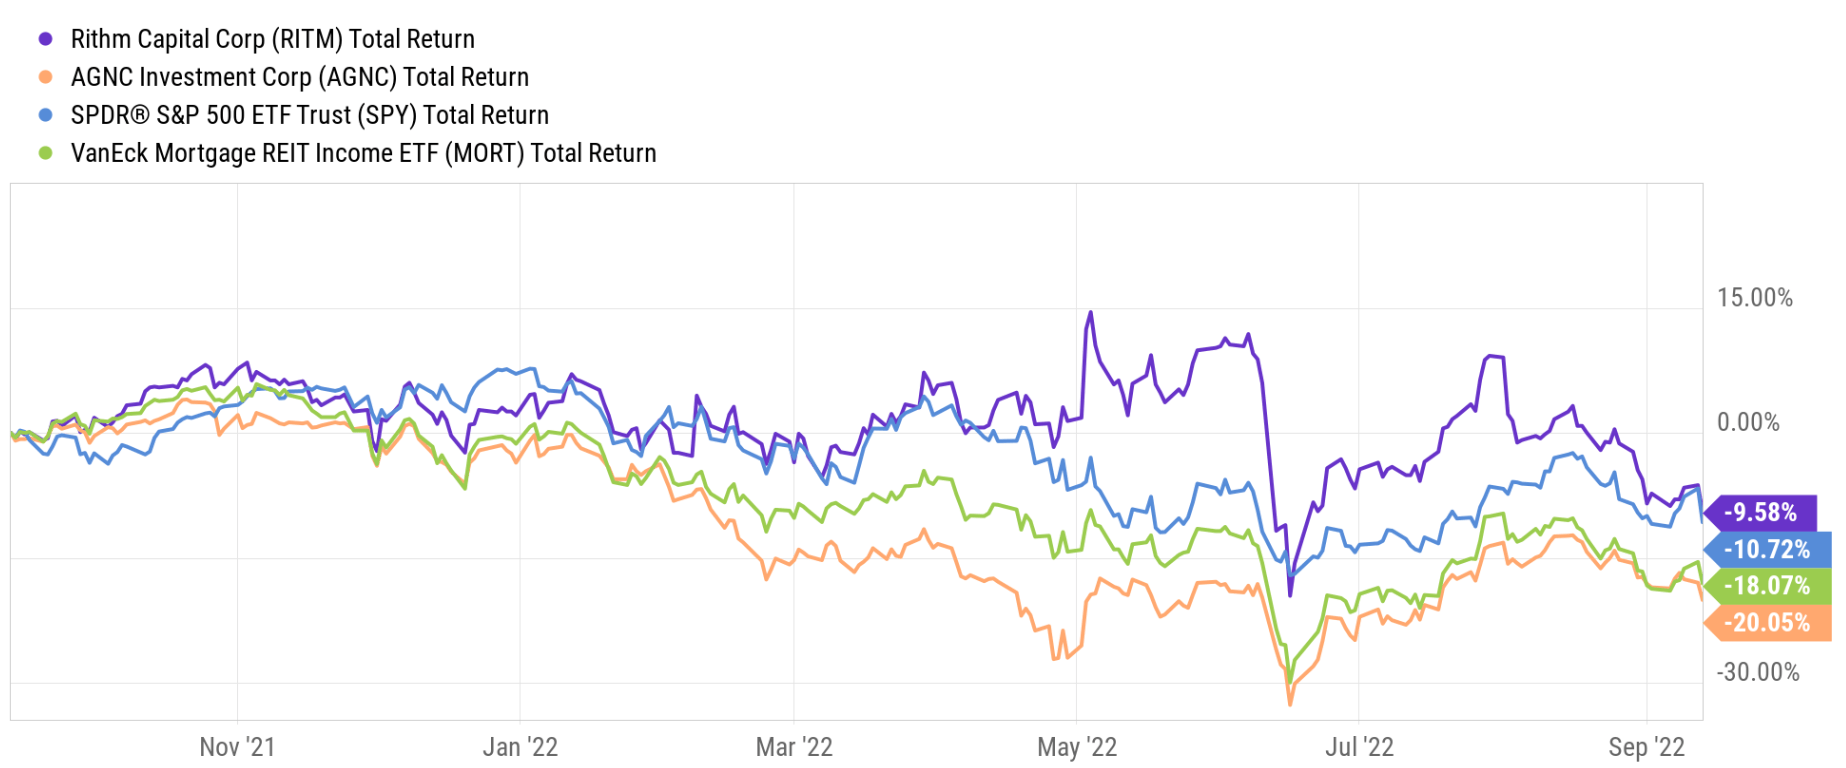
Looking forward, I see more pain ahead, at least for two fundamental reasons.
First, I foresee the yield curve remaining inverted for a while. In the August CPI data just released yesterday, inflation turned out to be higher than anticipated. The YoY rise reached 8.3% compared to the anticipated 8.1%. The inflation data triggered a large stock market decline, with the S&P 500 index losing more than 4%. Now investors are hedging for an 80% probability of a 75-bp rate hike, and a 20% chance for a 100bps rate hike on the short-term end, according to CME’s FedWatch tool. Given the central bank’s current target rate stands at 2.25%-2.50%, such expected hikes imply a short-term rate in the range of 3.0%~3.5%. On the other side of the equation, I expect the long-term rate to rise no more than 3% to 4% because of the reasons argued in my earlier writings.
Ultimately, I expected the combined dynamics of inflation and long-term rates to lead to a persisting inversion of the yield curve.
At a very fundamental level, in the long term, treasury bond rates cannot rise above long-term inflation or GDP growth. Our government has been relying on inflation and GDP expansion to inflate away and outgrowth its debt obligations for decades in the past. And it will (it will have to) continue doing so.
Second, I see trouble brewing for the house markets. Some of the underlying forces are not unlike those that brewed the 2008 financial tsunami. As shown in the next chart, the median house listing price kept going up this year despite all the economic troubles. The median listing price went up another 16.6% in July alone, to $449k. At the same time, mortgage rates went up substantially, too. All told, the net result is that buyers are being hurt twice: by rising borrowing rates AND rising housing prices. Based on these data from Realtor.com, on average, buyers have to pay about 53% more than a year ago for home purchases.
To me, this represents a huge risk going forward. If interest rates go up further (highly likely), mortgage rates will likely follow in tandem. Coupled with persisting inflation, housing affordability could be in serious jeopardy and delinquencies could surge. In the end, we could be facing a financial tsunami, not unlike the one in 2008.
Source: Realtor.com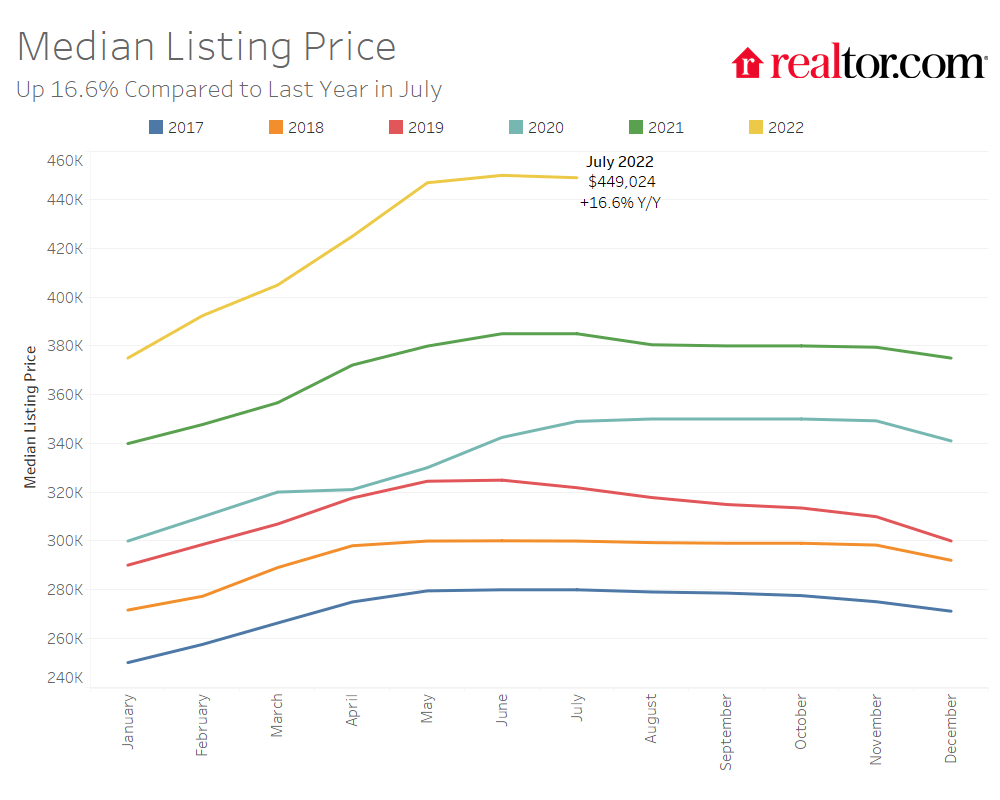
RITM and AGNC: Valuation not low enough
Now on to valuations. In a nutshell, I do not see their valuation low enough to compensate for the risks ahead
As you can see from the next chart, AGNC has been historically priced at an average of 0.927x of its book value. Currently, it is priced at 0.922x, only a mere 0.6% discount from the historical average. RITM has been priced at about 0.949x of its book value on average in the past. And currently, it is at 0.735x times, a 23% discount from its historical average. But even such a sizable discount is insufficient to overcome the risks ahead in my view. As a matter of fact, such discounts are not even sufficient to overcome their loss of book value as aforementioned.
If you recall from an earlier chart, both RITM and AGNC have been suffering book value loss in recent years, and I view such loss as chronological. RITM’s current book value is only $12.28 dollars per share, about ¼ (24.3% to be exact) below its pre-pandemic level of $16.21 per share despite its recent Caliber acquisition. AGNC’s current book value is only $12.53 dollars per share, exactly 1/3 (33%) below its pre-pandemic level of $18.69 a share.
As aforementioned, should mortgage rates and inflation keep rising (both are very likely), RITM and AGNC would suffer further loss of book value and also declining revenues at the same time. High rates and stretched affordability should hurt the demand for new mortgages. And increasing occurrence of delinquencies and even defaults will cause book value loss.
Source: Seeking Alpha data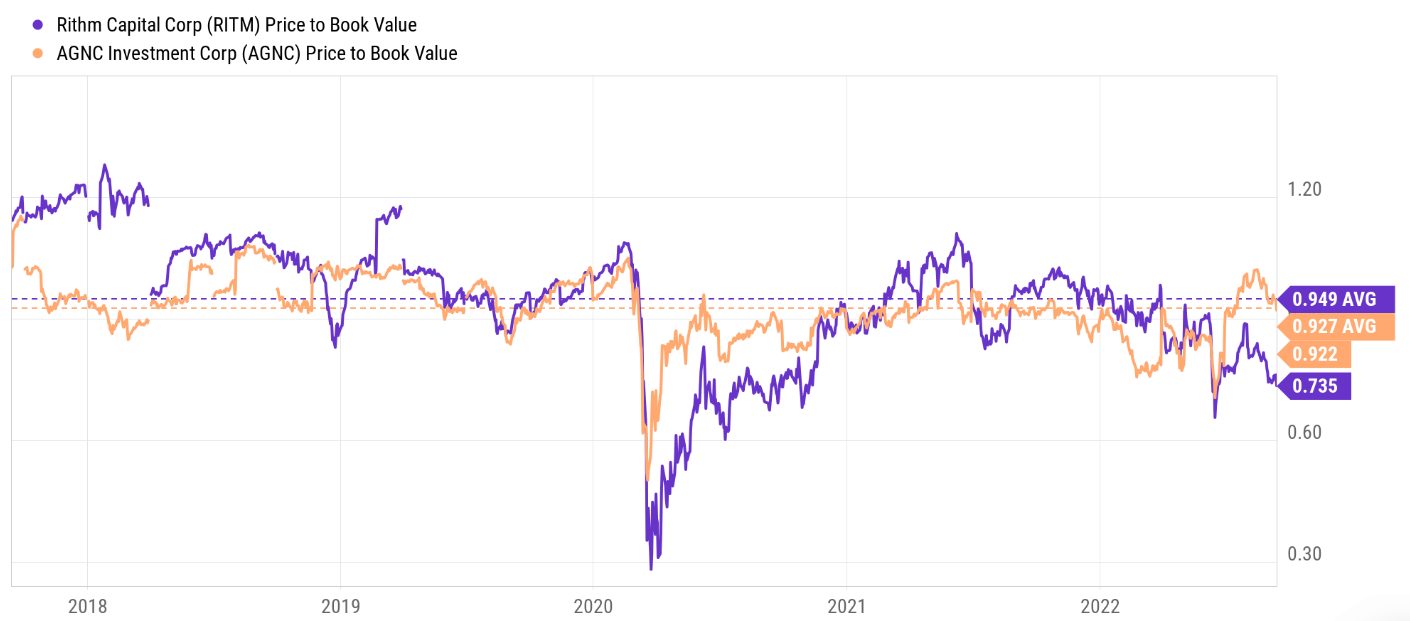
Final thoughts and other risks
To reiterate, no one is safe on a sinking boat, including leaders like RITM and AGNC. There are certainly differences between these stocks. For example, the Caliber acquisition helps to diversify RITM’s profit streams and dampen its rate sensitivity. However, investors should first evaluate the overall state of the boat before focusing on such details. Under the overwhelming pressure of a potential recession and housing market tsunami, such detailed differences are likely to be irrelevant – as I have recently relearned from the NLY lesson.
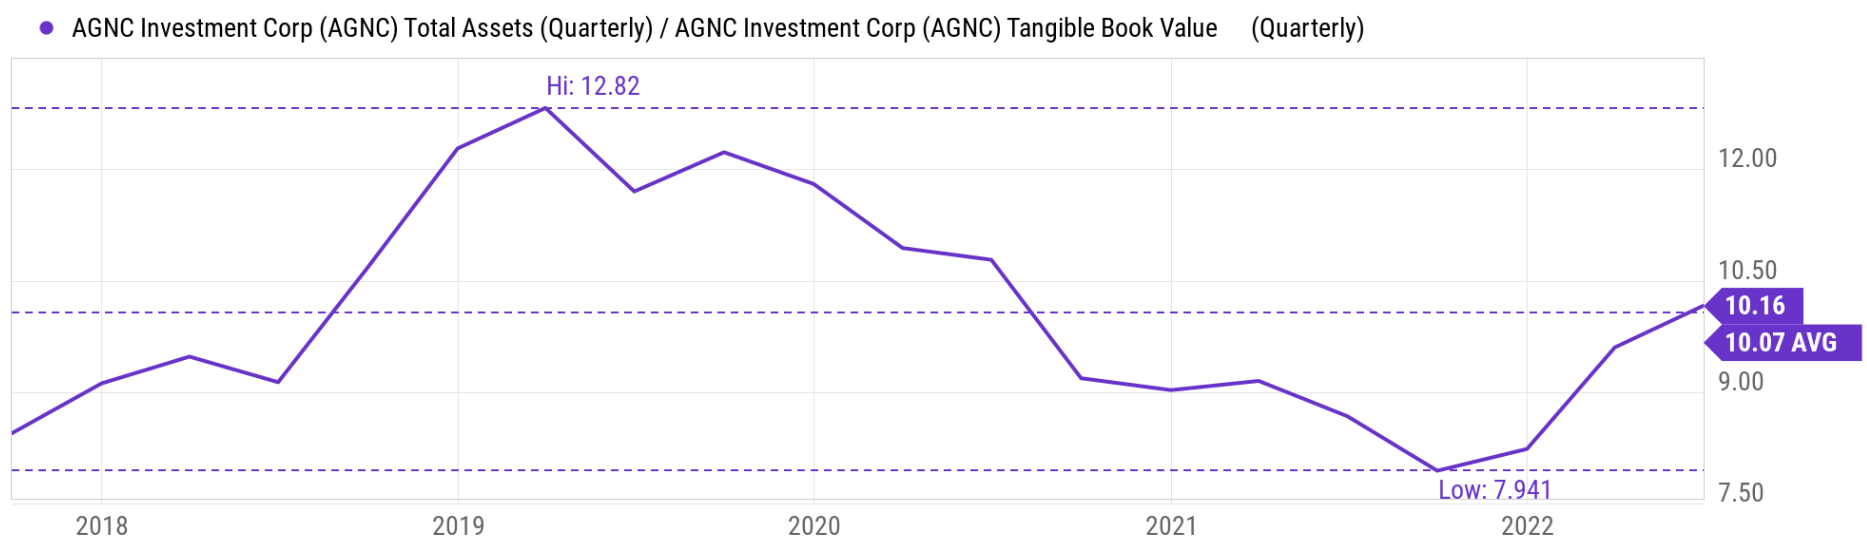
Finally, besides the above risks, both stocks are also quite leveraged. Both AGNC and RITM have been deleveraging since early 2020, probably sensing that the zero borrowing rates won’t last forever. As you can see from the chart below, RITM reduced its leverage ratio (in terms of debt-to-equity ratio) from a peak of 2.44x in early 2020 to about 1.4x in the mid of 2021. AGNC reduced its leverage ratio (in terms of asset-to-tangible-book-value ratio) from a peak of 12.8x in 2019 to as allow as almost 7.9x by the end of 2021. However, the leverage climbed back in recent quarters as seen. Their leverage ratios currently hovers above the historical average despite the rising borrowing costs and uncertainties ahead.
Source: Seeking Alpha data Source: Seeking Alpha data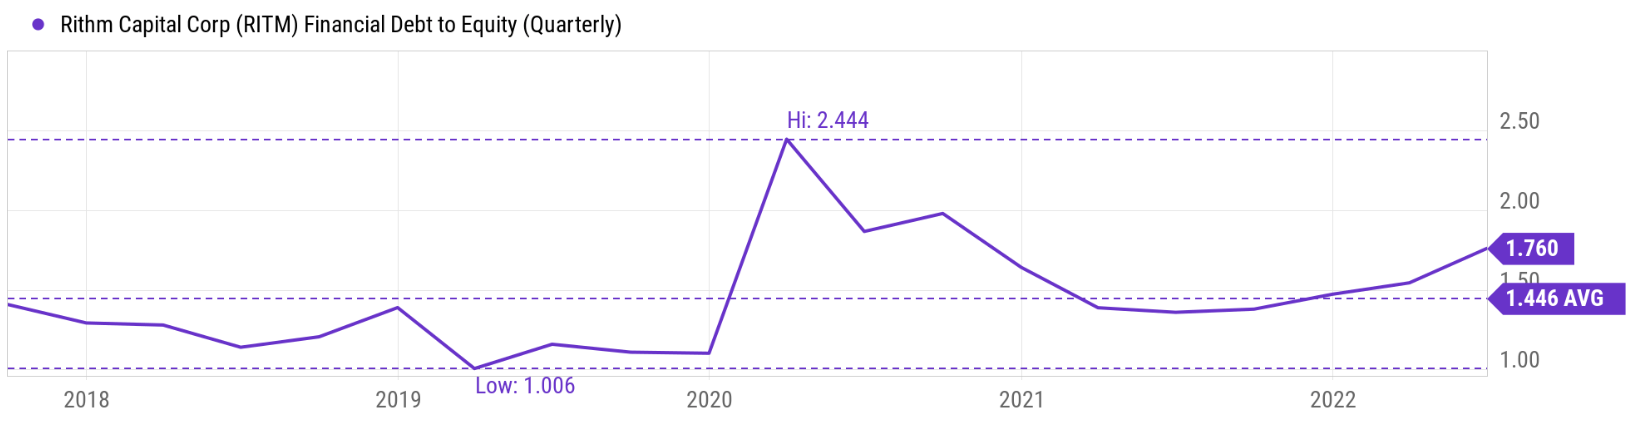
Be the first to comment