

RAND ANALYSIS
- U.S. to South African bond yield spreads widen.
- Stronger than expected U.S. economic data buoy upside bias.
- USD/ZAR bulls take out 15.0000 handle.
ZAR FUNDAMENTAL BACKDROP
GET YOUR Q3 RAND FORECAST HERE!
THE REFLATION TRADE DISCUSSION IS BACK!
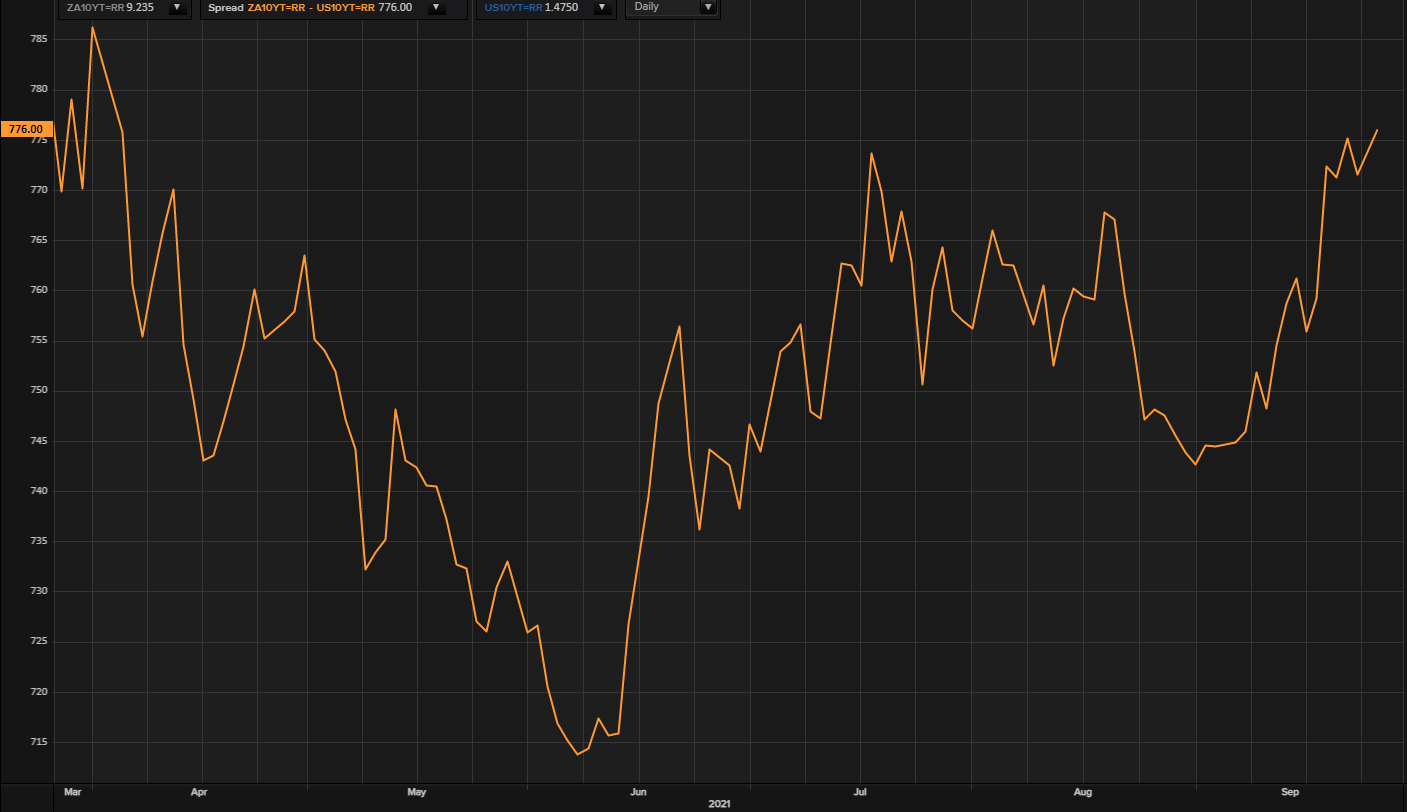
Markets reacted earlier today after 10-year U.S. Treasury yields popped (see graphic below) resulting in a move away from the South African rand as the U.S. dollar firmed – reducing the attractiveness of the carry trade. The 10-year treasury yield briefly breached the 1.5% level last seen in June 2021, but has since dissipated reflecting in a more subdued USD/ZAR price. Reflation talks are back on the table while U.S. data may not be on the same page as employment is weak, production is throttled leaning towards stagflation (higher inflation along with stagnant growth).
TREASURY 10-YEAR SPREAD – SA vs U.S.
Source: Refinitiv
While commodity prices are rebounding, this was not enough to halt today’s surge but as yields soothe the USD/ZAR pair will likely move in tandem. An additional headwind facing rand bulls came via the U.S. durable goods data which printed well above forecasts (see calendar below). A positive for the U.S. economy and a subsequent bullish factor for the greenback.

Source: DailyFX economic calendar
SOUTH AFRICAN TREASURY CONCERNS
Numerous key employees at the South African treasury have recently resigned which is cause for concern for investors. Many of the above held senior positions and while Director-General Dondo Mogajane endeavored to ease these fears ahead of the newly appointed Finance Ministers medium-term budget speech, treasury will be under intense scrutiny – refer to my latest tweet for more information.
TECHNICAL ANALYSIS
USD/ZAR DAILY CHART
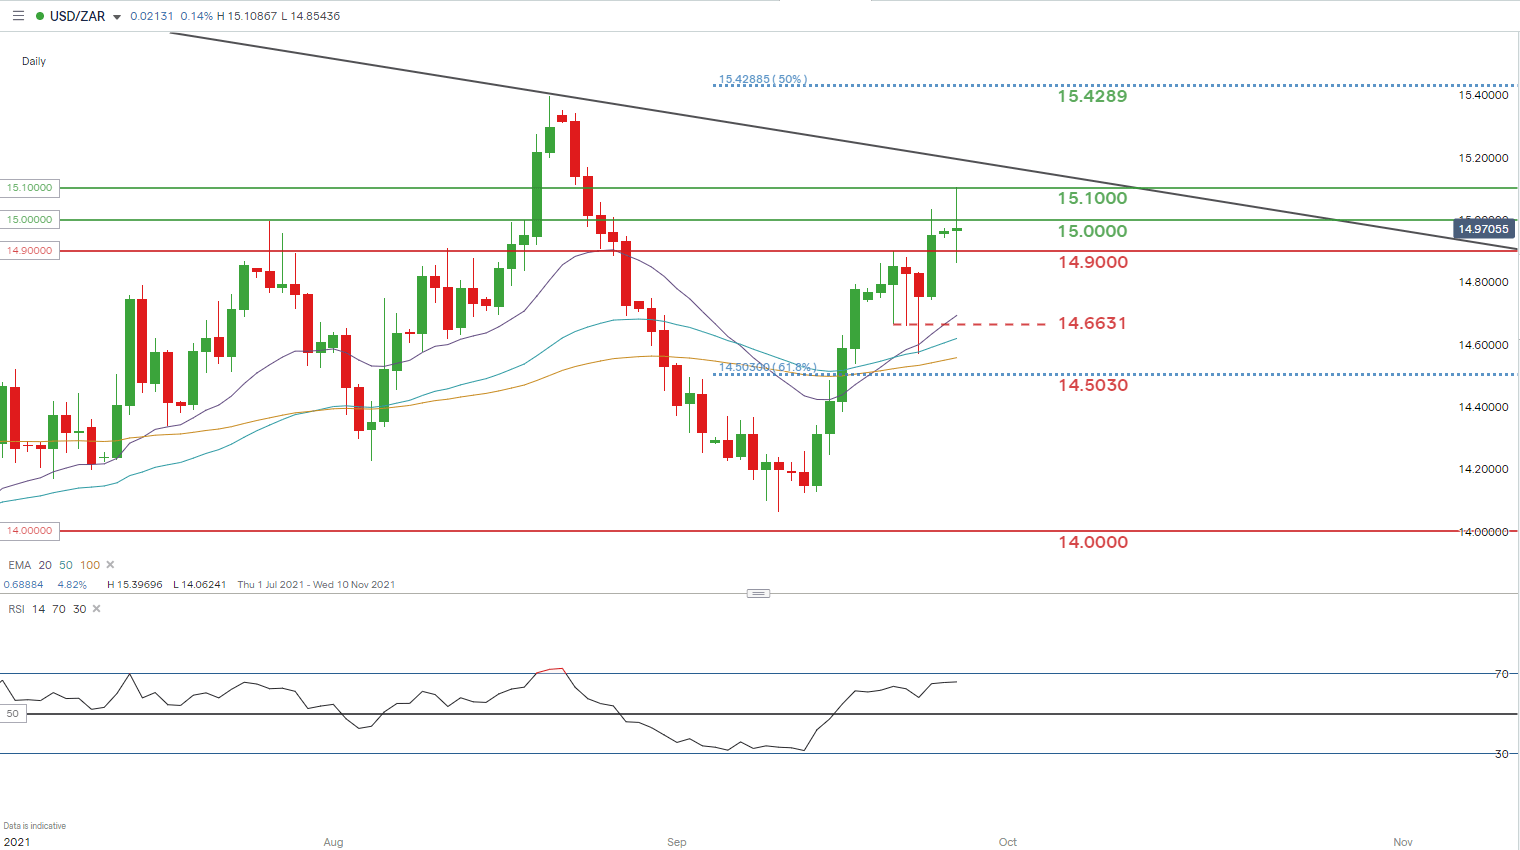
Chart prepared by Warren Venketas, IG
After a strong start to the week for USD bulls, the rand has since pulled back echoing a fall in yields as mentioned above. The daily candle now moves towards a representation of a doji candle which suggests indecision by market participants. The Relative Strength Index (RSI) is nearing overbought levels but still has room to run which could see further USD/ZAR upside.
Rejection at the 15.1000 handle may be tested near-term but fundamentals are really the key this week with many high impact data releases by both the U.S. and South Africa.
Resistance levels:
Support levels:
— Written by Warren Venketas for DailyFX.com
Contact and follow Warren on Twitter: @WVenketas
Be the first to comment