

JHVEPhoto/iStock Editorial via Getty Images
Investment thesis: the company is still a buy, but due to rising Fed hawkishness in the last month, you should set clear sell-stops.
Rio Tinto (RIO) is a global leader in industrial metals mining:
Rio Tinto Group engages in exploring, mining, and processing mineral resources worldwide. The company offers aluminum, copper, diamonds, gold, borates, titanium dioxide, salt, iron ore, and uranium. It also owns and operates open pit and underground mines, mills, refineries, smelters, power stations, and research and service facilities. The company was founded in 1873 and is headquartered in London, the United Kingdom.
It is the second largest company in the “other industrial metals and mining” group according to the website Finviz.com
The overall economic backdrop of this industry is positive but softening.
First, price growth for industrial metals, while still positive, is declining:
Y/Y percentage change of key industrial metals (FRED)
The Y/Y percentage change in copper, aluminum, and zinc, while positive, are moving lower.
Meanwhile, the PMIs for industrial metals users are crossing over into contraction territory:
Global copper users indicated a stagnation in operating conditions in January, following 18 consecutive monthly expansions. Production levels and incoming orders were both scaled back at the quickest pace since May 2020. The lack of momentum further discouraged firms from taking on additional staff, as job shedding continued for the third straight month at the start of the year.
The Global Aluminium Users PMI™ fell into contraction territory for the first time since June 2020 at the start of 2022, as firm pointed to renewed and modest reductions in production levels and new orders.
Global steel users reported that output and new orders had returned to contraction territory in January after renewed expansions in December. Muted demand conditions led to a modest fall in sales, which was nonetheless the quickest seen since May 2020. As a result, job shedding was reported for the first time in just over a year.
More broadly, however, global manufacturing is still expanding:
The start of 2022 saw the rate of expansion in global manufacturing production ease to its weakest pace during thecurrent19-monthupturn. The slowdown reflected weaker growth of incoming new work, declining international trade volumes, supply chain disruptions and rising COVID-19 infections (in part due to the Omicron variant).
The JPMorgan Global Manufacturing PMI™ – a composite index produced by JPMorgan and IHS Markit in association with ISM and IFPSM – posted a 15-month low of 53.2 in January, down from December’s five-month high of 54.3. The PMI has signalled growth for 19 successive months.
What we’re likely seeing is the cumulative effect of the continued Covid issues (absenteeism, difficulty in filling jobs, price pressures) combined with rising rates from several central banks.
This has not yet shown up in Rio’s financial data.
RIO Tinto revenue growth (Seeking Alpha)
Rio’s gross revenue is still showing strong growth.
Rio’s gross, operating, and net margin percentages (Seeking Alpha)
Rio’s gross, operating, and net margins are at very strong rates.
The company has ample cash flow to pay its dividend:
Rio cash flow and dividend analysis (Seeking Alpha)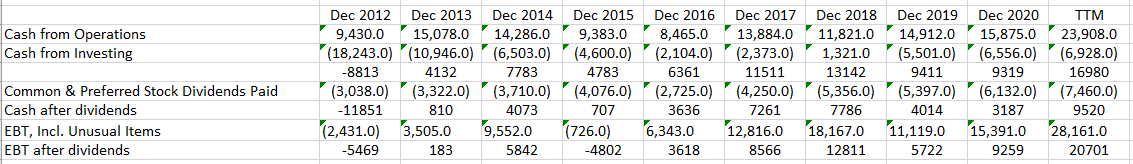
The above table combines data from the revenue and cash flow statement. The third line shows the amount of cash the company has after making investments. This number has been positive in all years but 2012. The fifth line shows the amount of cash after paying dividends, which has also been positive in all years but 2012. Finally, I included the total amount of cash after paying dividends from EBT, which has been positive in 8 of the last 10 years.
Finally, let’s look at the charts:
RIO weekly and daily charts (Stockcharts)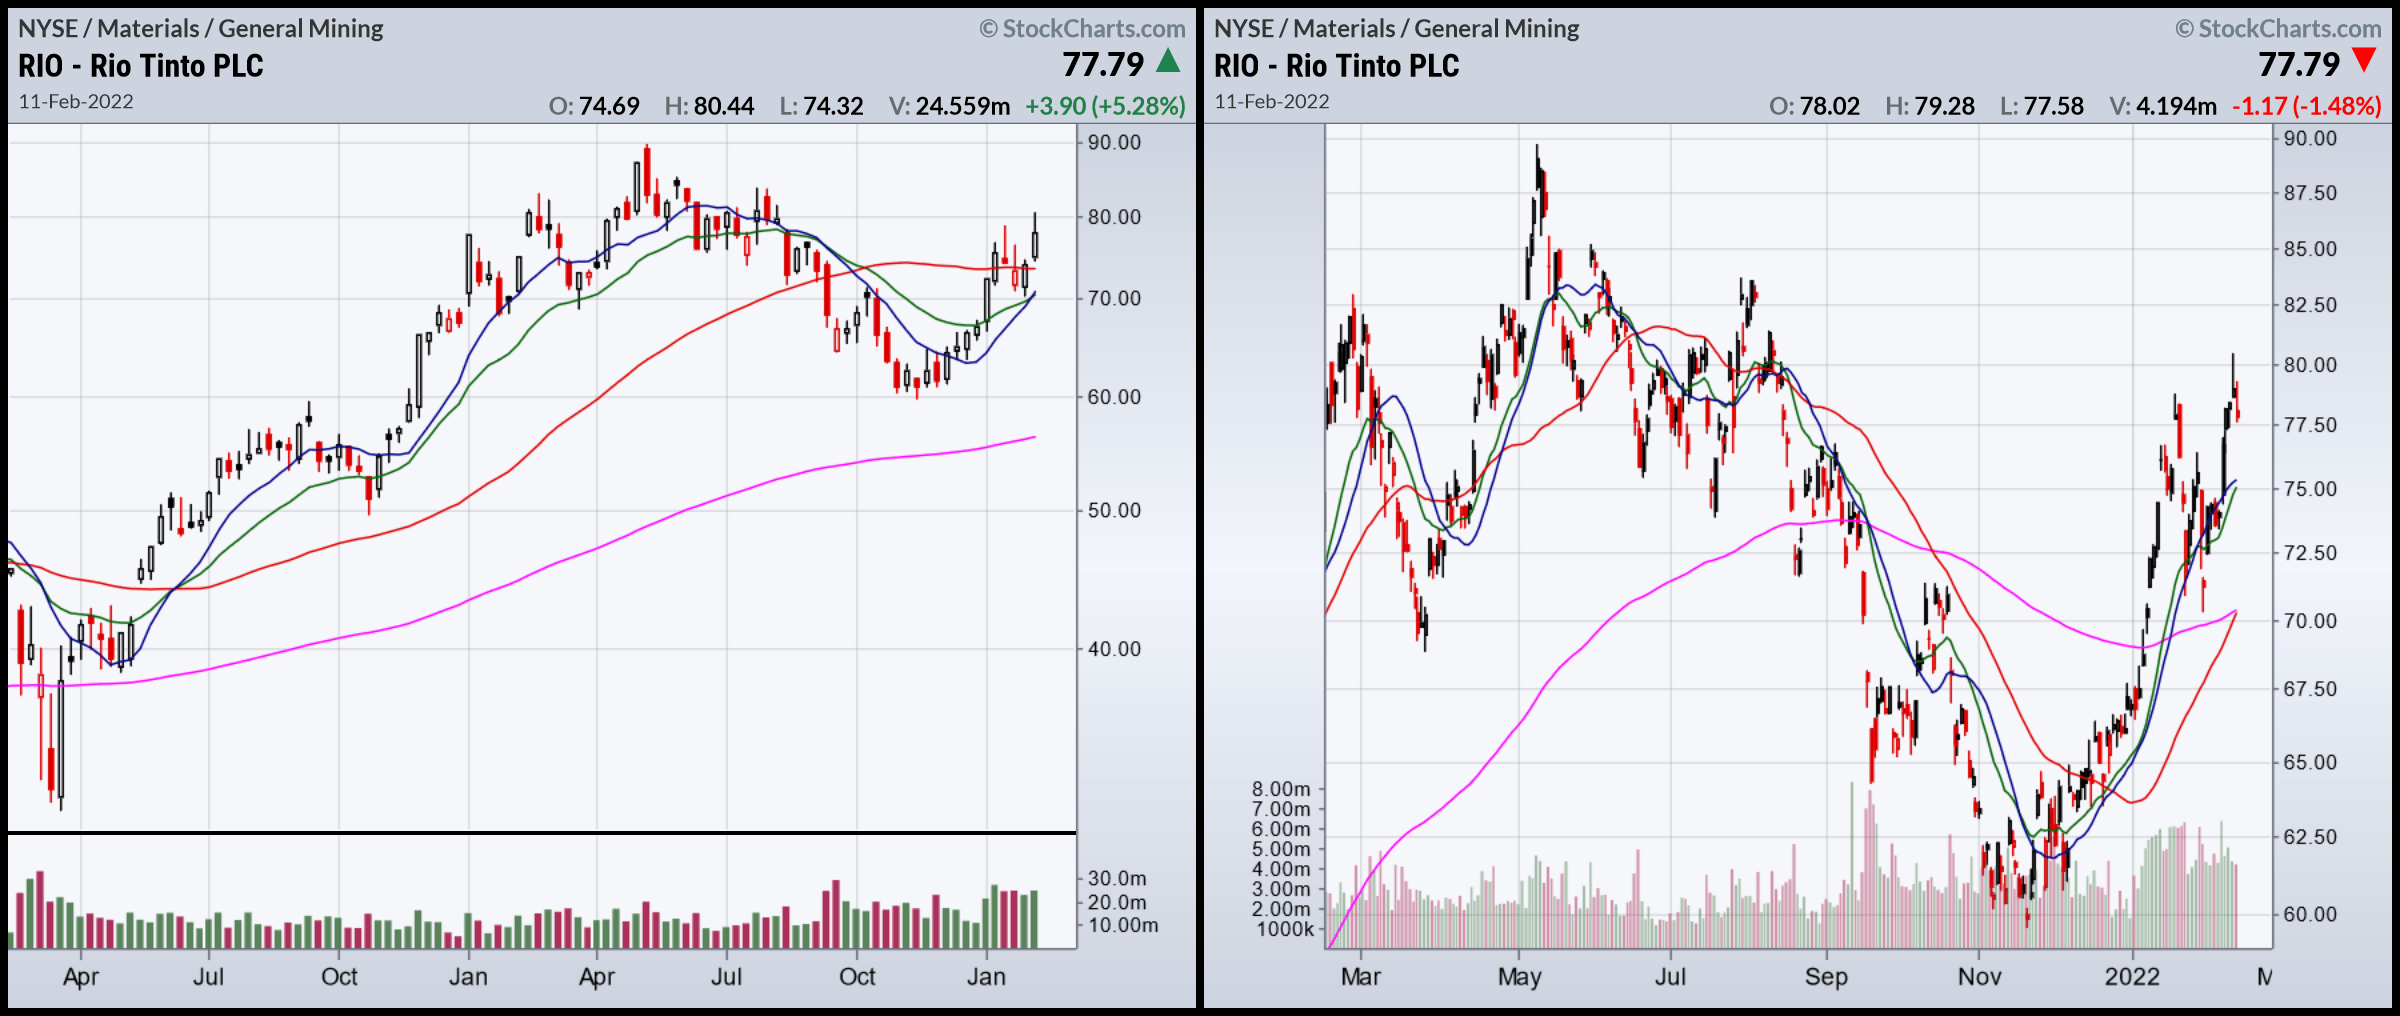
The weekly chart (left) shows a rally that started last fall. The daily chart shows the rally in more detail. Prices are now over all the EMAs and there has been a solid volume surge this year pushing the stock higher.
I first wrote about this company on January 11 when the stock was trading in the lower 70s. It’s now in the upper 70s. I still like it, but now with a cautionary note: in the last month, US central bankers have issued a number of statements which all point to higher interest rates. What really caught my attention recently was St. Louis President Bullard’s statement arguing for a full point increase by the summer:
-St. Louis Federal Reserve President James Bullard said on Thursday that he has become “dramatically” more hawkish in light of the hottest inflation reading in nearly 40 years, and he now wants a full percentage point of interest rate hikes over the next three U.S. central bank policy meetings.
Bullard has been a very dovish for most of the time I’ve been following him. That statement is a big change in tone worth keeping in mind.
This is still a buy, but keep a close eye on the Fed. The central bank may be poised for surprise moves which could hurt this rally.
Be the first to comment