

olm26250/iStock via Getty Images
Preferred Share Opportunities
Preferred shares have been selling at a premium for quite some time now, driving yields even lower for securities with modest risk. Below are three examples of shares in John’s portfolio (with the exception of NLY.PG which his wife Jane holds in her portfolio).
- New Residential Preferred Series B (NRZ.PB)
- EPR Properties Preferred Series G (EPR.PG)
- Annaly Capital Preferred Series G (NLY.PG)
NRZ.PB offers the greatest call date protection but EPR.PG and NLY.PG are both callable within the next 12-15 months. During the month of January we added more shares of NRZ.PB because of the higher yield with the call date protection.
EPR.PG doesn’t have strong call-date protection but I personally don’t think they will redeem these shares or re-issue them because I am not sure they would be able to generate a lower cost of funds (the share price below the PAR even though the call date isn’t for another 9 months is a big reason why I feel this way).
Lastly, NLY.PG is at a point where I am looking to switch over to NLY Preferred Series I (NLY.PI) or NLY Preferred Series F (NLY.PF) because both of these preferreds are currently offering a higher yield (I am more attracted to NLY.PI because I would like the call protection vs NLY.PF is more likely to be called. The downside in that NLY.PI is slightly above the $25/share PAR. NLY.PI offers a slightly higher yield that NLY.PG currently does but the reason why we originally went with NLY.PG was because we bought it at a major discount during COVID.
Either way, these shares are selling at discounts compared to rather large premiums no less than six months ago. For someone like John who is really looking to redeploy cash and generate stable yields this represents a great opportunity.
Background
For those who are interested in John and Jane’s full background, please click the following link here for the last time I published their full story. Here are the key details about John and Jane that readers should understand.
- This is a real portfolio with actual shares being traded.
- I am not a financial advisor and merely provide guidance based on a relationship that goes back several years.
- John retired in January 2018 and is only collecting Social Security income at this point in time.
- Jane officially decided to retire on December 31, 2020. She is now collecting social security as her primary source of income.
- John and Jane have other investments outside of what I manage. These investments primarily consist of minimal risk and minimal yield certificates.
- John and Jane have no debt and no monthly payments other than basic recurring bills such as water, power, property taxes, etc.
John and Jane requested my help after we discovered that their financial advisor was charging excessive fees and engaging in trades that appeared to be more favorable to the advisor than it was to John and Jane. I do not charge John and Jane for anything that I do and all I have asked of them is that they allow me to write about their portfolio anonymously in order to help spread knowledge and to make me a better investor in the process.
Generating a stable and growing dividend income is the primary focus of this portfolio and capital appreciation is a secondary characteristic.
Dividend Decreases
No stocks cut their dividend/distribution that was payable during the month of December.
Dividend and Distribution Increases
Two companies increased their dividend/distribution or paid a special dividend during the month of December in the Traditional and Roth IRAs.
I covered MAIN and O in the previous December article for Jane’s account (linked at the end of this article). I will include a summary of their dividend increases.
Main Street Capital – I recently wrote an article titled Main Street Capital: One Of Those Stocks You Pray Will Drop So You Can Buy More about a week ago. Share prices have dropped closer to a reasonable entry point but considering John and Jane have a pretty full position we would still wait for a further drop.
MAIN paid a special dividend of $.10/share in the month of December.
Realty Income – The dividend was increased from $.236/share per month to $.246/share per month. This represents an increase of 4.2% and a new full-year payout of $2.952/share compared with the previous $2.832/share. This results in a current yield of 4.36% based on the current share price of $67.76.
Retirement Account Positions
There are currently 35 different positions in John’s Traditional IRA and 20 different positions in his Roth IRA. While this may seem like a lot, it is important to remember that many of these stocks cross over in both accounts and are also held in the Taxable Portfolio.
Below is a list of the trades that took place in the Traditional IRA during the month of December.
Traditional IRA – 12-2021 – Trades Charles Schwab
Below is a list of the trades that took place in the Roth IRA during the month of December.
Roth IRA – 12-2021 – Trades Charles Schwab
The next image shows the realized gain-loss from the sale of Walgreens (WBA) from the ROTH IRA.
Roth IRA – 12-2021 – Realized Gains Charles Schwab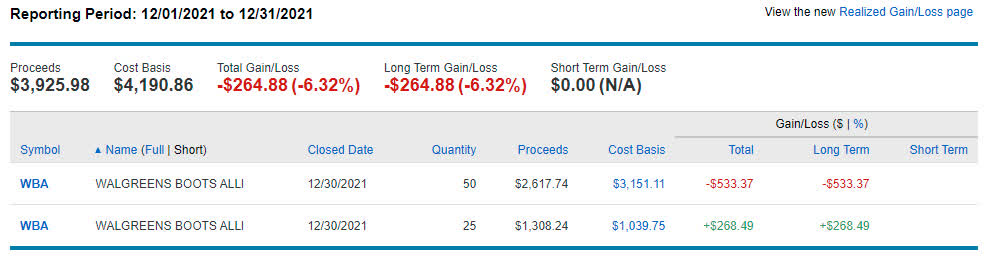
We have been trimming back on WBA because we have major concerns about the pharmacy/quick stop retail segment. There is limited to no margins in pharmacy (in fact, they are often barely breaking even on losing money) with the hope that product purchases in the stores will generate the profit. We recently eliminated the rest of the WBA position because there were great buying opportunities in the month of January.
December Income Tracker – 2020 Vs. 2021
Income for the month of December was up considerably for John’s Traditional and Roth IRA. The average monthly income for the Traditional IRA finished up at an average $1,098.38/month (4.8% higher than the 2020 average) and the Roth IRA finished at an average of $590.53/month (2.0% higher than the 2020 average). I am very excited that the trend of reduced dividend income that started during COVID has fully reversed with both retirement accounts generating higher year-over-year income.
SNLH = Stocks No Longer Held – Dividends in this row represent the dividends collected on stocks that are no longer held in that portfolio. We still count the dividend income that comes from stocks no longer held in the portfolio even though it is non-recurring. All images below come from Consistent Dividend Investor, LLC.
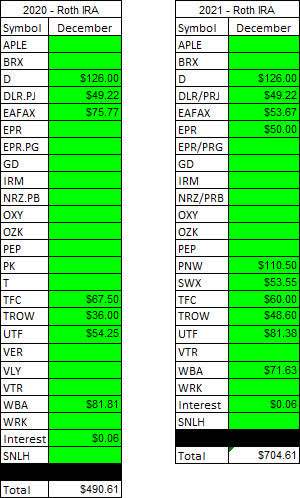
Traditional IRA – 12 – 2020 V 2021 Dividend Breakdown Consistent Dividend Investor Roth IRA – 12 – 2020 V 2021 Dividend Breakdown CDI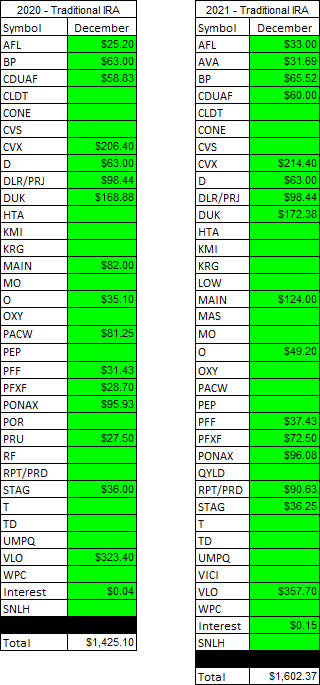
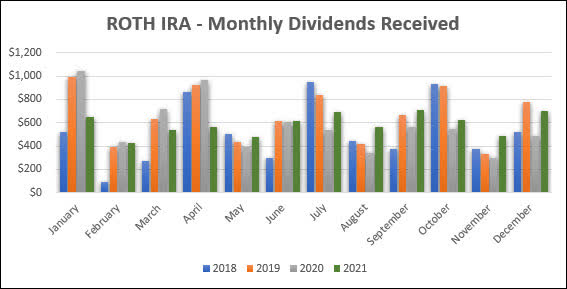
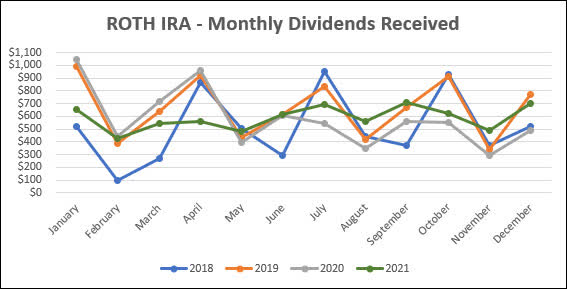
Here is a graphical illustration of the dividends received on a monthly basis for the Traditional and Roth IRAs.
Traditional IRA – 2021-12 – 4 Year History CDI Roth IRA – 2021-12 – 4 Year History CDI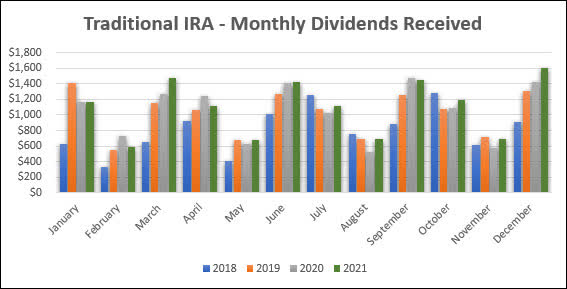
Based on the current knowledge I have regarding dividend payments and share count, the following tables are a basic prediction of the income we expect the Traditional IRA and Roth IRA to generate in FY-2021 compared with the actual results from 2020.
Retirement Projections – December CDI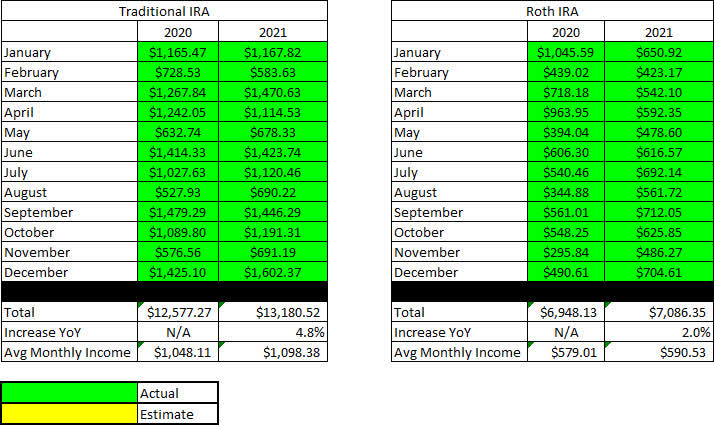
Below is an expanded table that shows the full dividend history since inception for both the Traditional IRA and Roth IRA.
Retirement Projections – December – Full Dividend History CDI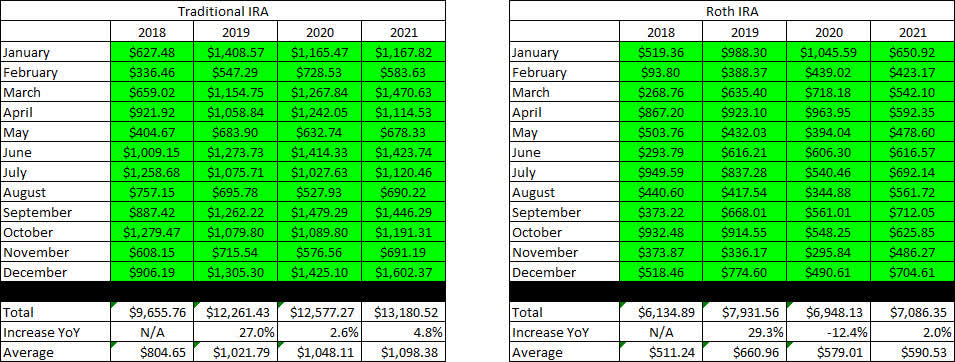
I have included line graphs that better represent the trends associated with John’s monthly dividend income generated by his retirement accounts. The images below represent the Traditional IRA and Roth IRA, respectively.
Traditional IRA – 12-2021 Monthly Dividends CDI Roth IRA – 12-2021 Monthly Dividends CDI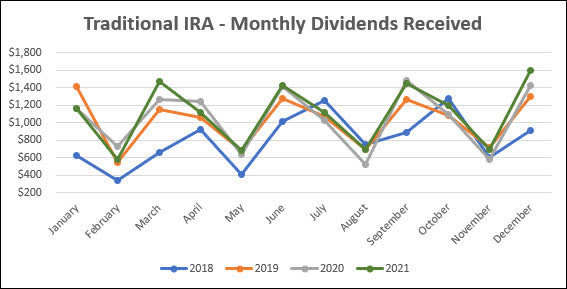
Here is a table to show how the account balances stack up year over year (I previously used a graph but believe the table is more informative).
Retirement Account – Month End Balances – 2021-12 CDI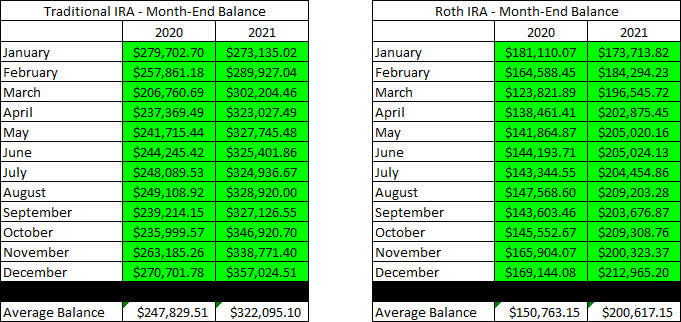
The next images are the new tables that indicate how much cash John had in his Traditional and Roth IRA Account at the end of the month as indicated on his Charles Schwab statements.
Retirement Accounts – 2021-12 – Cash Balances CDI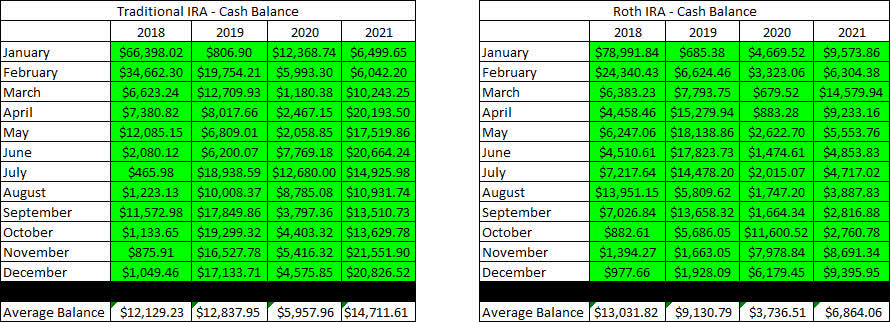
The next two tables provide a history of the unrealized gain/loss at the end of each month in the Traditional and Roth IRAs going back to the beginning in January of 2018.
Retirement Accounts – 2021-12 – Unrealized Gain-Loss CDI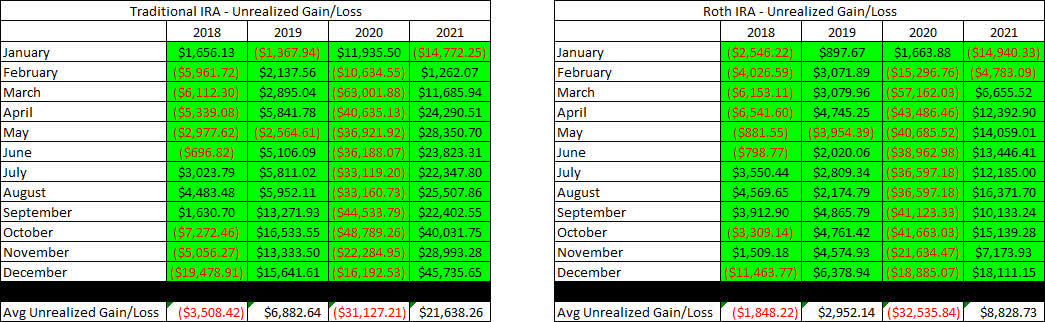
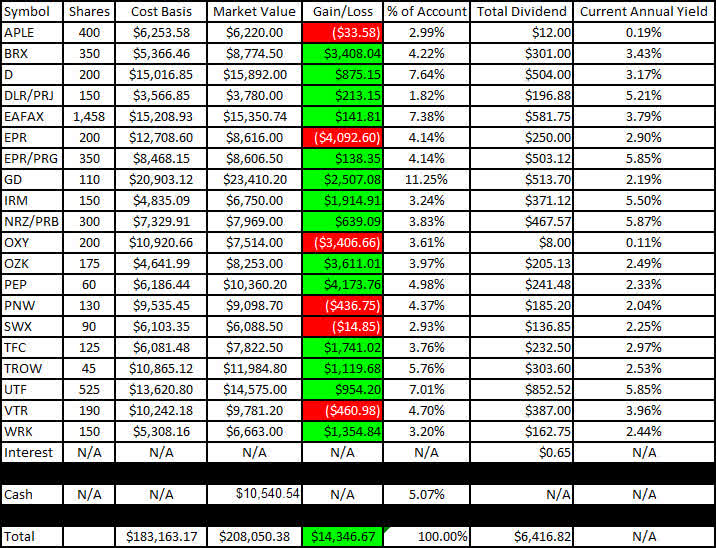
I like to show readers the actual unrealized gain/loss associated with each position in the portfolio because it is important to consider that in order to become a proper dividend investor, it is necessary to learn how to live with volatility. The market value and cost basis below are accurate as of the market close on January 28, 2021.
Here is the unrealized gain/loss associated with John’s Traditional and Roth IRAs.
Traditional IRA – 2021-12 – Gain-Loss CDI Roth IRA – 2021-12 – Gain-Loss CDI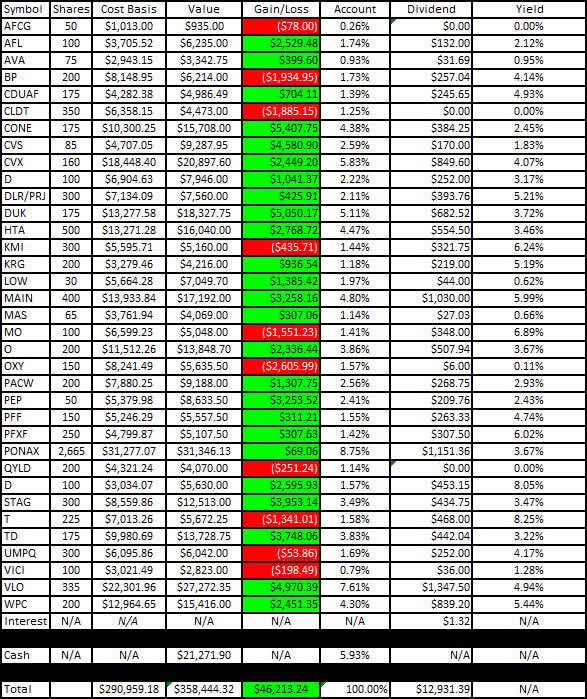
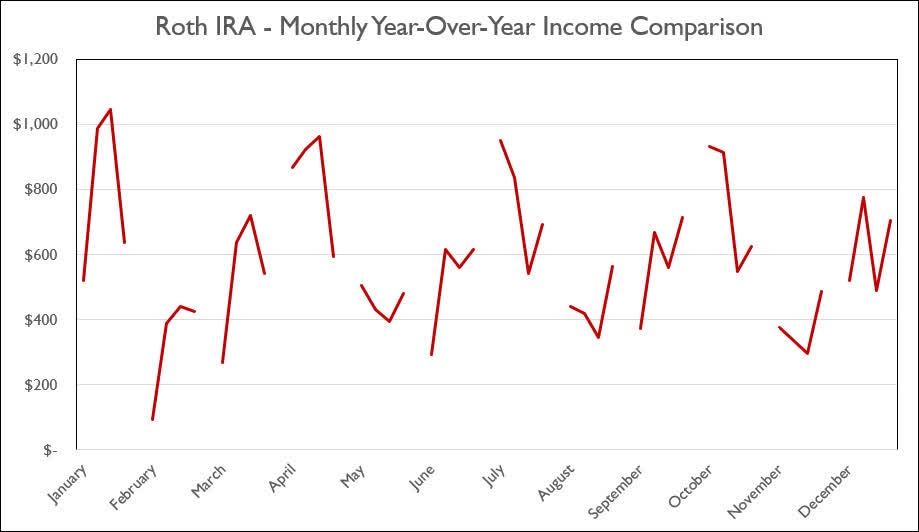
The last two graphs show how dividend income has increased, stayed the same, or decreased in each respective month on an annualized basis. I believe that the graph will continue to become more valuable as more years of data become available.
Traditional IRA – 2021-12 Annual Month Comparison CDI Roth IRA – 2021-12 Annual Month Comparison CDI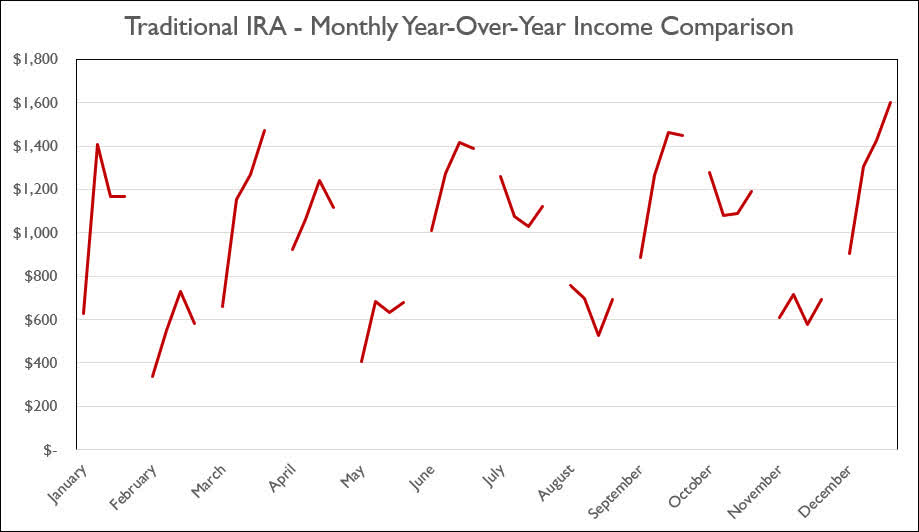
Conclusion
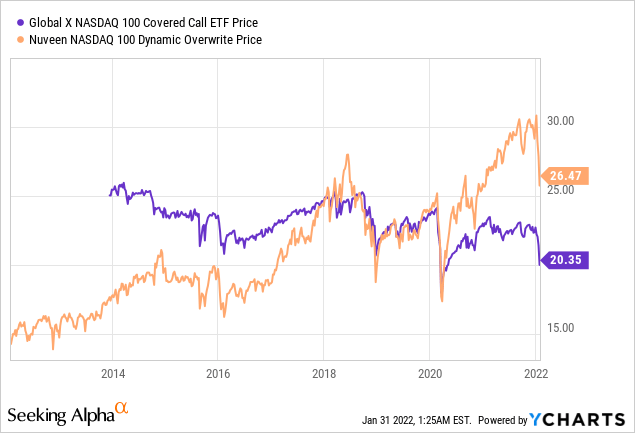
Global X NASDAQ 100 Covered Call ETF (QYLD) took a plunge to lows that haven’t been seen since the beginning of COVID in March 2020. We used this opportunity to build up the position during the month of January.
I previously mentioned that I wrote an article QQQX Or QYLD: Which Fund Makes More Sense (One Year Later) was published in December to determine which investment represented the better investment at this point in time. The verdict of this article was that investors who held QQQX or were looking to start a position were better off investing in QYLD because it would limit the downside.
In the original article QQQX Or QYLD – Looking At Which Fund Makes More Sense I concluded that QQQX made the most sense. because it offered the greatest amount of upside.
The image below shows that the fall of the Nasdaq 100 has impacted QQQX to a greater degree (which was expected because of the difference in how each fund operates).
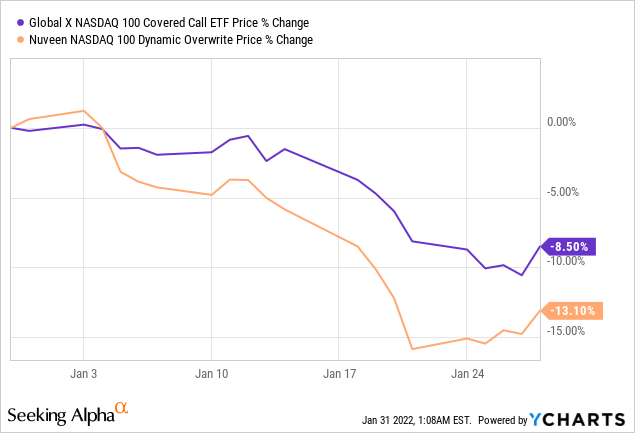
QYLD didn’t come out unscathed but it has improved the buying opportunity for prospective investors while also providing downside protection in these uncertain times. If the Nasdaq-100 continues to fall further we might consider shifting the position over to QQQX if it becomes attractive enough. Even then, QYLD is available at prices that haven’t been seen since the start of COVID.
There are other incredible opportunities available currently as well with the share price of T. Rowe Price (TROW) experiencing a significant drop while many of the preferred holdings have seen their shares selling below PAR value even though they still have call date protection.
December Articles
I have included the links for John and Jane’s Taxable Account and Jane’s Retirement Account articles for the month of December below.
Article Format: Let me know what you think about the format (what you like or dislike) by commenting. I appreciate all forms of criticism and would love to hear what I can do to make the articles more useful for you!
In John’s Traditional and Roth IRAs, he is currently long the following mentioned in this article: AFC Gamma (AFCG), Aflac (AFL), Apple Hospitality REIT (APLE), Avista (AVA), BP plc (BP), Brixmor Property Group (BRX), Canadian Utilities (OTCPK:CDUAF), Chatham Lodging Trust (CLDT), CVS Health Corporation (CVS), Chevron (CVX), CyrusOne (CONE), Dominion Energy (D), Digital Realty Preferred Series J (DLR.PJ), Duke Energy (DUK), Eaton Vance Floating-Rate Advantage Fund (EAFAX), EPR Properties (EPR), EPR Properties Preferred Series G (EPR.PG), General Dynamics (GD), Healthcare Trust of America (HTA), Iron Mountain (IRM), Kinder Morgan (KMI), Kite Realty Group (KRG), Lowe’s (LOW), Main Street Capital (MAIN), Masco (MAS), Altria (MO), New Residential Investment Corp. Preferred Series B (NRZ.PB), Realty Income (O), Occidental Petroleum Corp. (OXY), Bank OZK (OZK), PacWest Bancorp (PACW), PepsiCo (PEP), iShares Preferred and Income Securities ETF (PFF), VanEck Vectors Preferred Securities ex Financials ETF (PFXF), Pinnacle West (PNW), PIMCO Income Fund Class A (PONAX), RPT Realty Preferred Series D (RPT.PD), STAG Industrial (STAG), Southwest Gas (SWX), AT&T (T), Toronto-Dominion Bank (TD), Truist Financial (TFC), T. Rowe Price (TROW), Cohen & Steers Infrastructure Fund (UTF), VICI Properties (VICI), Valero (VLO), Umpqua Holdings (UMPQ), Ventas (VTR), Walgreens (WBA), WestRock (WRK), and W. P. Carey (WPC).
Be the first to comment