

Maxiphoto
Investment summary
Portfolio construction in H2 FY22 has become challenging as the market continues to price in a series of new, albeit uncorrelated systematic risks. Chief among these are inflation and central bank tightening regimes that have commenced across all major economies. Alas, investors should be looking to step up in quality and resiliency to absorb the set of macroeconomic risks at play. We’ve molded our investment strategy in FY22 to reflect the forward-looking investment climate. In order to identify and separate alpha in this climate we are seeking factors of quality, value, profitability and a reduction in equity beta to help smooth volatility.
This brings us to Repligen Corporation (NASDAQ:RGEN). We are neutral on RGEN shares as they display a loose affinity to the portfolio characteristics we believe investors will pay a premium for looking ahead. To determine RGEN’s fit within this global-macro strategy we took a hard data approach and examined fundamental and technical factors. We then closed this out with additional market and portfolio statistical analyses. That also involves analysis on a forward- and backward-looking basis, as demonstrated. In doing so, we price RGEN at $200 per share, and rate the shares neutral.
The following series of charts depicts our analysis and helps investors to visualize the data trends in our findings.
Exhibit 1. RGEN 6-month price action
Data: Updata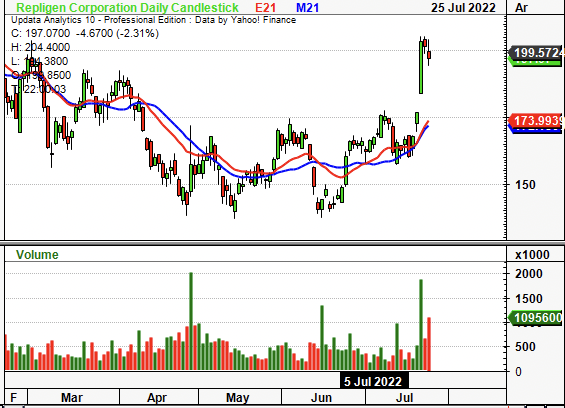
Market factors don’t align, are misleading
The medical devices universe has caught a bid in June/July and now looks to outperform relative to the benchmark. RGEN has joined this party and has curled up from a bottom in late June. However, we see the stock has lost strength relative to the benchmark whilst its covariance structure remains exquisitely high at an equity beta of 1.42, as seen in Exhibit 2. Hence, further downside in the SPX could transpose negatively onto the RGEN share price on this basis alone.
Moreover, the high beta trade of FY20/FY21 has exhausted itself. We are seeking names that fit within the low-beta/high quality pocket of the market as this is what investors are paying a premium for. This presents a risk to investment sizing and is also a key directional risk. Ideally, the alpha opportunity should have some degree of idiosyncratic risk, and with this level of correlation, it might not be the case. On that note, RGEN doesn’t pass the litmus test and remains highly correlated to the market.
Exhibit 2. Diverging from broad market whilst covariance structure remains high, key sizing and directional risk
Data: Updata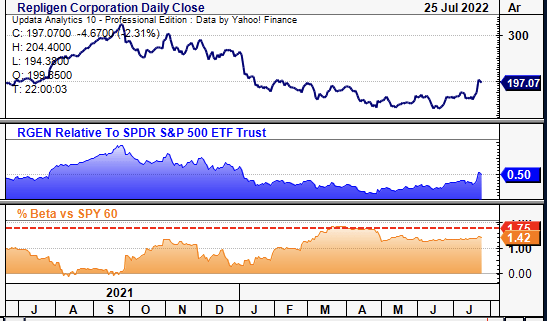
Furthermore, RGEN has strengthened against the US medical devices and health equipment sector since May, as seen in the chart below. However, given the sector’s strengths in FY22 we need to examine how much of this is just beta versus pure idiosyncratic, company-specific alpha. As seen in Exhibit 3, RGEN’s uplift in covariance is relative to the sector, suggesting that recent gains in the stock price are a reflection of broad sector strengths versus investors rewarding something specific to RGEN.
Exhibit 3. RGEN strengthening against sector but this looks to be driven by beta versus an alpha-related phenomenon
Data: Updata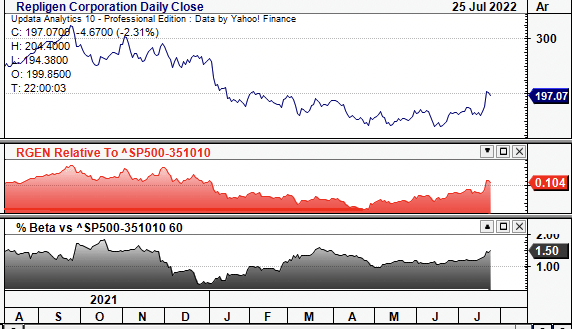
Portfolio characteristics
Balanced portfolios with exposure to alternatives in particular have outperformed and retained strategic and tactical alpha for investors in FY22. With the cool-down in commodity baskets from May-June a constant weighting to alternatives has also balanced risk/reward more favorably. As seen in Exhibit 4, from Jan-June FY22, allocation to a balanced setup on an equal weighted basis has produced a total return of 0.6% (+19.5% alpha), maximum drawdown of 3.2% and a standard deviation over returns of 6.3% [Portfolio 2]. Moreover, returns have been linear with a sharpe and sortino of 0.13 and 0.18 respectively, vs. the benchmark’s -2.5 and -2.25 respectively.
Exhibit 4. Balanced portfolios with a constant weighting to alternatives have outperformed in FY22
Adding RGEN into the mix on an equal weight [16.66%]-0.5% weighting worsens results on backtesting and reduces alpha by ~7%.
Data: HB Insights, Portfolio Visualizer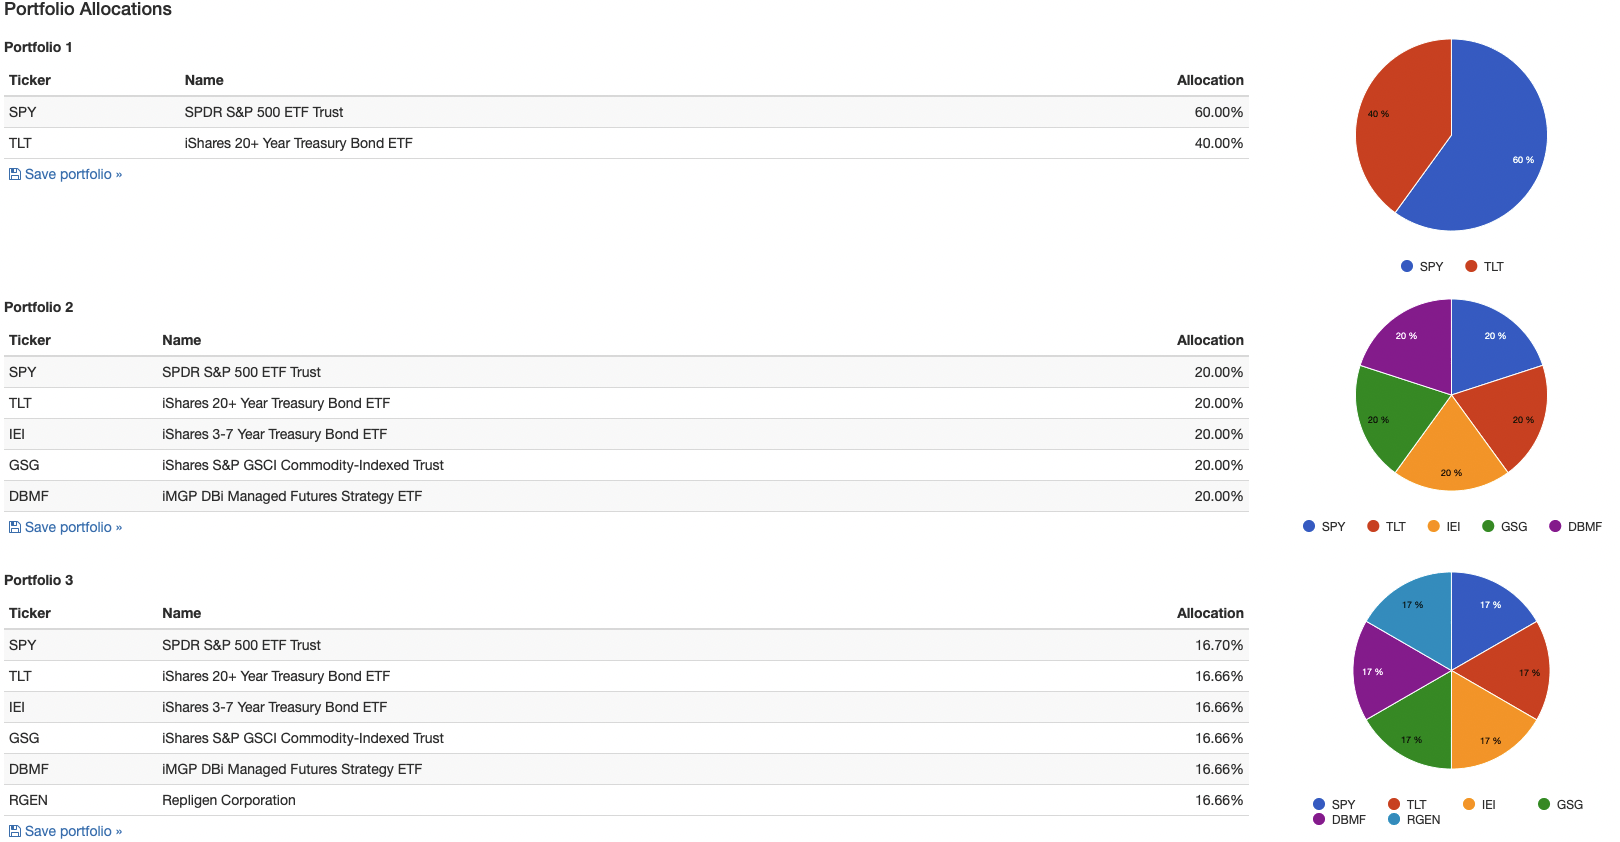
HB Insights, Portfolio Visualizer
Hence, using backward-looking data, RGEN fails to justify its inclusion into a long-only, equity focused portfolio without disrupting risk and return characteristics. In particular, it suggests that any further risk budget to equity risk is likely to increase volatility of portfolio of returns. Hence, this pushes our point further in seeking low-beta, high quality plays.
Valuation factors
Shares are trading at a mammoth 88x P/E and look richly valued at ~88x forward P/E. Shares are also priced at ~6.24x book and 3.45x EV/book. At this point, RGEN is substantially overpriced relative to the GICS sector median. With quality names like Thermo Fisher Scientific (TMO) and Mettler-Toledo International (MTD) pushing 25x and 37x forward P/E, there’s a lack of compelling value on offer. Moreover, these are below historical averages, as seen on the chart below.
Exhibit 5.
Data: HB Insights, Refinitiv Datastream,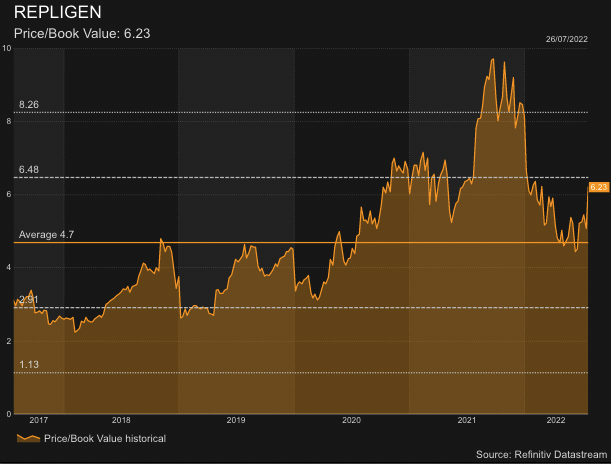
The value factor has resurfaced as an important distinguishing point in terms of valuation. It is therefore imperative not to ‘overpay’ in terms of value relative to price. If we were to pay 3.4x book, then we would effectively be paying $200, suggesting the stock is fairly priced as a measure of corporate value. Hence, we price RGEN at $200.
Moreover, note that RGEN’s ROE and free cash ROE (“ROE[FCF]”) falls at ~9% and 1% respectively. However, that is RGEN’s return, not ours. We are paying ~3.5x book value of equity and therefore our TTM FCF return on equity is just 0.3%, a seen below. This means we don’t see a full return from FCF, which is negligible.
Exhibit 6. Investor ROE is negligible, whilst the stock appears to be fairly priced at ~3.5x book.
Value has resurfaced as a key factor driving equity returns in FY22 and hence we must look at true measures of corporate value to make accurate assumptions in that regard.
Data: HB Insights Estimates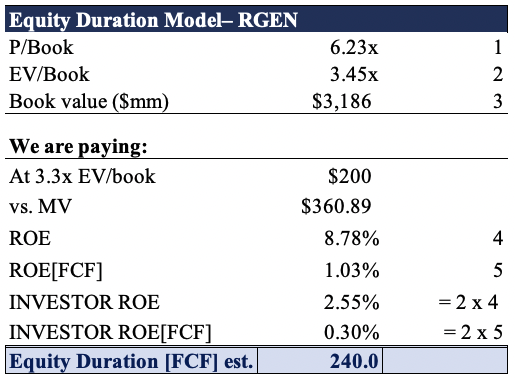
Fundamental factors balance the investment debate
Quarterly operating results have been sound over the past 7 years to date, as seen in Exhibit 7. However, with respect to tangible value (FCF yield; FCF/Enterprise value), trends have been shifting lower since FY18. As seen below, both FCF yield and FCF relative to EV have drifted off highs of ~1% and 0.7% respectively. Meanwhile, FCF conversion has been lumpy in this time and came in at a loss of $7 million in Q1 FY22, below the previous 3 quarter’s average of ~$21 million.
Exhibit 7. FCF conversion drifting lower and now bifurcating as of Q1 FY22
Data: HB Insights, RGEN SEC Filings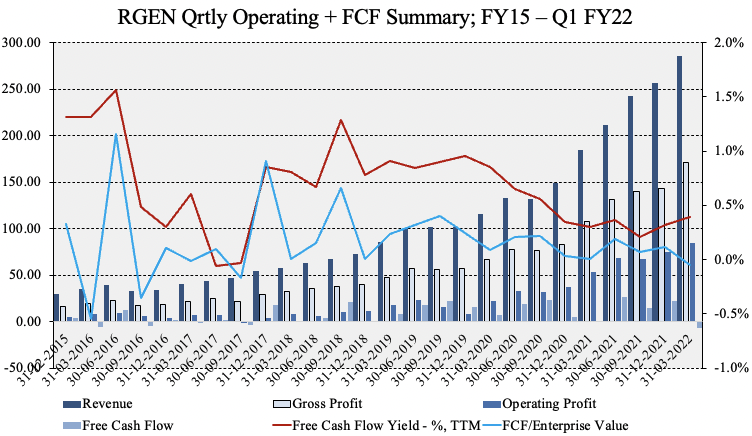
ROIC has also held the line and been gradually ratcheting north since FY17, as seen below. All the while, the level of invested capital has crept up alongside pre-tax earnings. Here we examined the level of NOPAT derived from the previous year’s invested capital (invested capital is rebased with a divisor of 10 as not to distort the chart). We used last year’s invested capital instead of average capital as a cleaner measure of profitability.
As seen, NOPAT has bounced north alongside the level of invested capital, demonstrating a small but notable ~2.5% ROIC in the last earnings print. On absolute terms, it invested more than $2.7 billion in Q1 FY22, delivering a NOPAT of just $66 million and therefore a return on capital of 2.4% (Exhibit 9).
Exhibit 8. ROIC ratcheting north alongside pace of invested capital [Invested capital rebased with divisor of 10]
Data: HB Insights, RGEN SEC Filings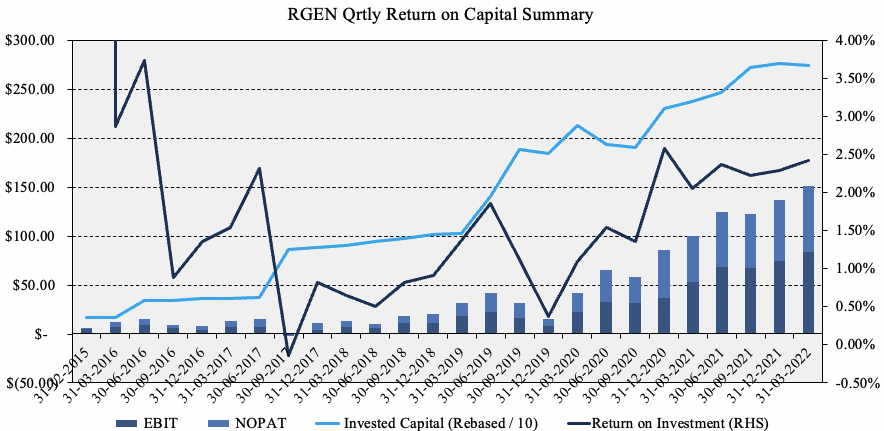
Exhibit 9. Q1 FY22 ROI Summary
Data: HB Insights, RGEN SEC Filings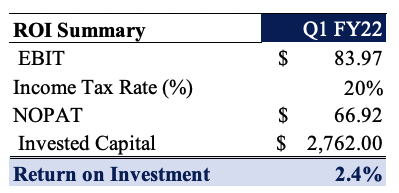
Moreover, ROE and ROA have recovered from FY18 lows as seen in Exhibit 10. Both of these have each pushed substantially north to a combined value of ~16% last quarter. Moreover, since FY15, operating margin has also drifted higher and gained ~500bps sine FY18.
Exhibit 10. ROA and ROE recovered from FY18 lows and look to continue pushing higher looking ahead
Data: HB Insights, RGEN SEC Filings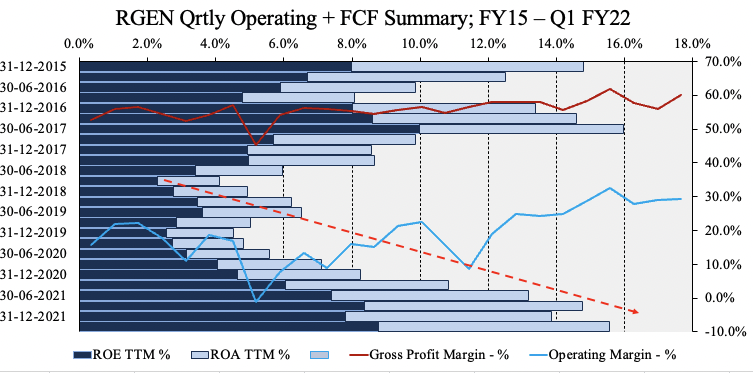
Technical factors
On the daily point and figure, shares have continued south with a series of downthrusts since highs of $226. After finding a bottom in the $140’s, shares have recovered to the upside. However, recent price action is bearish, and is stuck beneath several resistance lines. Offsetting this is the recent upward thrusts providing bullish weight to the case. We have price targets clustered to $238 from this analysis.
Exhibit 11. Price targets clustered to the upside, ranging from $154-$238
Data: Updata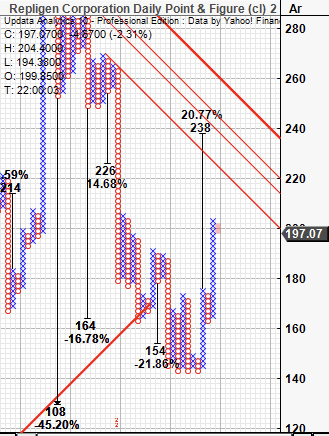
Tracing the fibs down from the previous high to the April bottom we see it’s tested this level 3x before now retracing ~38% of the move. It looks to be testing this point again after gapping up from $174. If it continues off this support zone we think it could push towards $218, as seen below.
Exhibit 12.
Data: Updata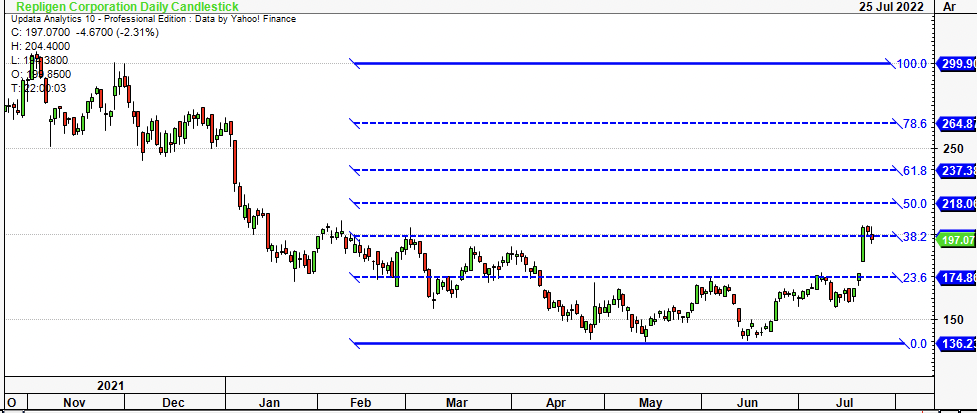
Trends have also shifted north and the stock has punched through the cloud with the lag line also trading above cloud support. This looks to be early confirmation of the bullish trend, and provides support to the investment case.
Exhibit 13.
Data: Updata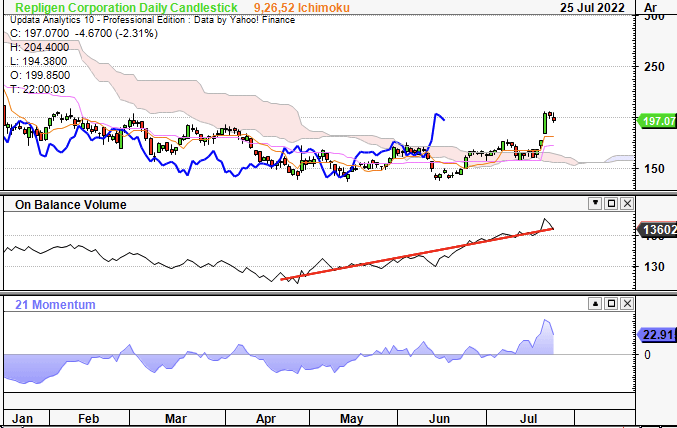
In short
The investment case for RGEN remains balanced, in our estimation. Whilst there are a number of attractive features at the profitability and resiliency level, we also note valuations are a concern and that recent upticks in the share price could be a result of sector beta.
We’ve priced RGEN at $200 noting it appears to be fairly valued, however recognize it does posses many desirable characteristics. Nonetheless, it doesn’t align with our current investment strategy, and without a directional view on the markets, we rate neutral.
Be the first to comment