

Shares are on sale like the buildings are burning down. Vladimir18/iStock via Getty Images
While working on the monthly Portfolio Update, the section on apartment REITs kept growing. It became clear that this needed to be a separate article. We keep several articles exclusive for subscribers, but I’m sharing the entire Apartment REIT Update for our public readers.
There are quite a few factors to cover here for the 6 apartment REITs:
- AvalonBay (AVB)
- Equity Residential (EQR)
- Camden Property Trust (CPT)
- Essex Property Trust (ESS)
- Mid-America Apartment Communities (MAA)
- UDR (UDR)
CPI: Shelter
One of my biggest complaints about the use of CPI (Consumer Price Index) is the way “shelter” is calculated. Some people like it. I do not. The data on shelter is lagged and flawed in multiple ways.
Shelter is based on rent (not home prices) and involves asking homeowners (with no expertise) how much they think their home would rent for. To be clear, even as an expert on REITs, I still don’t know the market rent value for my home. I intend to live in it, so I have no reason to learn about fair market rent.
I would rather see a monthly survey of landlords (who have expertise) inquiring about their current offered rent including leasing concessions. That would eliminate the lag and result in a sampling of actual market rates. To be fair, there are still flaws in this method.
This comes down to a question of whether we should be measuring:
- Prices actually paid (lagged by including old rates) or
- Market prices.
The Federal Reserve picked option 1. I believe option 2 is vastly more useful for guiding decisions.
Does the difference really matter? You decide. I pulled the data for CPI: Shelter and contrasted with data from the Zillow Observed Rent Index, also known as ZORI:
Federal Reserve, Zillow, Chart by Author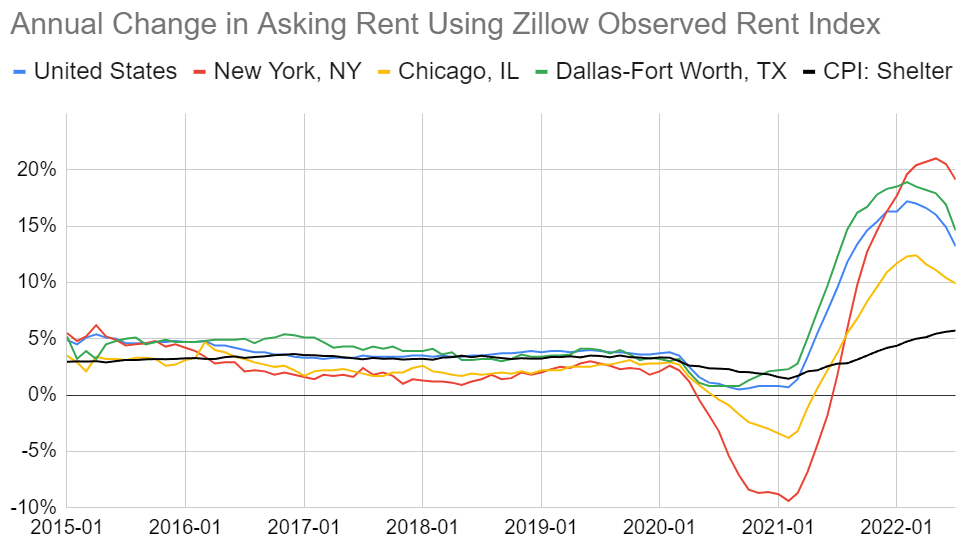
We can easily see that:
- When the value was in the 3% to 5% range, the difference was inconsequential.
- In 2020, CPI: Shelter didn’t fall far enough or fast enough.
- In 2021, it dramatically underestimated the increase.
- Gateway markets like New York saw the biggest fall and saw exceptional year-over-year growth rates because of the low bar set in late 2020 and early 2021 (as we predicted).
Note: As gateway markets saw huge growth rates, MAA and CPT (less gateway exposure) are the worst performing apartment REITs year-to-date despite outstanding growth in same-property Net Operating Income.
While the year-over-year growth rate is falling in 2022, the rent charged to consumers is still increasing:
Zillow, Chart by Author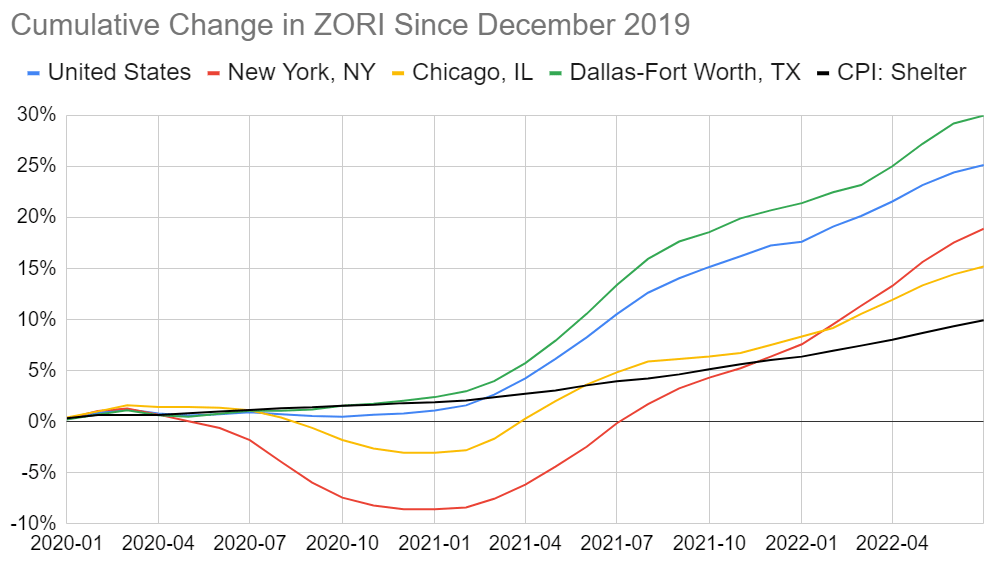
Further, actual market rents are still increasing at a slightly faster rate than CPI: Shelter. We can demonstrate that by using month-over-month growth rates:
Zillow, Chart by Author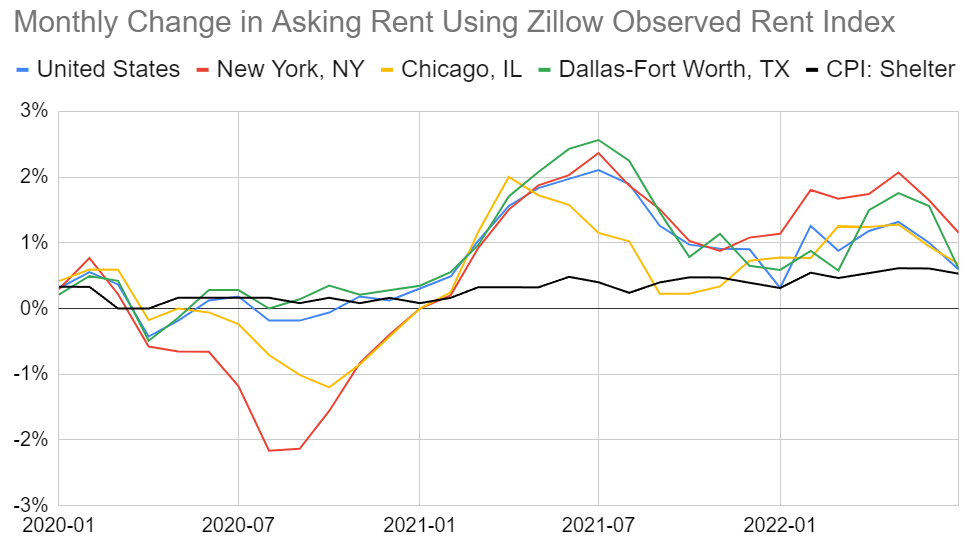
It looks like the monthly growth rate in asking rents is finally dipping low enough that the gap between CPI: Shelter and asking rents may stop expanding soon. However, CPI: Shelter will still need to run hot for a couple of years to make up for the gap recorded so far.
Remember that ZORI for the United States as a whole is up 25% since December 2019 while CPI: Shelter is only up 10%. That’s a gap of 15%. Even if market rents flatlined today, CPI: Shelter could run hot for years just to catch up with the rents landlords are actually advertising today.
Since CPI: Shelter is severely trailing the actual change in market rates, I believe CPI: Shelter could be overstated for years. That’s a problem because the Federal Reserve will be looking at CPI: Shelter and because the standard response to “inflation” is “higher rates”. However, higher rates are enabling faster growth in apartment rents.
Did Rents Really Rise That Much?
According to ZORI, the year-over-year change in rental rates ran over 15% for a while. Can that be right?
Absolutely. Here’s some data from CPT:
CPT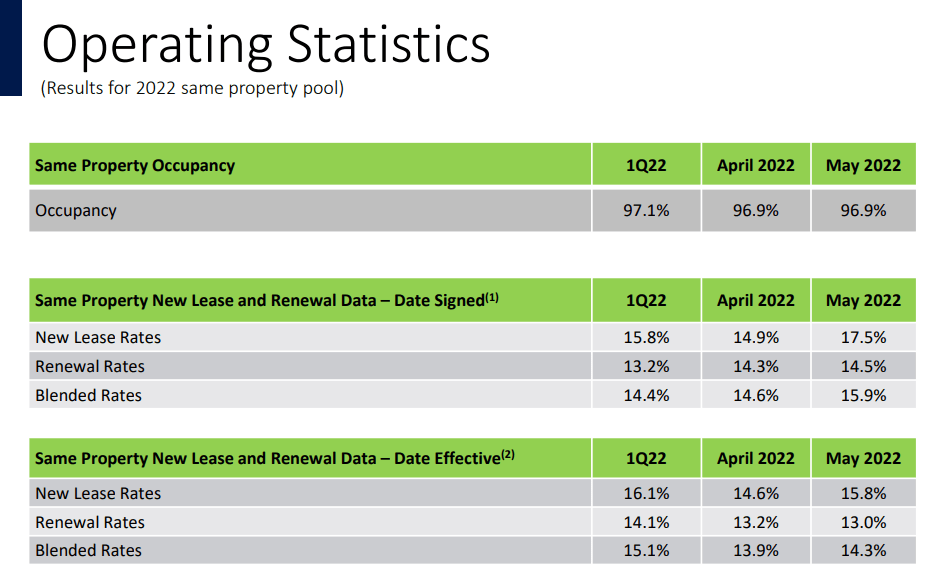
That’s pretty explicit. New lease rates and blended rates both broke above 15% at times.
Looking at MAA, we can see that in Q1 2022 the percentage of residents moving out to buy a home hit the lowest level since at least early 2016:
MAA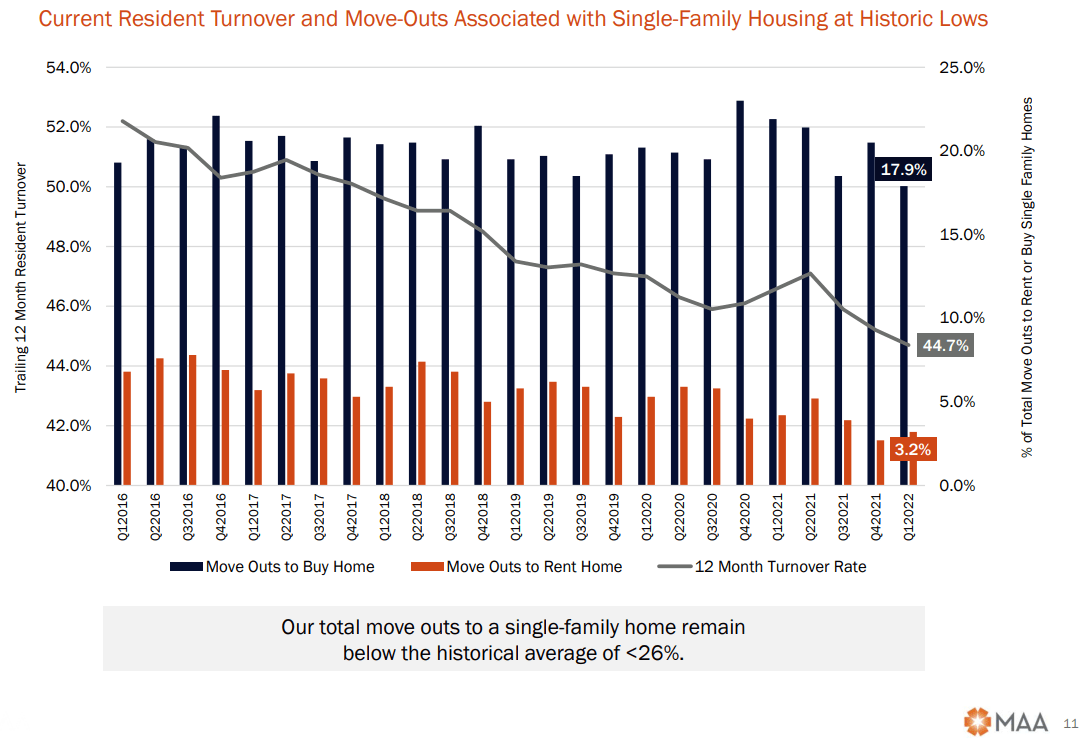
What do you think drove that? Probably the combination of high single-family home prices and higher interest rates. But is it just my opinion? How about a quote from MAA’s Q2 earnings release:
Eric Bolton, Chairman and Chief Executive Officer, said, “Leasing conditions across our Sunbelt markets remain robust as strong job growth, positive migration trends and the higher cost of single-family homeownership fuels a growing demand for apartment housing. Results for the second quarter were ahead of expectations, and we have again increased our outlook for growth in Core FFO performance for the year.”
How about that? The higher cost of single-family homeownership is fueling demand for apartments and leading to increased guidance. All 6 major apartment REITs have increased guidance for AFFO per share. We’ll go over that in greater detail deeper in the article.
Are higher interest rates really reducing the construction of new homes though? Absolutely. Though the impact can be lagged a bit, especially for apartment homes.
Projected multifamily supply shows that new construction starts are expected to drop off rapidly in the coming years:
CPT, Light Blue note by author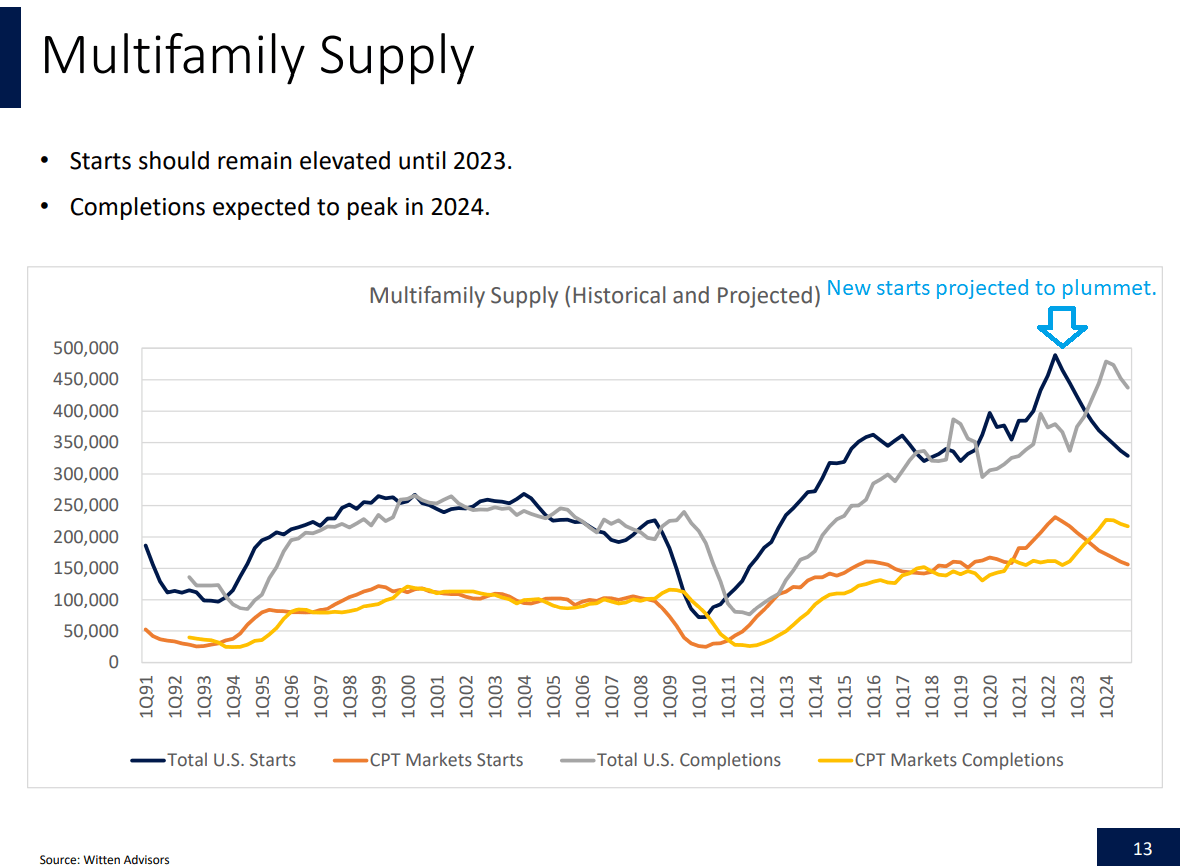
With financing becoming more expensive and greater uncertainty, developers are responding to market forces. Likewise, they responded to low interest rates by increasing new projects from 2015 to 2022.
Mortgage Rates vs. Rent
Assuming no change in loan amounts, what’s the difference in the P&I (principal and interest) payment between a 30-year fixed-rate mortgage at 3% and 6%?
The difference is 42%.
For each $100k borrowed the payment climbs from:
- $422 (at 3%) to
- $600 (at 6%)
When the payment for principal and interest increases by 42%, moving out to purchase a home becomes vastly more difficult. Even if home prices dropped by 10%, it wouldn’t come close to offsetting the change in mortgage rates.
A Surprise for Me
At the start of this year, I didn’t expect the Federal Reserve to be so devoted to pushing rates higher. Key members had already admitted that they couldn’t do much to fix supply. Since they couldn’t fix inflation, I concurred with the global bond markets for Treasury rates. Instead, the Federal Reserve has been pushing rates aggressively.
In addition to raising short-term rates, they’ve insisted that they will keep short-term rates elevated. That insistence helped to push longer-term rates higher (and markets lower). Due to the sharp increase in Treasury yields and increase in volatility, we’ve also seen a sharp increase in mortgage rates.
With mortgage rates climbing further than expected, we’ve seen stronger rent growth than expected. My initial expectations for rent growth had been confirmed by Equity Residential’s (EQR) data on effective rental rates for new leases by month. However, ZORI suggests that rental rates are growing faster than EQR’s data would have suggested.
The surprise for me regarding apartment REITs is the magnitude of the rental rate growth seen over the last several months.
Prior Expectation
Market rent growth (month-over-month) was slowing sharply by late 2021. The last of the “cheap 1-year pandemic leases” were signed around June 2021. Therefore, starting in Q3 2022, I expected leasing spreads to decline since new leases would replace leases signed in Q3 2021. The spreads would still be decent, but not dramatic. To demonstrate this concept, a table works best. This table is hypothetical, but it demonstrates the way I previously expected leasing spreads to develop into the back half of 2022:
The REIT Forum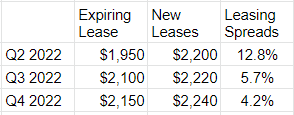
Market rents would have been rising into the back half of the year, but the growth rate (leasing spreads) would’ve been falling off dramatically. That was the old view.
In this scenario, AFFO per share growth (which was extremely high) would be moderating. By Q3 2022, none of the cheapest leases (shown at $1,900 in the hypothetical table) would remain. In Q3 2022, they would still be raising rents on about one-fourth of tenants (assumes 1-year lease terms and even distribution of lease expiration for simplicity) but the incremental gains would only be in the 4% to 6% range rather than the double-digit gains we had seen before.
Revised Expectation
While year-over-year growth rates in asking rents (which are similar to leasing spreads) are indeed falling, in July it was still solidly in double-digits (13.2% on average across the country). Month-over-month rent growth finally cooled in June and July 2022, coming in at 1% and 0.6% respectively. That’s lower than the recent trend, but even 0.6% would annualize out to over 7%.
Thanks to higher mortgage rates, we could see rents continue to trend higher at an elevated rate. Therefore, we should expect Q3 2022 and Q4 2022 leasing spreads to be materially better than I previously expected. Likewise, Q1 2023 is starting to look better since market rents increased so much between Q1 2022 and today.
Translating that into the income statement, it means revenue per share and AFFO per share for 2023 should be higher than I previously expected. That is the natural result of higher-than-expected leasing spreads. To be clear, that absolutely does not mean a repeat of the massive leasing spreads seen in Q2 2022. However, I previously expected spreads to plunge from Q2 2022 to Q4 2022 and now I expect a more gradual decline.
Headlines
You will probably see headlines indicating that “Median asking rent slows….”
Year-over-year the figures will absolutely slow because we were looking at metrics as high as 15%. The growth rate slowing is no surprise. We knew that would happen. It had to happen. 15% year-over-year growth in residential rates is not sustainable. So, while the market is shifting to fear about slowing growth rates, we’re saying:
Hey, it isn’t slowing as much as we were forecasting. That’s impressive! Based on the change in mortgage rates, rent should outperform our expectations for a while longer. That drives elevated growth in AFFO per share.
Our expectation for growth rates to slow and investors to overreact is the reason we hadn’t purchased shares of an apartment REIT since early 2021. We held on to some of our apartment REIT positions, but we also closed some out in the second half of 2021.
History
To demonstrate our history with housing REITs, I filtered our open and closed positions to only show:
- Apartment REITs (in green)
- MH Park REITs (in blue)
- Single-family rental REITs (in orange)
The charts are shown below:
The REIT Forum The REIT Forum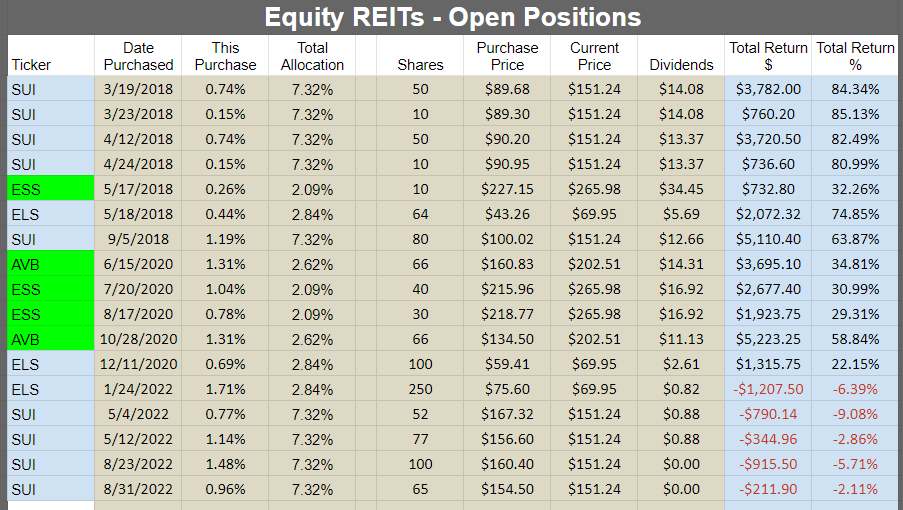

Disclosure: I think I caught every line, but I could have missed one due to human error in filtering.
In July and September of 2021, we closed out some positions in EQR, ESS, and AVB.
Closing those positions in 2021 looks good now, but it didn’t look so great in April 2022 when the apartment REITs were still setting new all-time highs. For reference, EQR dropped from a record high of $94.32 in April to $73.80 (down 21.8%).
An Interesting Dynamic
During Q1 2022 earnings, CPT provided the largest increase in guidance. Since then, ESS provided the largest increase:
Initial Mid stands for the initial midpoint of guidance. (Author’s Calculations, Data Collected from Company Releases)
Note: ESS modified guidance between the Q1 2022 release and the Q2 2022 release. Consequently, the Q2 2022 release shows a smaller “increase”. I calculated the increase % using the Q1 guidance and the Q2 guidance.
Year-to-date, the largest total cumulative increases come from CPT and ESS. However, since CPT raised targets so much during Q1 2022, their increase for Q2 2022 came in a bit smaller.
What I find interesting is that despite CPT competing for the largest increase in guidance, it also has the largest decline year-to-date as seen in the $100k chart:
The REIT Forum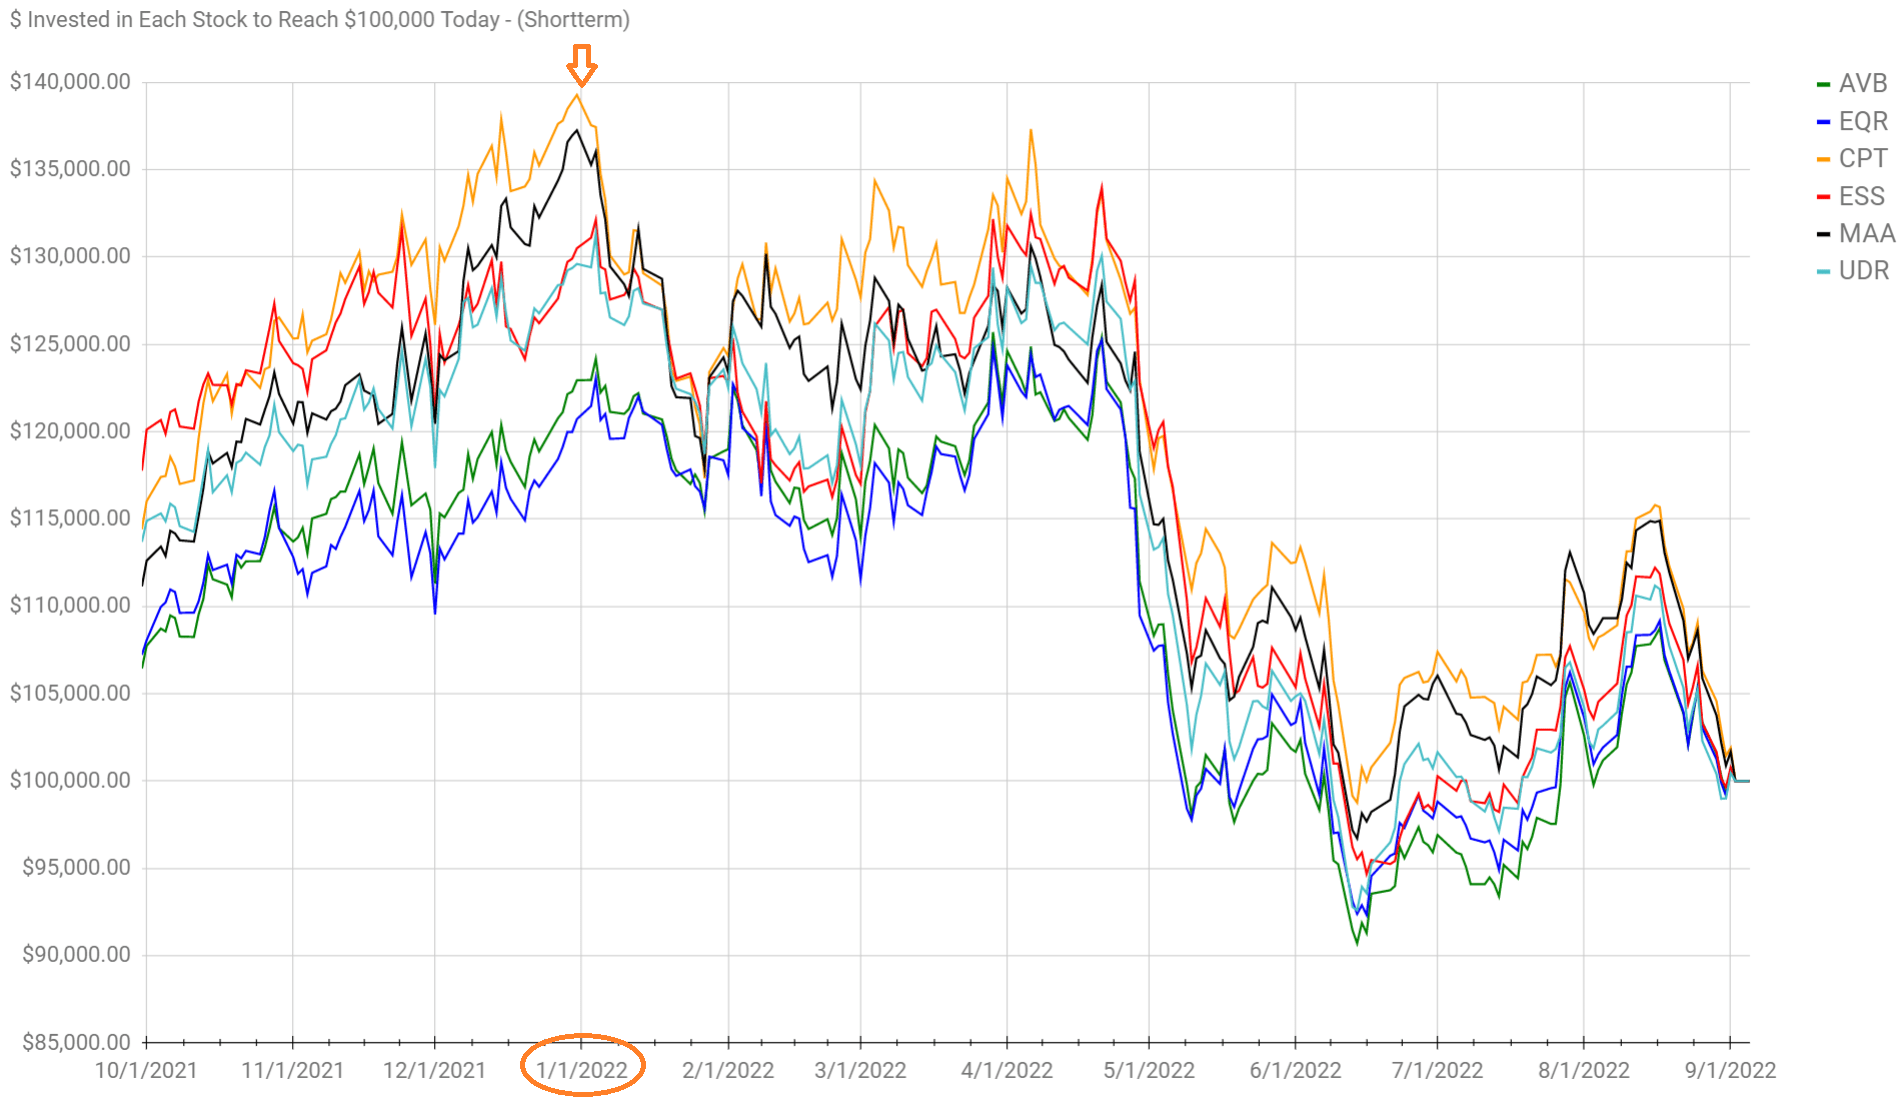
That is a staggering drop for a REIT that already raised guidance for FFO per share by 5.4%. That’s not just FFO per share growing by 5.4%, it is guidance being increased by 5.4%. The implied growth rate over 2021 is 22%.
Same-property NOI guidance started the year at a blistering 12%, which was increased to 13.75% and then increased again to 14.75%.
As shares cratered from a high of $178.68 to close at $126.69 (down 29%), the underlying properties performed very well. If you look at CPT contrasting share price with consensus NAV estimates, you’ll notice things got pretty wild:
TIKR
What if we chart the price with FFO or AFFO estimates?
TIKR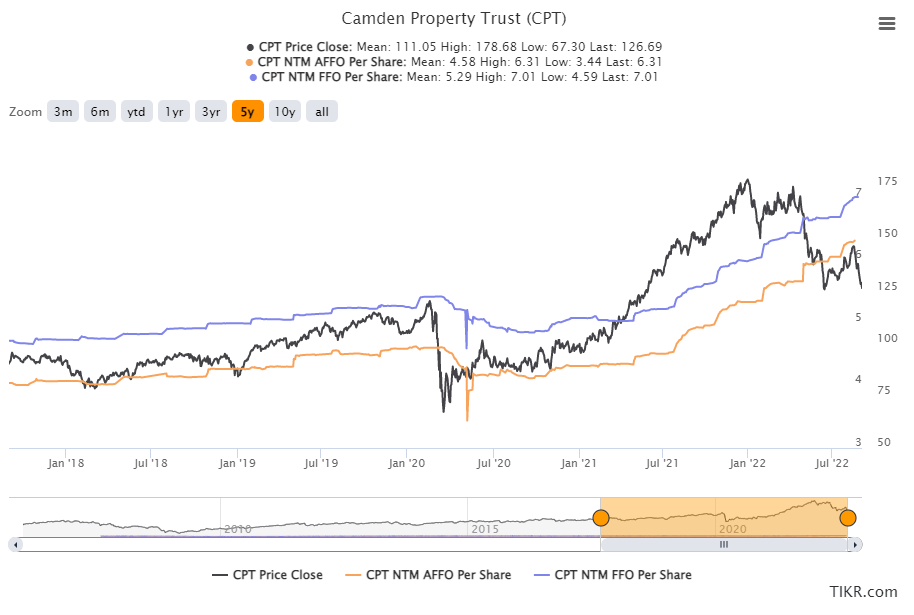
Both of those forward estimates are at all-time highs. Indeed, the forward FFO and AFFO estimates deserve to be at all-time highs. That makes sense given the massive increase in rental rates and the tailwind from mortgages becoming even more expensive.
Will Interest Expense Destroy Growth?
Are higher interest rates going to destroy CPT with higher interest expenses? No. CPT’s leverage is low and the debts they will need to refinance do not carry absurdly low rates. The expiring debts were not issued at the prior bottom in interest rates. Therefore, the rates shouldn’t be increasing dramatically.
Interest expense shouldn’t be a huge headwind:
CPT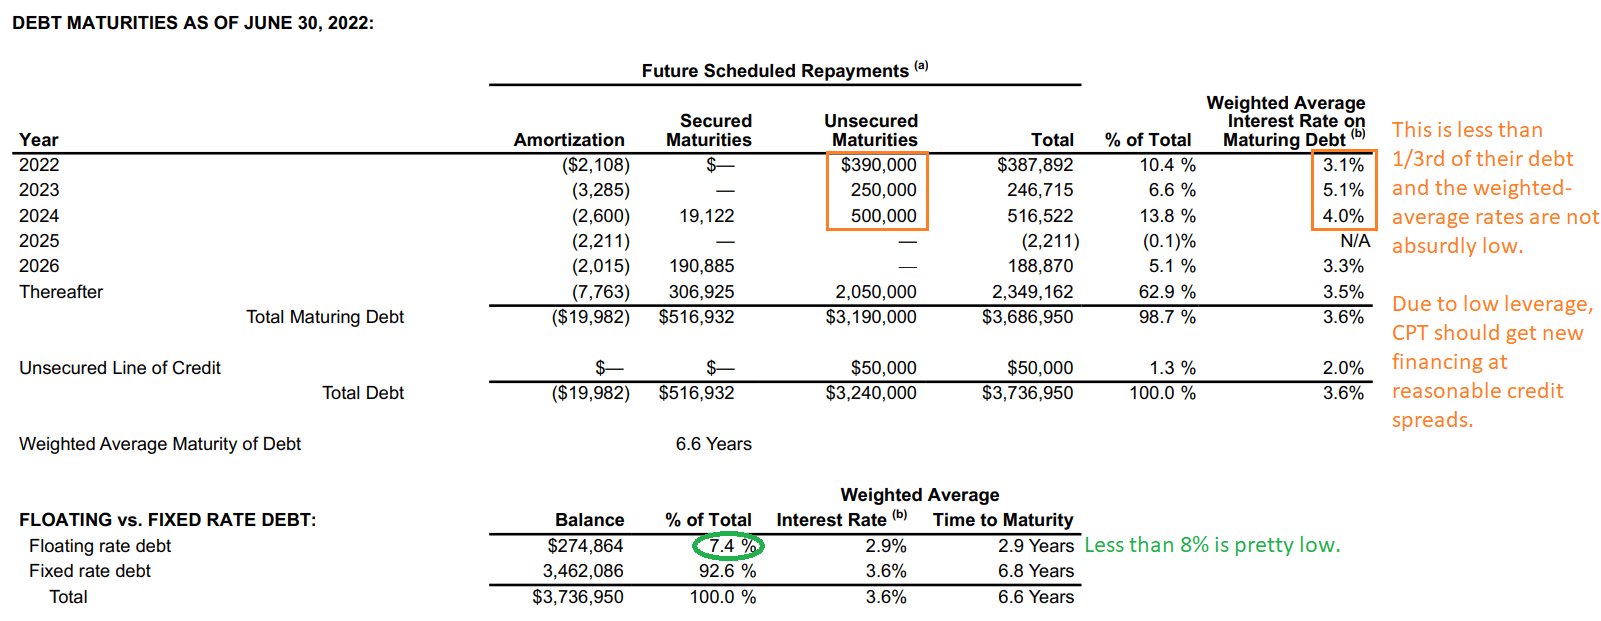
How much would higher interest rates impact AFFO per share? We can do some quick math. There is $1.14 billion of debt (rounded) coming due by the end of 2024. The weighted average rate on that debt is 3.93%.
If we assume CPT rolled over that debt at 4.93%, interest expense would increase by $11.4 million per year which is $2.85 million per quarter.
CPT’s Analyst AFFO (which deducts recurring capitalized expenses) was $158.5 million for Q2 2022. The impact would be 1.8% of Analyst AFFO. That’s rolling over all maturities for the next 3 years. CPT has some floating rate debt also, but some of the maturing debt is the floating rate debt and we don’t want to count it twice.
On a per share basis, it would be $.026 per share per quarter compared to Analyst AFFO per share of $1.44. I won’t say the impact is a rounding error, but it’s a tiny bump that is easily absorbed by the enhanced growth in rental rates. Stronger growth in rental rates should add far more to AFFO per share over the coming years than the 1.8% lost to interest.
While we’re drilling into this value for CPT, I want to highlight that EQR, AVB, ESS, MAA, and UDR also have strong balance sheets. None of the big 6 should be crushed by interest expense.
Target Updates
The following updates are now live in the spreadsheet:
The REIT Forum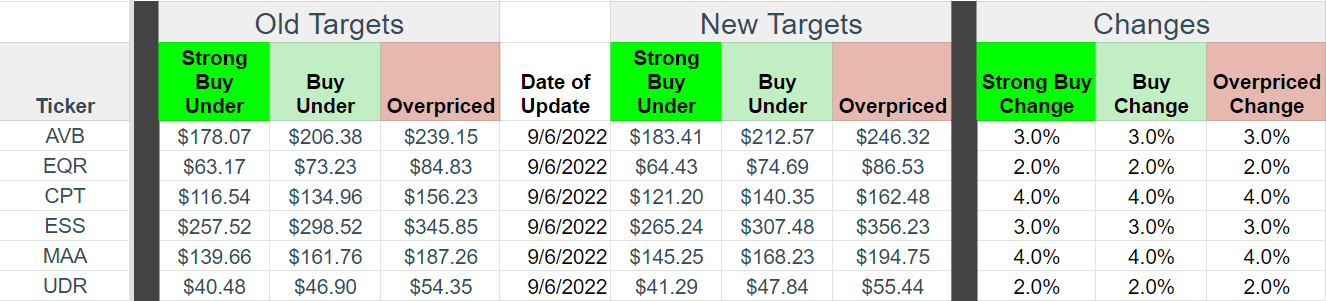
The most interesting REITs at the moment are CPT and ESS.
We have no position in CPT yet but would be interested in opening a position. It’s been rare to have a bullish rating on CPT in the last 18 months and shares suffered an unusually large drop. I can’t recall the last time CPT had the second largest discount to our targets. CPT also offers some nice diversification for our geographic exposure along with a risk rating 1.0.
On the other hand, ESS offers the largest discount to target prices. The risk rating is slightly higher at 1.5, but that’s still a low rating. However, we already have an allocation to ESS slightly larger than 2% and AVB (our other position) has more overlap with ESS.
Be the first to comment