

imaginima/E+ via Getty Images
Last summer, I came out with an article titled “$100 WTI Crude Oil: Here It Comes In The Next Quarter” (linked here). Although I was off on the timing as I expected WTI Oil to get to $100+ by early Q4 2021, it did end up getting past the target price in Q1 2022. At the time, the current month’s futures contract for WTI was going for around $63. Currently, it’s at $97.78 at the time of writing.
Going forward, I wanted to revisit the thesis and talk about what I believe is ahead.
If you haven’t already, I would encourage you to read the previous article (linked here).
Summary Of Previous Thesis
Last summer, I had three main reasons as to why I thought oil prices were headed higher. They were the following:
1. Shortage of Supply
At the time, I talked about a shortage of supply of oil due to large divestments from investors and existing E&P companies. This was due to ESG and a 13-year period of deeply negative returns during the shale revolution, among many other reasons such as high amounts of regulation.
This led to a situation where it was very hard to get financing. Previously, due to high investor demand for E&P equities, the PE multiples for the stocks were higher. This would make the WACC (Weighted Average Cost of Capital) extremely low, so companies only needed to make a low ROIC on their CAPEX and M&A activity. Now that multiples have contracted, they need far higher ROICs to justify issuing stock.
For example, a stock with a 20 PE ratio has a WACC of 5%. This means the company can issue the stock for 5% WACC and say invest the capital at an ROIC of 10%, making 5%, the difference.
Now let’s say the company’s stock is at a 5 PE ratio, so its WACC is 20%. This means that it doesn’t make sense for the company to invest in a project generating an ROIC of 10%, as their WACC is far higher than that. Now, to justify that same project, the ROIC needs to be 40%+, due to the higher WACC and the significant risk taken on the project.
Investors demanding higher returns and creditors have exited the market leading to a shortage of supply.
2. Continuing Rising Demand
At the time, I expected demand to continue higher. Already, demand was trending higher and I expected that to continue. On top of that, I thought we were heading from a pandemic to an endemic phase where we would see demand coming back. On top of that, fiscal stimulus at the time had made it so that individuals and institutions had more disposable income, through stimulus checks, unemployment benefits, PPP loans, etc., which would be spent and create more demand for energy.
3. Higher Inflation
The last reason I mentioned at the time was inflation. Since oil is priced in dollars, as the dollar weakens, oil prices go up. At the time, I had said that inflation was not transitory, which the Fed at the time was claiming it was, and that we would see far higher inflation due to excessively open monetary and fiscal policy, which we are currently seeing.
My Thesis Moving Forward
I wanted to revisit those three points to see if they still fit the current environment.
Supply Shortage
First, let’s revisit the supply side of the issue.
Below is a chart of WTI Crude Oil production over the last 3 years:
US Crude Oil Production (Macrotrends)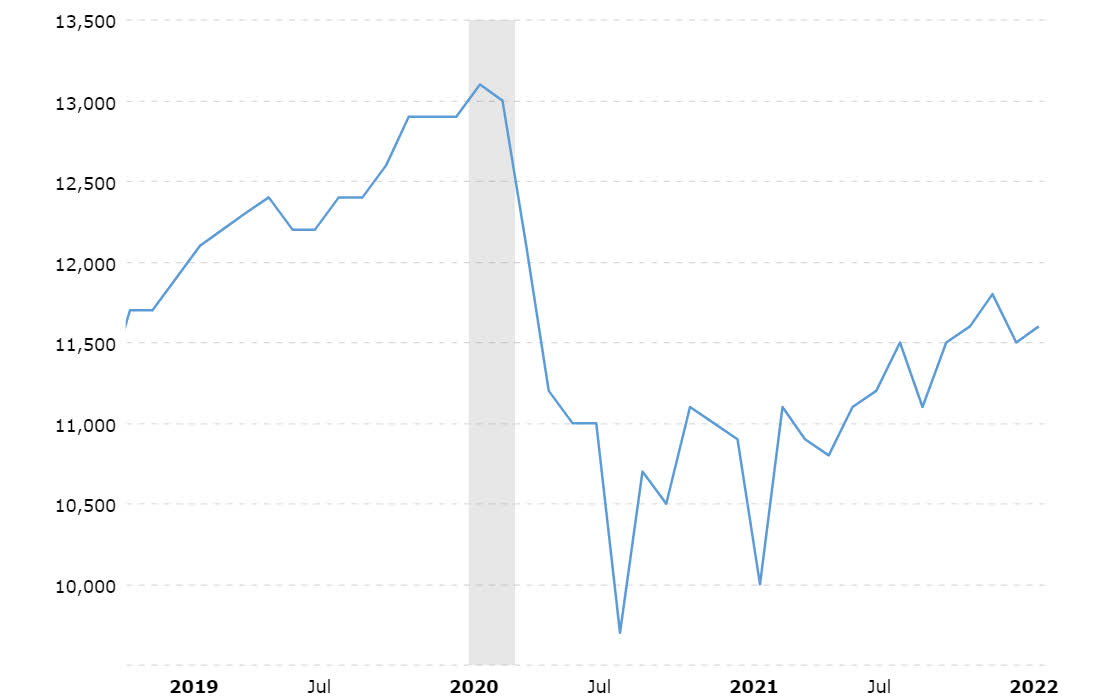
As can be seen, we had a large drop in production from January to July of 2020. Since then, though, production has gone up, albeit a lot slower than many expected it to.
With prices across the curve higher, I expect that production will continue to go up at this slow and steady pace.
The main reason that many E&P companies didn’t bring more supply onto the market before was that the returns weren’t large enough based on what the market was pricing in on the whole futures curve. Before, we would see the front-month crude contract jump to higher levels ($70+) while the back months’ futures (1-2 years out) on the curve stayed at lower levels ($50-$55). Now though, not just has the front end of the curve gone up, finally, the back end of the curve is going higher.
Below is the December 2023 WTI Price Chart:
CLZ2023 Daily Price Chart (TradingView)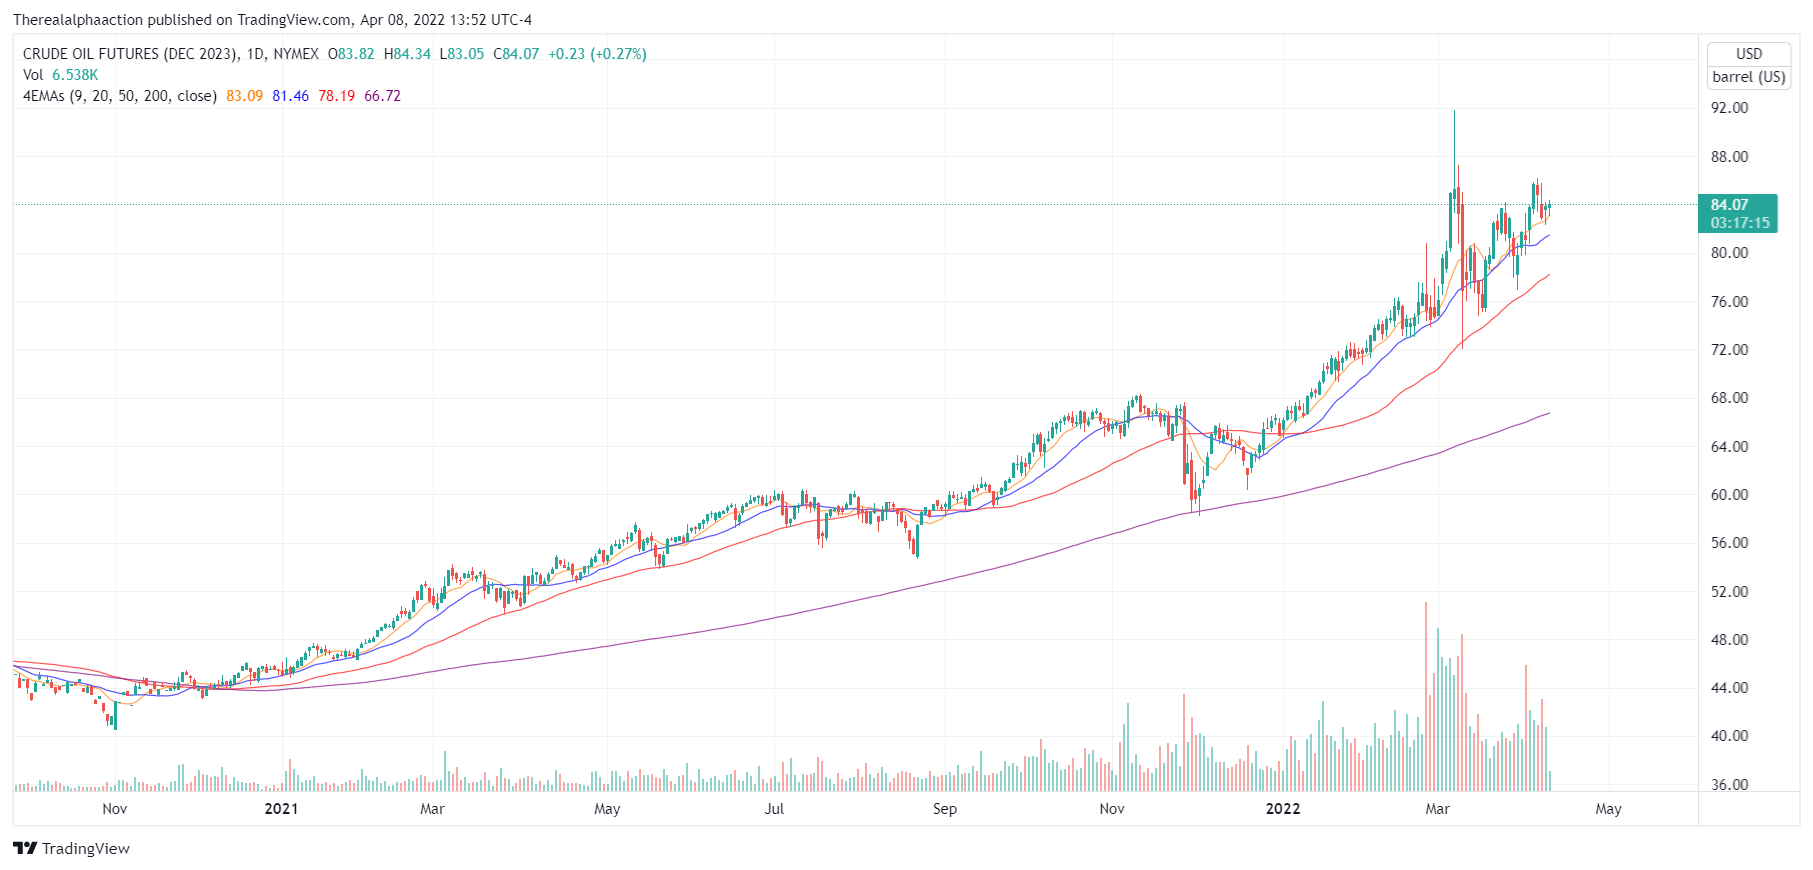
As we can see, the price further out on the curve has gone up to the $72-$92 range. Now, it is becoming more profitable for E&P companies to invest in CAPEX due to higher prices across the curve. This is largely why we are seeing production going up, with the caveat that production isn’t going up at the same speed it was many years ago due to higher returns being demanded from investors and lower leverage being demanded by creditors causing a higher WACC, as we talked about earlier.
This is why I believe that more supply will come on the market, but not enough to supply demand over the longer term.
Demand
This is where my views are changing significantly. Last time around, I thought we would see higher demand, which we have, but now my view is that we will see lower demand over the next 6-18 months due to a slowing in the economy.
The first reason I mentioned that we would see high demand is that we would move from a pandemic to an endemic. This has largely played out over the last couple of months with higher demand and it has ultimately all been priced in with higher prices.
The second reason I thought we would see higher demand is because of excessively loose fiscal and monetary policy.
Since then, I believe the tide has changed and fiscal and monetary policy will get far tighter.
First, let’s talk about the fiscal side. After March of 2020, the public was demanding that there be more stimulus during the weak economy at the time, which is why bipartisan efforts were made to pass stimulus checks, PPP loans, unemployment benefits, child tax credits, etc.
Since then, though, things have taken a full turn. Now that we are seeing a shortage of labour, not a surplus like we had two years ago, the need for stimuli is lower than ever. On top of that, more and more consumers are seeing inflation and are quick to blame it on excessive fiscal spending. Because of this, policymakers, largely Republicans, but also a number of Democrats such as Joe Manchin and Kyrsten Sinema are against more fiscal stimuli, which is why bills such as the Build Back Better didn’t pass and likely won’t pass till the midterms are over. Policymakers who vote against these bills can tell constitutions, “we’re trying to lower inflation by voting against more spending”, as a way in which to pander to voters for the midterms.
It becomes very hard in an environment like this to justify higher spending.
The other side of things is the monetary side.
About a year ago, the Fed was still saying that inflation was transitory and that they weren’t even “thinking about” raising rates. Since then, though, the Fed has started to tighten significantly. So far, we’ve seen a 25 basis point hike; the Fed has said, and the market has priced in, 50 basis point hikes every quarter over the next year.
This environment is likely to lead to a recession. This is because when the Fed raises rates on the front-end of the curve, it causes yields on the shorter-end of the yield curve to go up while rates on the longer-end of the curve don’t go up at the same amount making for an inverted yield curve. An inverted yield curve has a very good track record of predicting recessions.
Moreover, with the current amount of indebtedness we have, it becomes extremely hard to sustain higher rates. In December of 2018, the markets crashed 20%+ due to Fed funds rates getting hiked to 2.5% quickly. It is likely that if rates go up at a similar speed again, we will see the equity market go down in a similar manner.
A recession is likely to bring lower demand; along with that, the Fed won’t be able to react as quickly as it has in the past due to high inflation. Because of this, the Fed will likely have to continue to raise rates into a recession, likely making the recession worse. On top of that, we won’t have the fiscal support we had in March of 2020, as it becomes harder to justify fiscal support in times of high inflation.
Inflation
The third reason why I was bullish was rising inflation. In the long-term (10+ years), I’m still bullish on inflation, but in the medium term (6-18 months), I believe that we will likely have asset price deflation and consumer price disinflation, due to being a recession.
Usually, asset prices go down during a recession. This causes lower demand for oil due to a reverse wealth effect. Along with that, consumer prices are usually stagnant due to a sudden drop in demand while the supply of inventory for those goods is still high.
Money supply also contracts during recessionary periods. This is because most money supply is created by commercial banks. Commercial banks create more money when they issue credit.
For example, if you put $1 in your bank account, the bank loans out that $1 so the $1 is put in someone else’s bank account; but you still see that there is $1 in your account while the borrower sees there’s $1 in his/her account. So now effectively, the bank took your $1 and turned it into $2 of total money supply. This money multiplier effect has an inflationary impact. In times of recession though, banks don’t lend as much, so the money supply won’t grow as much. On top of that, if a loan is bankrupted, then the money supply can contract and have the opposite impact.
On top of that, during a recessionary period, the dollar becomes a safe-haven currency. This is because most debts worldwide are owed in dollars. We are already seeing this as the Dollar Index has rallied to 100 from its bottom at 89.
Below is a chart of the Dollar Index (DXY):
DXY- Dollar Index Price Chart (TradingView)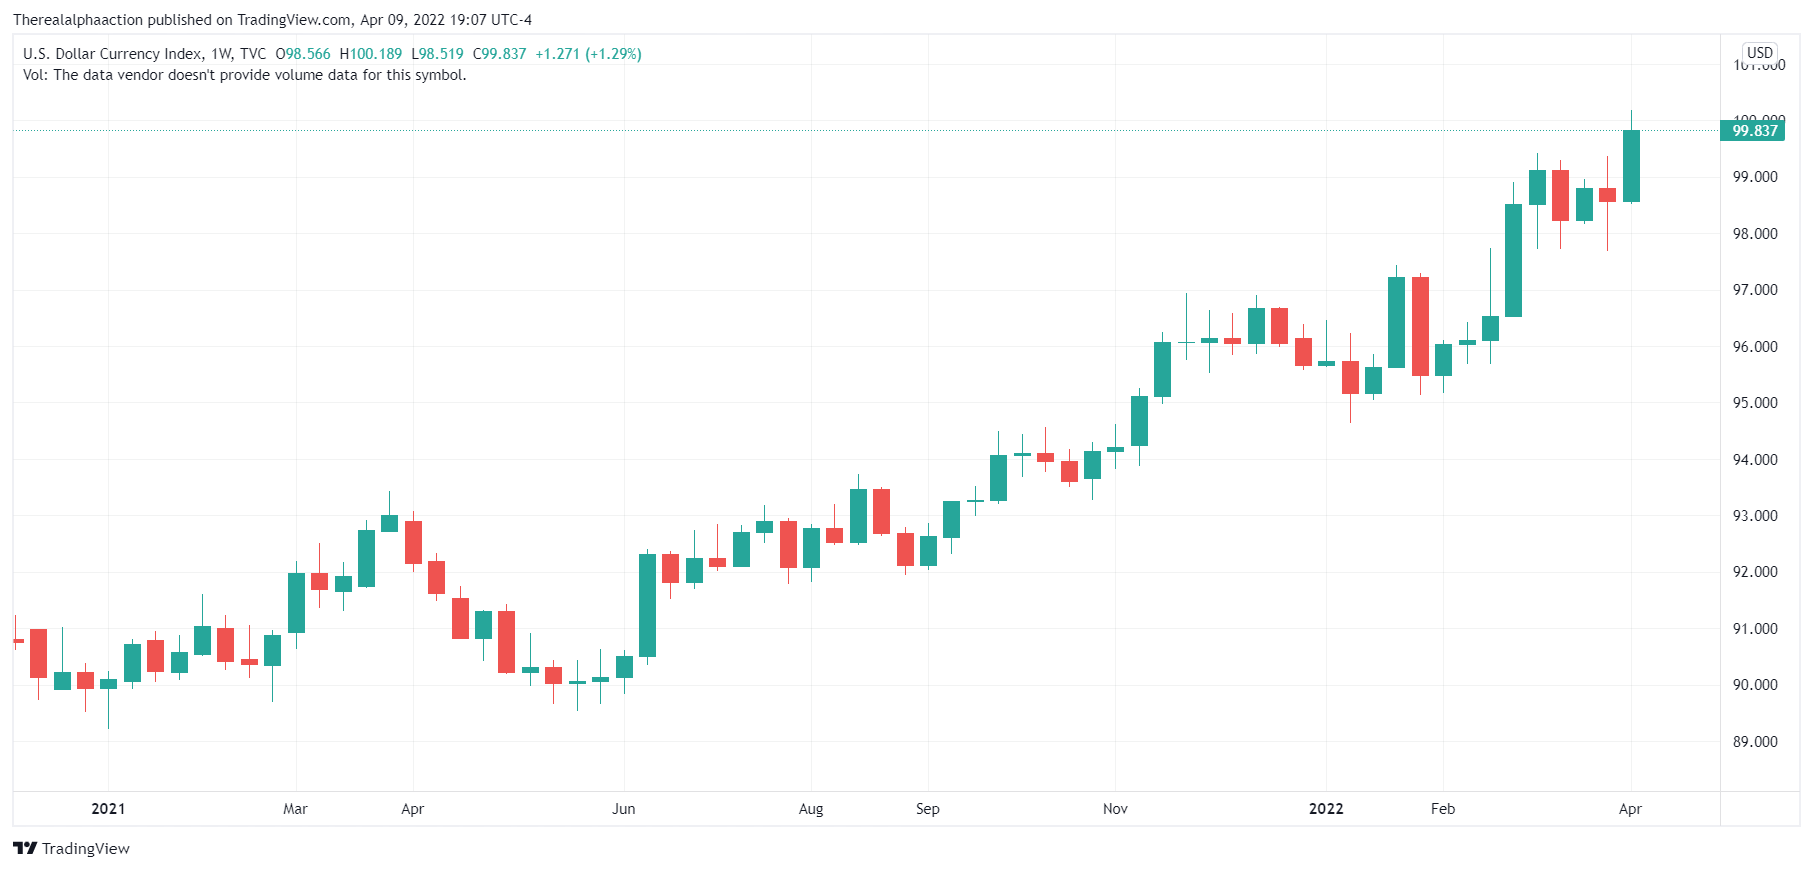
As can be seen, the Dollar Index has already rallied and this trend will likely continue as the dollar is seen as a safe-haven currency.
The above reasons are why I believe that the amount of inflation we’re having will slow down in 2023 until the Fed and Congress eventually make a pivot, and we get even higher inflation in 2024 and beyond.
Based On This, Where Will Oil Prices Go
I expect WTI to trade between $60 and $80 based on where I expect demand to be relative to production.
Below is a chart of oil consumption:
US Oil Consumption (Peak Oil)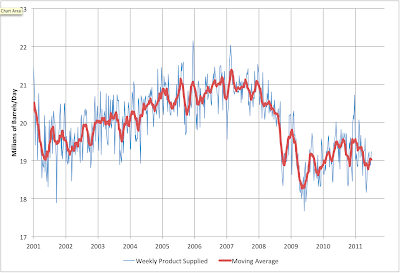
Here’s an additional source; a link to CEIC Data, providing real-time data on oil consumption in the United States.
Previously, during the GFC, oil consumption went down by 30% in the US. Currently, the WTI spot price is around $100. Assuming all other factors say the same, the spot price would drop to $70 in that scenario; the further out futures contracts likely wouldn’t change much, as they are already low and have priced this in. This makes for a range of around $60-$80.
Trades For This Thesis
There are a few ways to play this thesis. Although I believe oil prices will go slightly lower, shorting oil would be a bad bet, as there isn’t much asymmetry to the trade, and there is a carry as oil is in backwardation. This is why I believe the price that futures contracts have priced in is a fair price and matched my thesis.
This is why I’m currently not a fan of taking a large directional bet either way on oil, as mid-term WTI Oil futures aren’t too over or underpriced in my opinion.
Instead, one of the best ways to take advantage of this is to get long blue-chip E&P equities. These would be companies like SandRidge (SD). They go for cheap multiples, usually below a forward PE of 4. They also have very little debt, are buying back stock, and have lots of cash on the balance sheet providing liquidity. Even if the price of oil drops substantially, companies like this would be able to use the cash they have to buy back more stock as the price goes lower, putting a floor on the stock price, and due to a large amount of cash, they can withstand volatility in their cash flows. Also, since oil futures are in backwardation, you make a carry for being long oil. E&P companies are priced based on oil futures, so they effectively also make a carry as time goes on.
SandRidge is one example, but there are many such companies out there; there are also ETFs such as XOP which offer good exposure, or other more unique ways, such as the oilfield services and E&P, private M&A and private placement deals, which is how I’m taking advantage of this.
Risks
There are a few risks with this thesis.
The first is that I’m wrong on the upside and that instead of seeing a recession next year we continue to see the economy boom. This is unlikely as when the yield curve inverts, a recession usually follows. Oil could also go higher in a recession if there is geopolitical risk.
On the downside, there are several risks.
The first is that there is more supply than comes on to the market than expected. If this were to occur, it could send oil prices lower and into deep contango, but as I mentioned, I feel this is unlikely.
The second risk is that there is significant demand destruction due to an even more destructive recession than anticipated. If this were to happen, oil prices would go lower than expected.
The third risk is deflation. Since the dollar is seen as a safe haven currency, it is possible we could have deflation. If this occurs, commodities are likely to go down as they are priced in dollars.
Conclusion
Although I’m bullish on oil long term, I expect that oil prices will move lower over the next 6-18 months due to many headwinds. It likely won’t change till the recessionary period gets bad enough to where the Fed and Congress are forced to make a full pivot back to excessive monetary and fiscal stimuli.
Be the first to comment