

alexsl/iStock via Getty Images
Thesis
Both Realty Income Corporation (NYSE:O) and Simon Property Group, Inc. (NYSE:SPG), two bellwether stocks in the real estate investment trust (“REIT”) space, reported their Q2 earnings last week. Both reported a strong quarter and bright guidance for full-year 2022 in my view. As to be detailed in the next section, both reported strong earnings and robust operation metrics, raised full-year guidance, and also announced healthy dividend raises.
However, market responses have been different to these stocks, as you can see from the following chart. To wit, since their Q1 earnings report (“ER”) about 3 months ago, O has delivered a total return of more than 15%, outperforming the S&P 500’s 3.7% return by a wide margin. In contrast, SPG has suffered a total loss of more than 7%, lagging the S&P 500 by more than 10%. There are good reasons for such divergence given that O enjoys better earning stability (thanks to its lengthen leases) and SPG is more cyclical given the discretionary nature of its mall properties.
However, at this point, my view is that the correction for SPG has been overdone. And therefore, even though both REITs features solid financial strength and generous dividends, the thesis here is that SPG now presents a better entry opportunity.
Seeking Alpha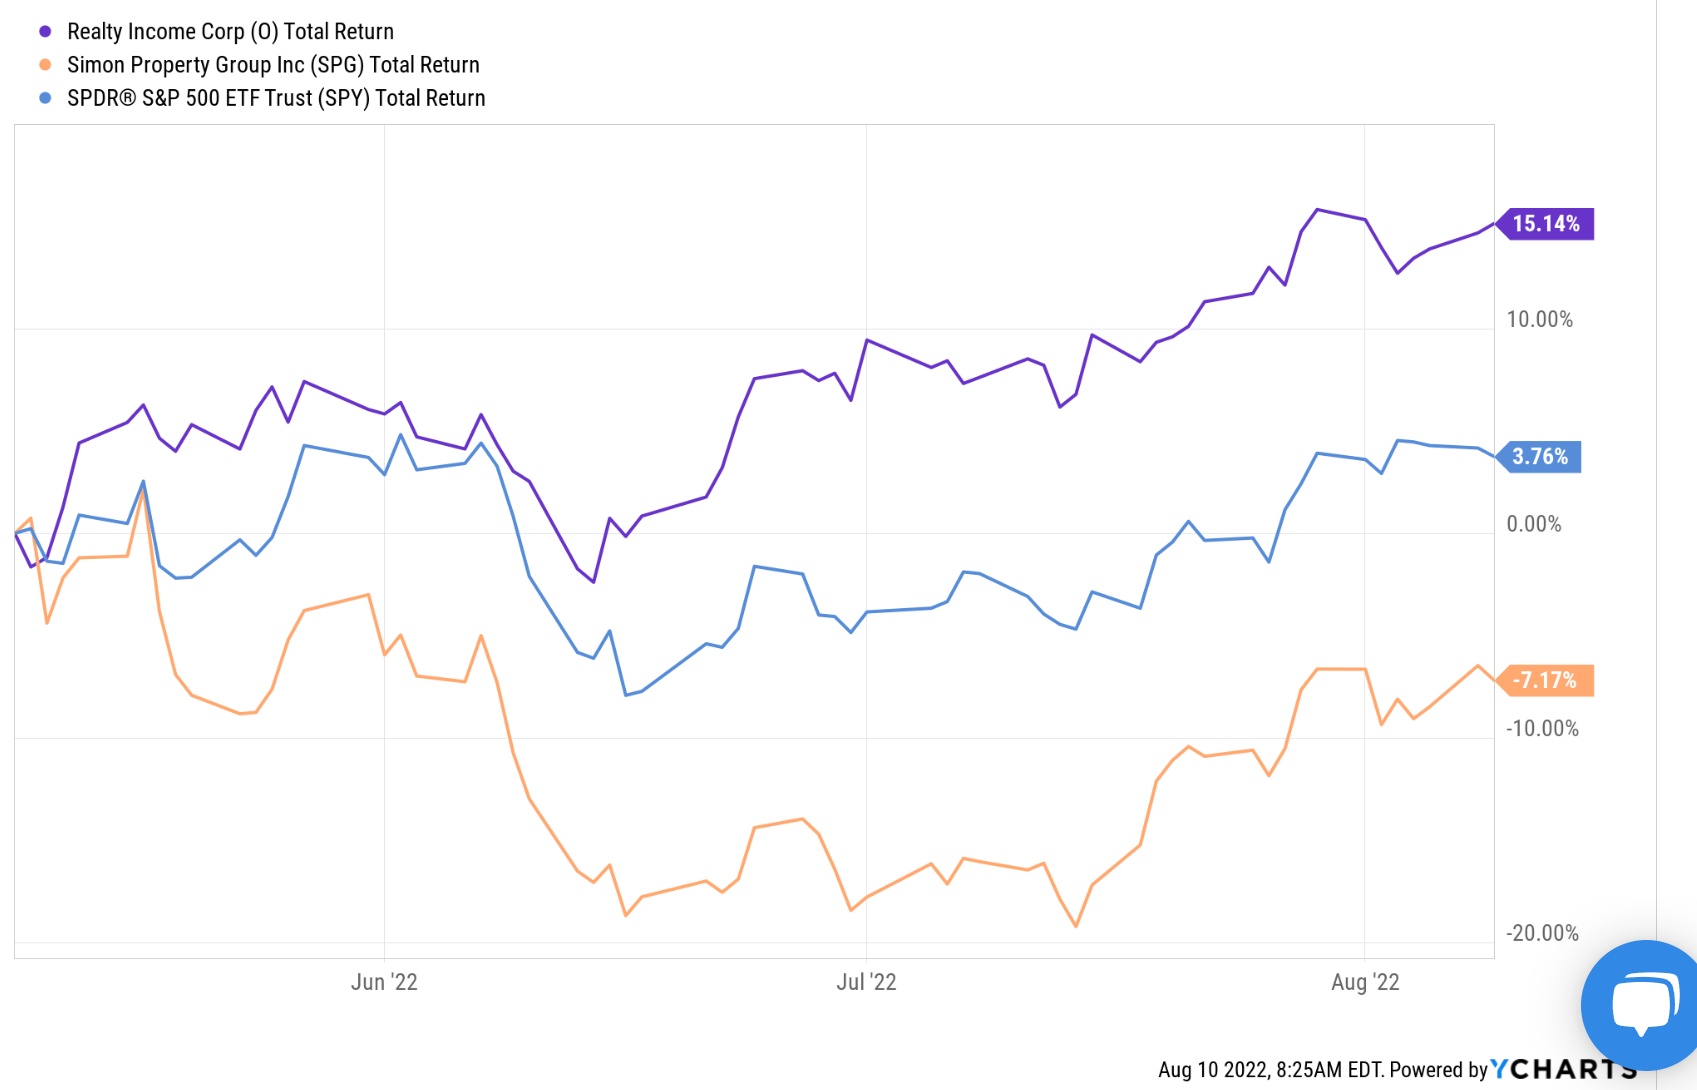
Q2 recap and outlook
Let’s start with a brief recap of their Q2 results. O beat consensus estimates on both lines during Q2. O also reported robust operation metrics. Both occupancy rate and same-store rental revenue increased. As such, it raised its 2022 guidance. Its 2022 normalized funds from operations (“FFO”) guidance is raised to $3.92-$4.05 per share now, compared to its prior guidance of $3.88-$4.05. Thanks to such strong performance, O announced another dividend raise, its 99th consecutive quarterly raise. Details are quoted below from its press release (abridged and emphases added by me):
… we announced the 99th consecutive quarterly dividend increase… The annualized dividend amount as of June 30, 2022 was $2.970 per share. The amount of monthly dividends paid per share increased 5.1% to $0.741, as compared to $0.705 for the three months ended June 30, 2021. We distributed $445.8 million in common stock dividends to stockholders during the three months ended June 30, 2022, representing 76.5% of our AFFO of $583.7 million.
After this raise, its forward dividend yield now is a generous ~4%, far above risk-free interest rates (around 2.7%). And also note that rising short-term yields have historically been correlated with realty income outperformance as you can see from the following chart.
O Q2 Earnings Report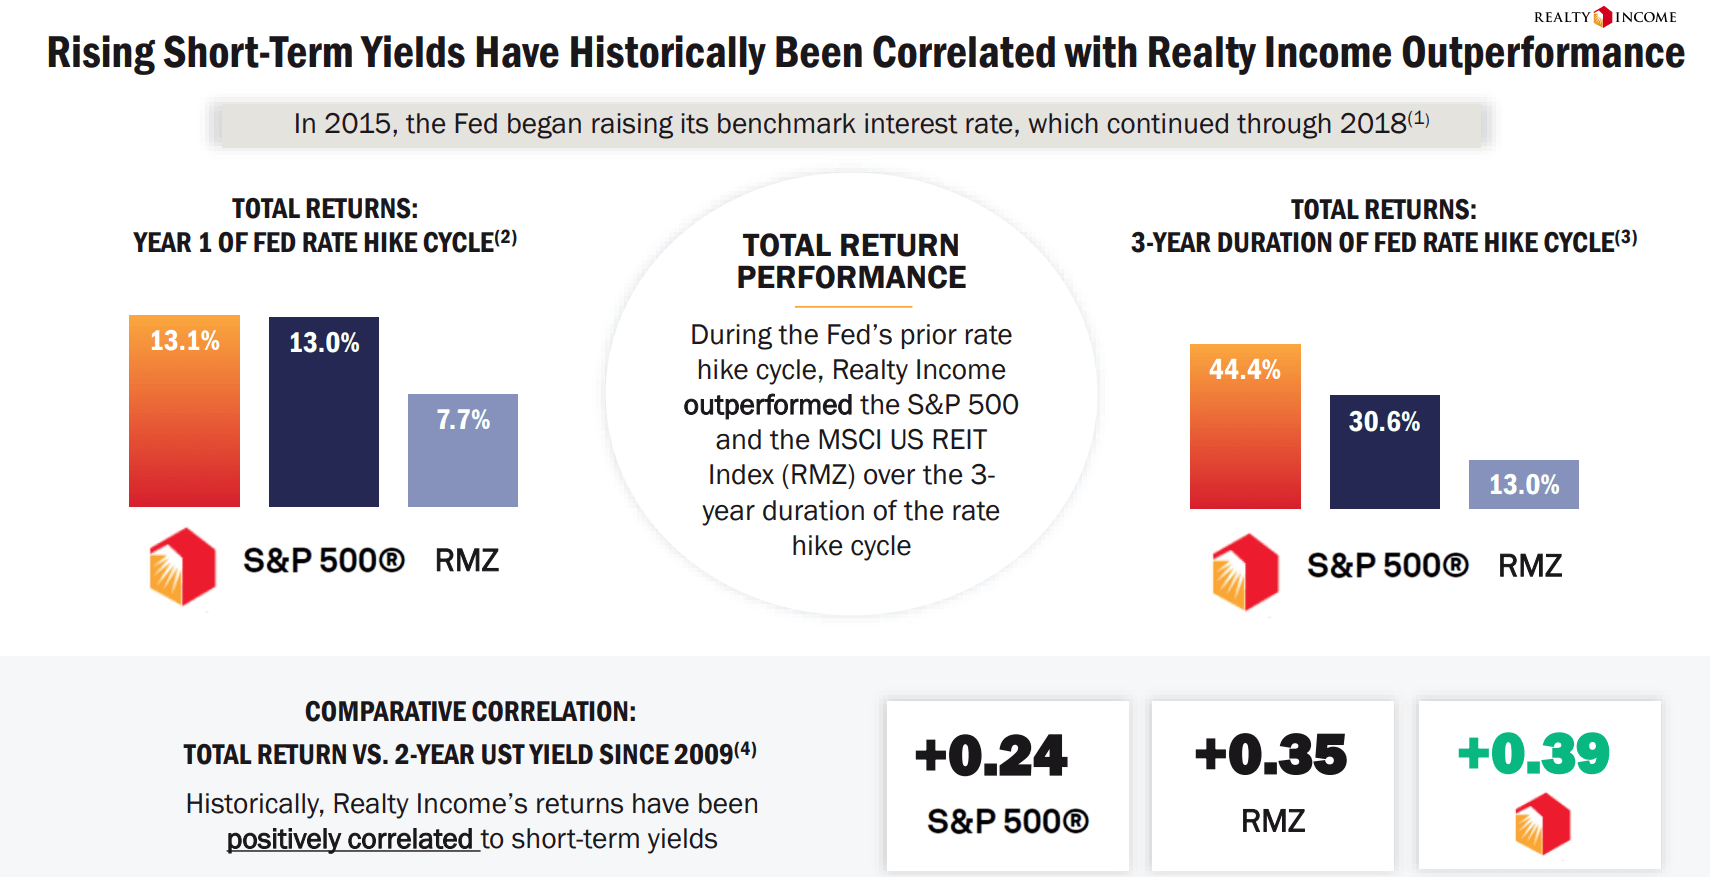
The story for SPG is quite similar. Its Q2 earnings beat the consensus estimates too. It reported strong operation metrics too. Both store occupancy increased and the rent per square foot also increased. SPG too raised its full-year 2022 guidance. It now expected FFO per share of $11.70-$11.77 for 2022, compared with its prior guidance of $11.60-$11.75. It too announced a dividend raise to $1.75 per share, representing a YoY increase of a whopping 17%.
After this raise, its forward dividend yield now is mouthwatering ~6.48%. And it’s not only far above the risk-free interest rates but also far above O.
And next, we will check if such generous dividend yields are sustainable.
SPG Q2 Earnings Report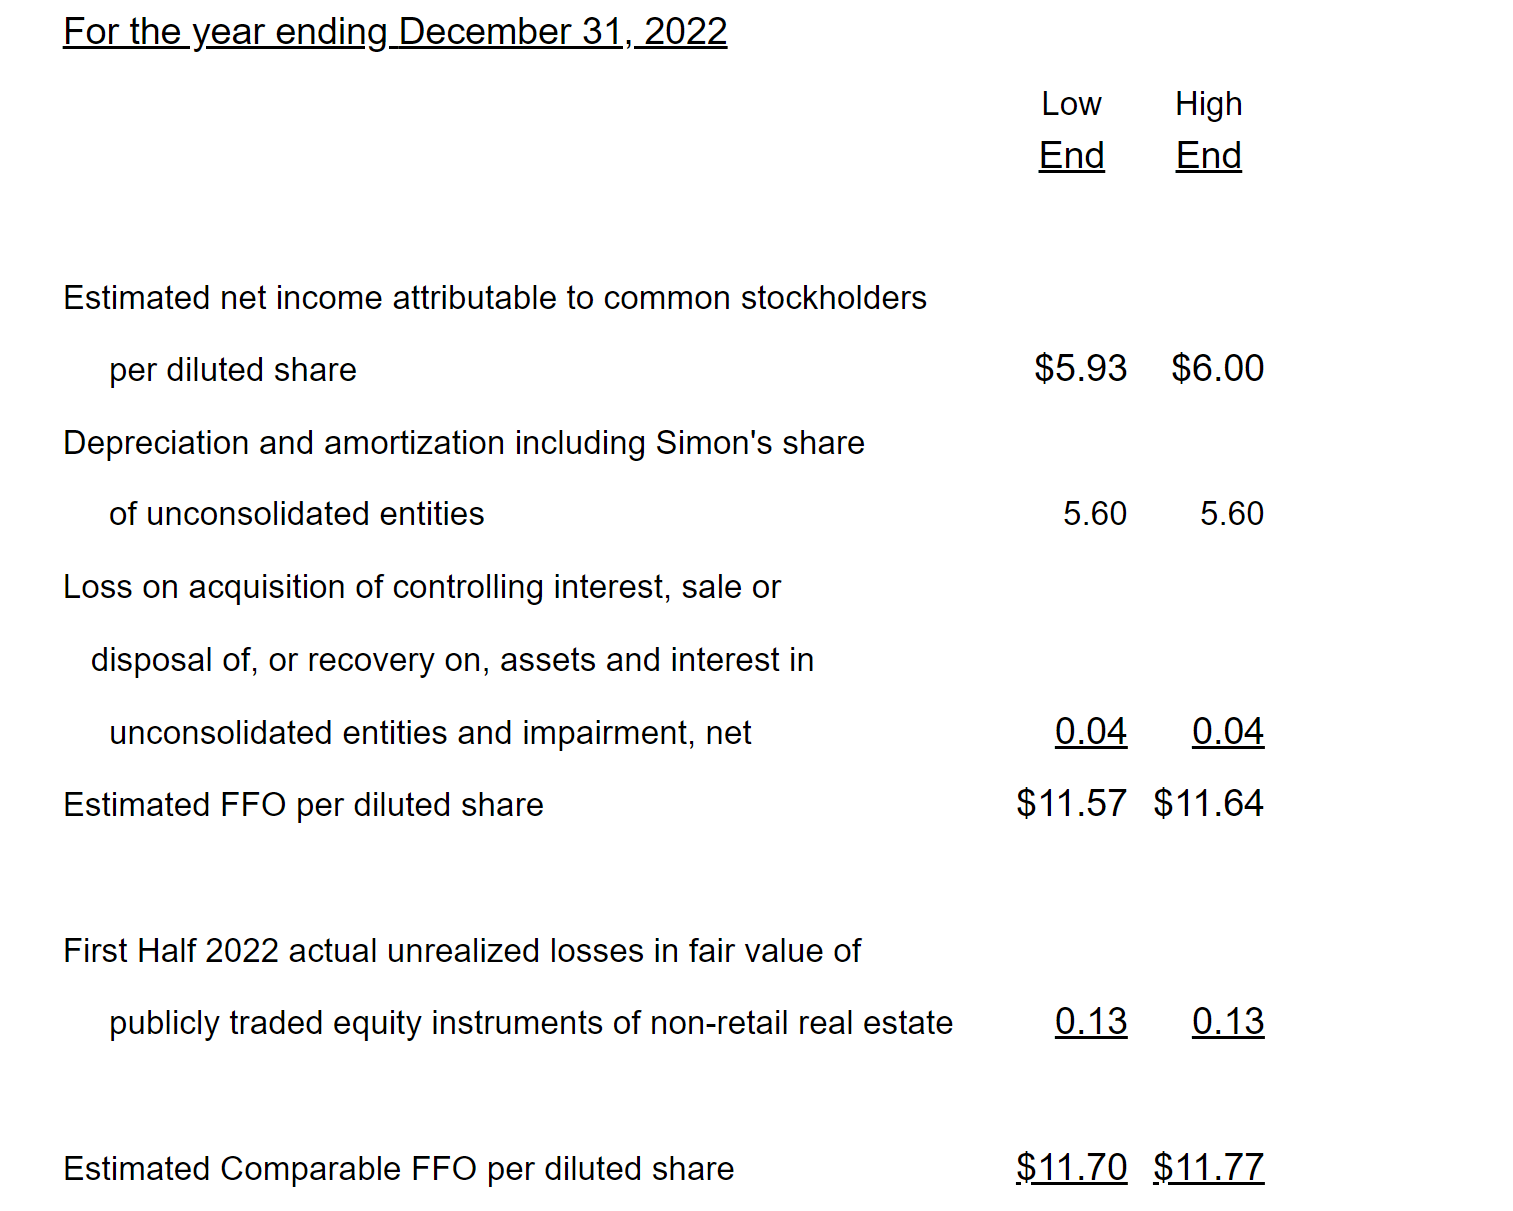
Operation efficiency and DuPont analysis
Here I will examine their operation metrics more closely to put their Q2 performance into perspective. I will follow the so-called DuPont framework here as detailed in my free-blog article,
The DuPont analysis shows that there are three knobs that management can turn to drive up profitability: profit margin (“PM”), asset turnover ratio (“ATR”), and leverage. Through simple math, we can show that the ultimate profit is just the product of these three factors.
In my mind, the asset turnover rate is a key metric for mall or commercial properties operations SPG and O. In the next chart, you can see that SPG’s asset turnover rate or asset utilization rates have been fluctuating between about 0.13% to 0.18 in the past, with an average of about 0.15. And O’s asset turnover rate has been very stable near 0.08 over the years.
Two key observations here. First, SPG’s average asset utilization is more than 2x higher than O. Of course, this does not make SPG a more profitable business (at not least necessarily) because there are other drivers at play as to be discussed next. Then secondly, you can see the cyclical nature of SPG very clearly from this comparison. As you can see, its asset utilization fluctuated in a much wider range. It dipped to 0.13 in 2013 and bottom in 2021 during the pandemic. In contrast, O’s asset utilization is quite stable, almost a flat line over the past decade. The underlying reason is O’s lease durations. Its leases are generally 15 years when initiated, providing long-term stability.
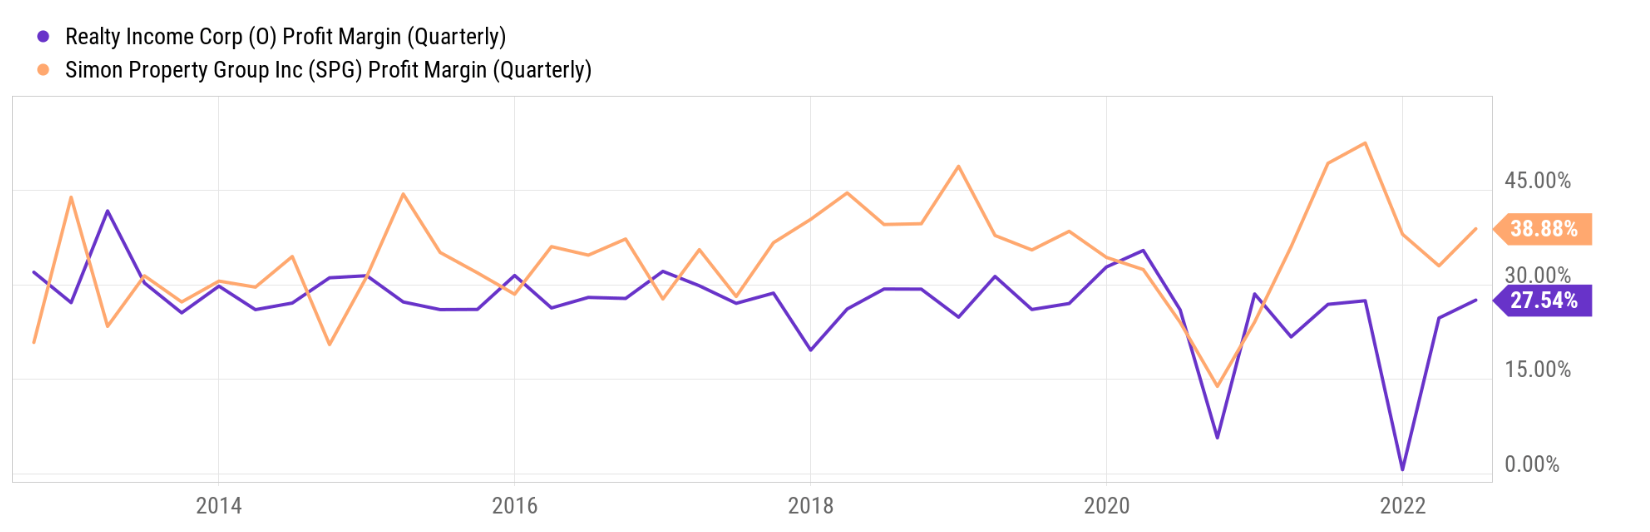
The bottom panel of the chart shows the comparison of their profit margin. And here as you can see SPG also features a higher profit margin. Its current profit margin is at 38%, about 11% higher than O. And also, its long-term average is higher than O. So to make up for its cyclicality, SPG offers better profitability in the long term because of its better asset utilization AND also its better profit margin.
Seeking Alpha Seeking Alpha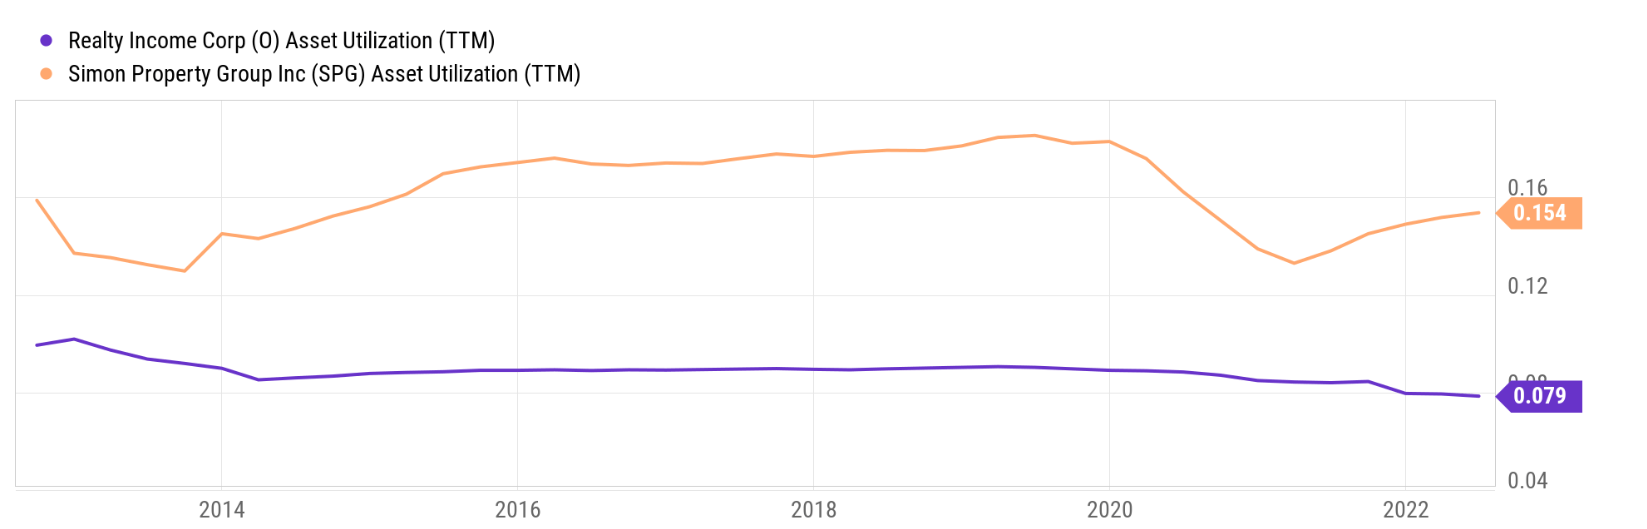
Dividend yield and total shareholder yield
With their profitability and dividend sustainability checked, let’s examine their dividend yield more closely. The chart below puts the dividend yield of SPG and O under a longer historical perspective. As can be seen, both SPG and O have actually paid about the same average dividend yield in the past: 4.51% for O and 4.54% for SPG. Although again, note the range of fluctuations here. SPG is just much more volatile than O.
So SPG’s current yield of 7.3% on a TTM basis (or 6.48% on an FW basis) is not only far above O, but also far above its own historical average. On an FW basis, its current yield of 6.48% is more than 42% above its historical average, signaling a substantial valuation discount. In contrast, O’s 3.98% current yield, as generous as it is in absolute terms, is actually below its historical average by about 12%, signaling a mild degree of overvaluation.
When the total shareholder yield is considered, the difference is even large. SPG recognizes that its stock is undervalued as its CEO David Simon has pointed out during the Q2 earnings report (abridged and emphases added by me). As a result, SPG has been repurchasing its own shares. During the past quarter, it repurchased more than 1.4M shares of its common stock, adding about 0.4% to the total shareholder yield in the past quarter alone. And the company plans to keep repurchasing its shares, while to my knowledge, O has no plan of share repurchases (emphasis added).
During the quarter, we repurchased 1.4 million shares of our common stock for $144 million. And let me point out while other companies in our sector are paying little or no dividends and issuing equity, we are repeatedly raising our dividend and buying our stock back…. So our stock is cheap, and we’re going to keep buying stock back…
Seeking Alpha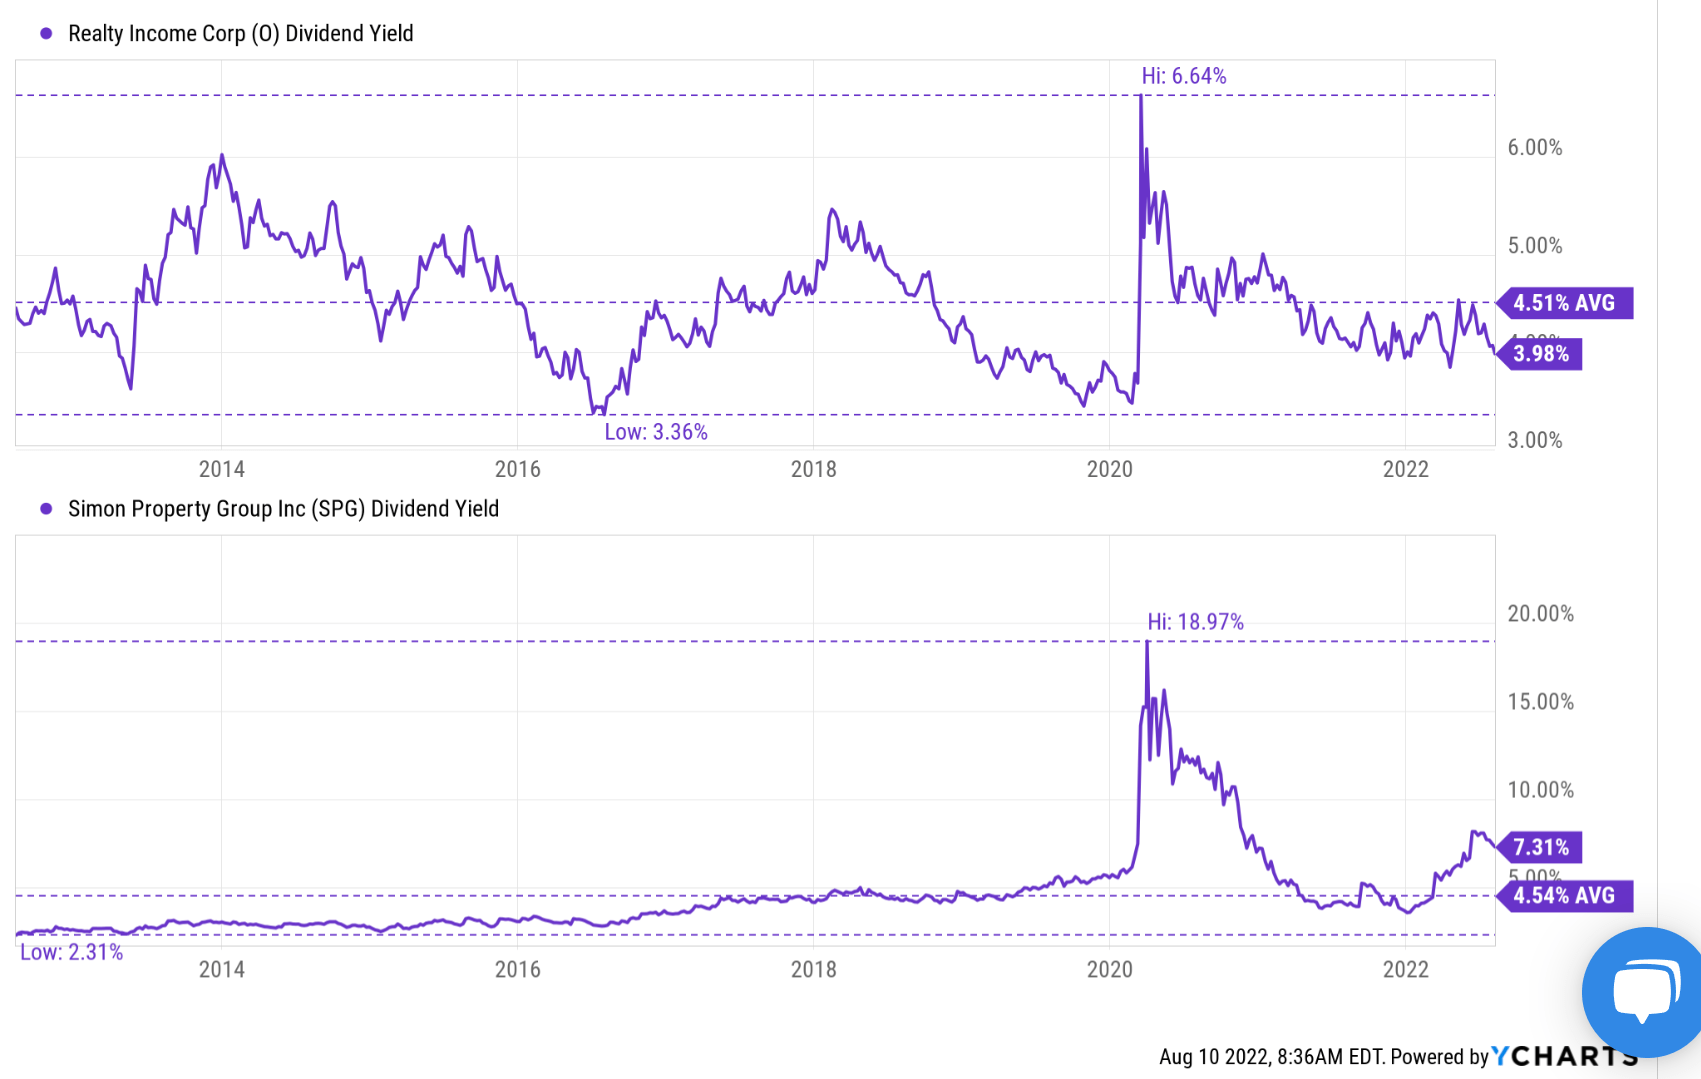
Return projections
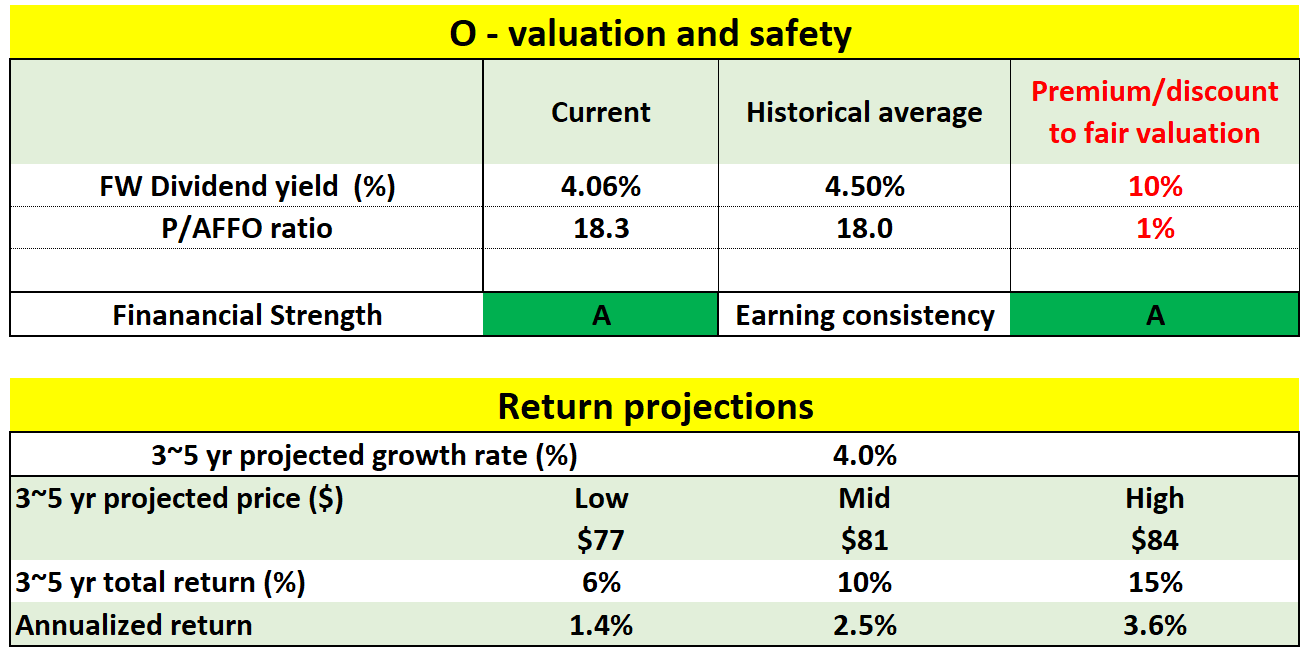
As aforementioned, SPG is undervalued compared to its own historical records. The discount is about 44% in terms of dividend yield from its historical averages. In terms of AFFO multiples, its present FW P/AFFO ratio is only about 9.2x and the historical average is around 10.5x, translating into a discount of about 12%. O, in contrast, is either fairly valued or mildly overvalued. The overvaluation is about 10% in terms of dividend yield from its historical averages as aforementioned. In terms of AFFO multiples, its present FW P/AFFO ratio is about 18.3x, on par with its historical average of 18.0x.
With the compressed valuation, a larger upside is projected for SPG assuming a conservative growth rate of 4% as shown below. For the next 3~5 years, the total return is projected to be in a range of 34% (the low-end projection) to about 68% (the high-end projection), translating into an annual return of 7.5%to 13.9%. In contrast, the total return for O is projected to be in a range of 6% to about 15%, translating into an annual return of 1.4% to 3.6%.
Author Author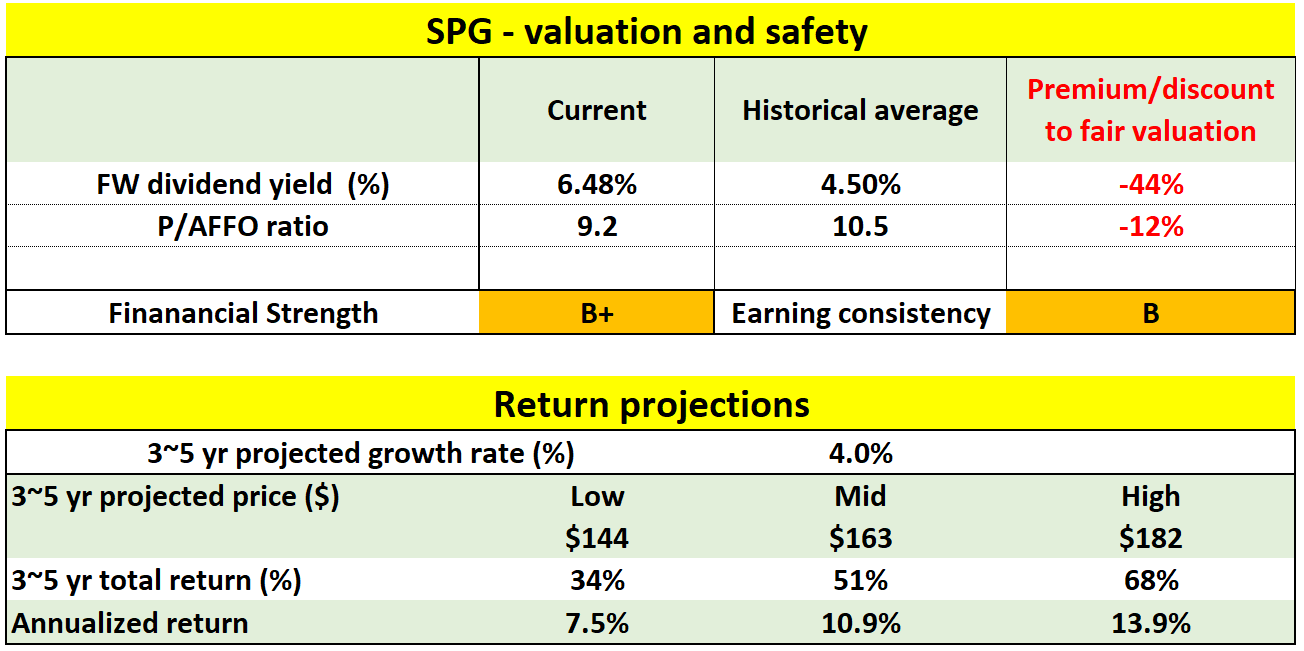
Final thoughts and risks
Before closing, I want to reiterate that the higher return potential for SPG came at a price of its more dramatic cyclical nature. O provides better earning consistency (A consistency score) than SPG (B consistency score). Also, even though both feature strong balance sheets, O’s financial strength is better comparatively. All told, my view is that SPG is now valuated at a cyclical low, and the above risks are more than compensated by the compressed valuation and return potentials.
Finally, risks. Besides its cyclical nature, SPG also faces other risks. As mentioned, its balance sheet is more leveraged than O. Its Total Debt stands at $25.39B, compared to $16.46B for O. And its Long-Term Debt/Total Capital ratio is currently at 82.7%, much higher than O’s 36.1%. I am not too concerned given its ample cash flow. Debt service remains very manageable (with interest coverage around 5x). That said, a higher debt burden could hamper development activities. In the long term, the future of malls is uncertain given the unfolding dynamics of online shopping.
Be the first to comment