


EXTREME-PHOTOGRAPHER/E+ via Getty Images
Introduction: Why Is RTX Stock Up?
Raytheon Technologies Corporation (NYSE:RTX) reported Q3 2022 results two weeks ago on October 25. Shares have since risen 7.1%, recovering all of their losses since late August, though still 9% below their peak in April:
|
Raytheon Share Price (Last 1 Year) 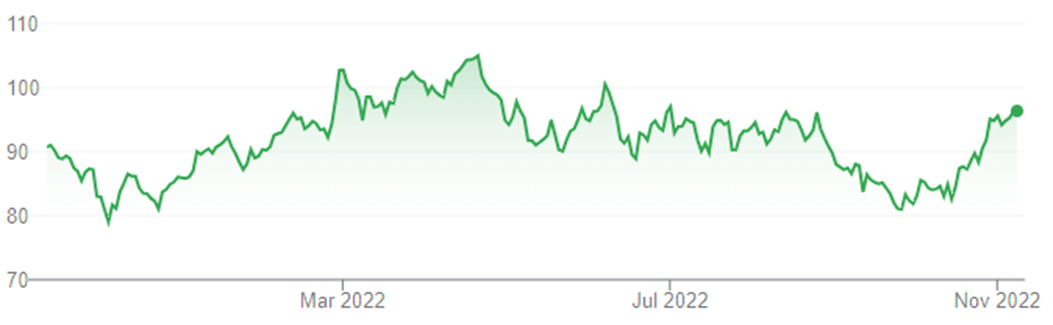 Source: Google Finance (08-Nov-22). |
We initiated our Buy rating on Raytheon in May 2020 and RTX stock has gained 56% since (including dividends); from the end of 2020, RTX stock has gained 40%, compared to a roughly flat S&P 500 index.
Q3 2022 results were in line with our investment case. EBIT grew double-digits in aerospace segments, driven by the continuing recovery in air travel, but declined in defense segments, largely due to supply chain disruptions. Management has reduced the full-year outlook for sales and EBIT, but still expects to see a 16.5% EBIT growth; EPS outlook was actually higher due to a tax rule change. Management is expecting both sales growth and margin expansion in 2023. RTX stock has a 20.3x P/E and a 4.2% Free Cash Flow Yield (excluding a tax rule change). The Dividend Yield is 2.3%. Our forecasts indicate a total return of 49% (14.3% annualized) by 2025 year-end. Buy.
Raytheon Buy Case Recap
Our investment case on Raytheon is based on its Free Cash Flow (“FCF”) rebounding in the next few years, as passenger air travel recovers from the disruption by COVID-19, helped by structural growth in both its commercial and military businesses, as well as by the remaining synergies from the UTX-RTN merger in 2020.
We expect Raytheon to have $10bn of FCF in 2025, the low-end of management’s target. This compares with pro forma FCF of approximately $7bn in 2019 (excluding $1bn of upfront engine losses at Pratt & Whitney), as well as with a pre-COVID 2021 FCF target of $8bn:
|
Raytheon Free Cash Flow – Historic & Forecasted 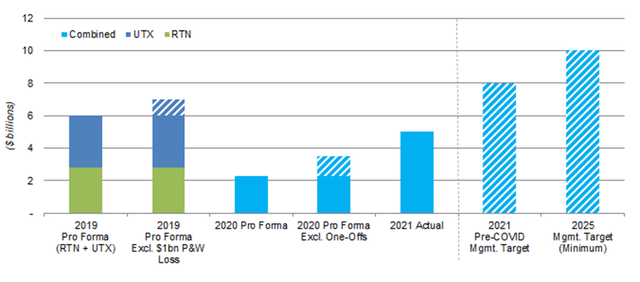 Source: RTX company filings, Librarian Capital estimates. |
Raytheon’s outlook for a $10bn+ FCF in 2025 is based on expectations of strong double-digit EBIT rebounds from 2020 in its aerospace segments, and mid-to-high single-digit EBIT CAGRs in its defense segments:
|
Raytheon Expected Sales & Adjusted EBIT CAGR (2020-25) 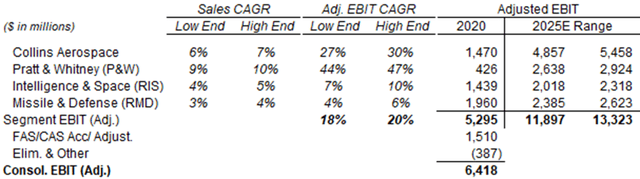 Source: RTX investor day presentation (May-21). |
Raytheon targets a return of $20bn+ of capital in dividends and buybacks to shareholders in the first four years of the UTX-RTN merger (compared with a pre-COVID target of returning $18-20bn in three years).
Q3 2022 results are in line with our investment case, though there are temporary headwinds from supply chain disruptions and a tax rule change.
Raytheon Q3 Results Headlines
In Q3 2022, on an adjusted basis, Raytheon sales grew 4.6% year-on-year (6% organic) and EBIT grew 2.0%:
|
Raytheon Adjusted P&L (Q3 2022 vs. Prior Year) 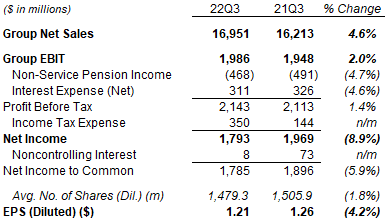 Source: RTX results release (Q3 2022). |
However, Profit Before Tax only grew 1.4% because of a lower pension income, and Income Tax Expense was $206m larger due to a prior-year tax item, so Net Income actually fell 5.9% year-on-year. EPS fell slightly less, by 4.2%, thanks to a lower non-controlling interest and a lower share count after buybacks.
Year-to-date, on an adjusted basis, Raytheon’s EBIT grew 6.7% and its EPS grew 9.9% year-on-year:
|
Raytheon Adjusted P&L (Q3 YTD 2022 vs. Prior Year) 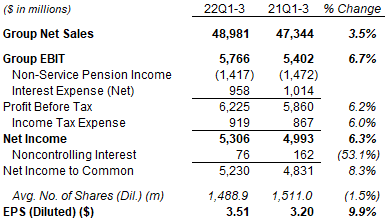 Source: RTX results release (Q3 2022). |
Raytheon’s relatively weak EBIT growth in Q3 was due to strong aerospace segments and weak defense segments offsetting each other.
Raytheon Q3 Results By Segment
Year-to-date, EBIT in Raytheon’s aerospace segments (shown in blue in the chart below) has continued to rebound, while EBIT in its defense segments (in green) fell sequentially for two quarters, before recovering partially in Q3:
|
RTX Segment Adjusted EBIT by Quarter (Since Q3 2019) 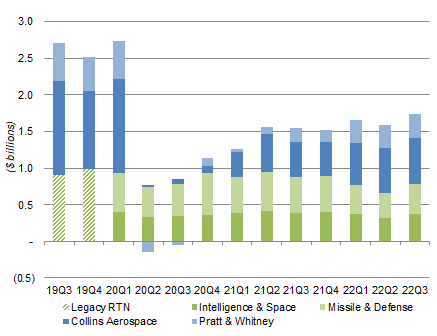 Source: RTX company filings. NB. Figures not adjusted for divestitures, FAS/CAS accounting and corporate expenses. |
The rebound in aerospace segments has been driven by the continuing recovery in air travel from COVID-19. Global Revenue Passenger Miles (“RPM”) reached 75% of 2019 levels in Q3, further improving from the 70% seen in Q2, while the number of U.S. travelers through TSA checkpoints reached 91% of 2019 levels in the quarter. The recovery in air travel is not yet complete, as restrictions remain in place in key countries such as China, affecting long-haul travel in particular. Raytheon management expects global RPM to reach 90% of 2019 levels as we exit 2022.
The weakness in defense segments has largely been due to supply chain disruptions, which have reduced production and thus delayed sales. Lower volumes also hurt earnings indirectly through the loss of scale efficiencies. The effect of the disruptions has been concentrated in Raytheon’s military businesses, while its commercial businesses have remained largely unaffected, because government procurement regulations make it much harder for the military businesses to take remedial actions.
The strong dollar has also been an increasing headwind for Raytheon in 2022.
The table below shows the sales and EBIT figures for each of Raytheon’s segments:
|
Raytheon Sales & EBIT by Segment (Q3 2022 vs. Prior Periods) 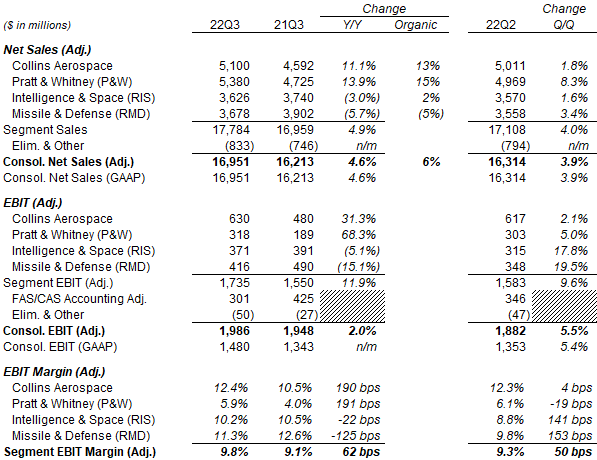 Source: RTX results releases. |
Collins Aerospace revenues grew 11.1% year-on-year in Q3 (13% organically), with commercial aftermarket sales up 25% and commercial Original Equipment (“OE”) sales up 16%, more than offsetting military sales being down 6%. Collins’ EBIT grew 31.3% year-on-year and EBIT margin expanded 190 bps, thanks to drop-through on the higher commercial sales.
Pratt & Whitney revenues grew 13.9% (15% organically), with commercial aftermarket sales up 14% and commercial OE sales up 14%, more than offsetting military sales being down 2% (“primarily” due to lower F135 volumes). Pratt & Whitney EBIT grew 68.3% and margin expanded 191 bps.
Intelligence & Space (“RIS”) revenues declined 3% as reported but grew 2% organically, the difference driven by the sale of a training & services business. RIS EBIT fell 5.1% year-on-year, with margin falling slightly (by 22 bps).
Missile & Defense (“RMD”) revenues fell 5.7% reported and 5% organically, “primarily driven by continuing delays in material availability” and also lower volumes in certain defense programs. RMD EBIT fell 15.1% and EBIT margin fell 125 bps driven by unfavorable mix, weaker and lower efficiencies due to supply chain and labor constraints.
Management stated there was some “stabilization” in supply chains in Q3. Consistent with this, all four segments showed sequential growth in both sales and EBIT. However, supply chain issues are expected to continue into 2023 or even 2024 in some cases (such as in rocket motors).
“FAS/CAS Accounting Adjustment” is a pension-related item, reflecting the difference between the service cost component of pension-related expenses under the Financial Accounting Standards (“FAS”) requirements of U.S. GAAP and the pension-related expenses under U.S government Cost Accounting Standards (“CAS”) in the RIS and RMD segments. The adjustment is less positive in Q3 2022 due to a prior-year actuarial update and higher discount rates.
Raytheon’s Updated 2022 Outlook
For full-year 2022, with the dynamics described above, management now expects a stronger EBIT in its aerospace segments, but worse revenue and EBIT declines in its defense segments:
|
Raytheon 2022 Outlook (By Segment) 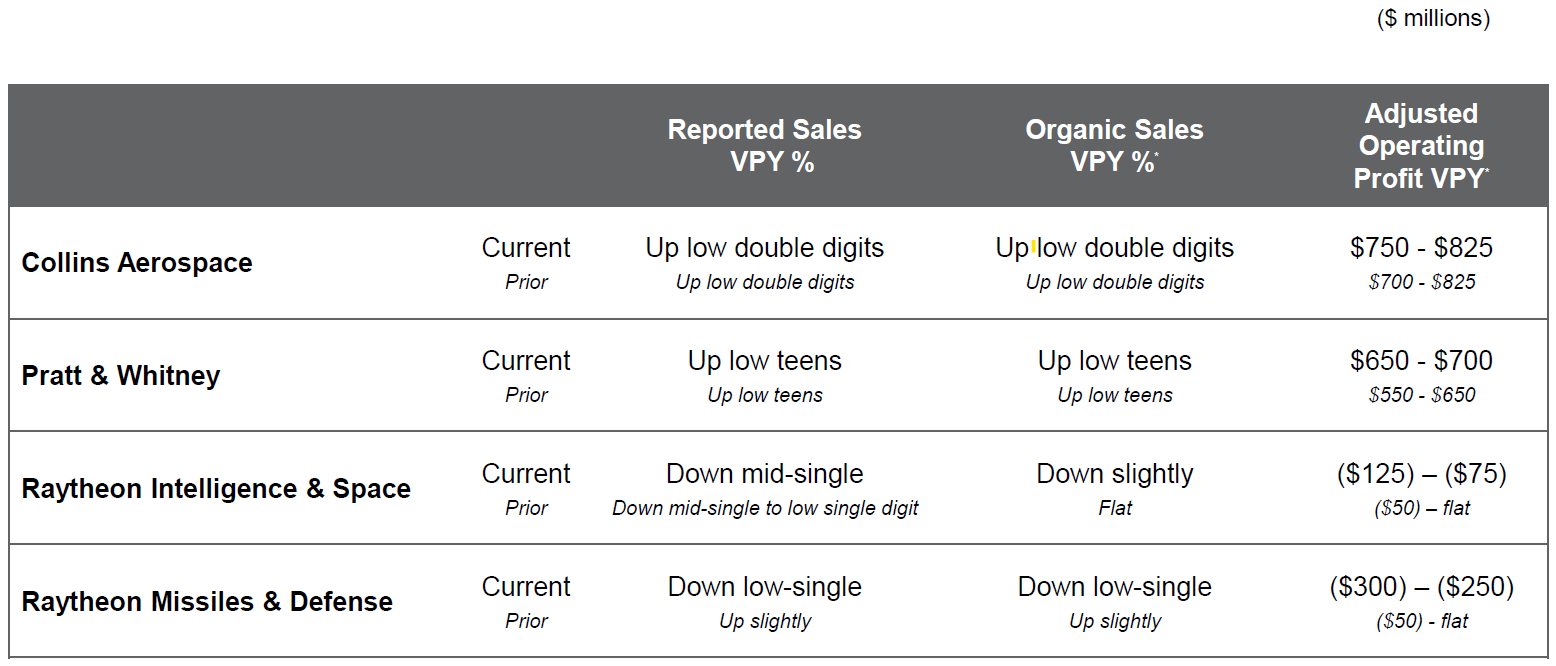 Source: RTX results presentation (Q3 2022). |
The overall result of the changes is that 2023 EBIT is expected to grow by $1.20bn (or 16.5% year-on-year), $175-$275m less than previously expected.
With the new tax rule on R&D amortization, Raytheon now expects a much lower tax rate (15.5%, compared to 18.0-18.5% before), and this means 2022 expected EPS has gone up despite the lower EBIT. Raytheon now expects 2022 EPS of $4.70-$4.80, from $4.60-$4.80 before:
|
Raytheon 2022 Outlook (Group) 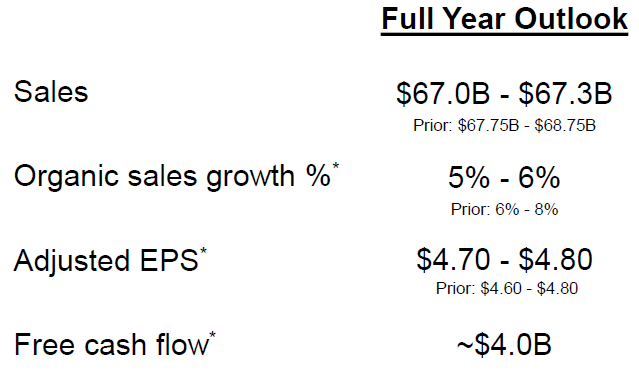 Source: RTX results presentation (Q3 2022). |
Expected 2022 FCF is $4bn, unchanged from before except for the new tax rule, helped by a lower CapEx outlook (of $2.3bn, compared to $2.4-$2.5bn before). Expected FCF was $6bn before, but the new tax rule on R&D amortization is expected to shift $2bn of FCF from 2022 to future years.
As a reminder, as specified in the Tax Cuts & Jobs Act in 2017 but only implemented in 2022, R&D expenses now have to be amortized over five years rather than expensed upfront. Lower expenses means higher taxable profits and so higher taxes, though the effect is one of timing only as the total amounts of expenses and thus tax over time are unchanged.
Raytheon has always expected this rule to be deferred or repealed, but acknowledged in September that this would not happen this year. The effect on 2022 FCF is expected to be $2bn, with $1.5bn already paid in Q3. Management now expects the rule to be repealed in 2023.
Raytheon’s Comments on 2023
Management has informally guided for both sales growth and margin expansion in 2023.
As CFO Neil Mitchill said on the Q3 earnings call:
“We do expect to see mid- to high single-digit sales growth in 2023 … most of that to come from our commercial businesses. I think even more importantly, we’ll see segment operating profit growth exceed the growth rate of sales. So we do expect margin expansion as well next year.”
Somewhat offsetting these, management’s 2023 EPS forecast will likely face headwinds in both pension charges (likely $0.40 “due to current market conditions”) and a higher tax rate (assuming the new rule on R&D amortization is repealed).
Raytheon Valuation
At $96.14, on 2021 financials, RTX shares are at a 22.1x P/E and a 3.5% FCF Yield; on the mid-point of the 2022 outlook, excluding the $2bn impact from the new tax rule, RTX shares are at a 20.3x P/E and 4.2% FCF Yield:
|
Raytheon Earnings, Cash flows & Valuation (2020-22E) 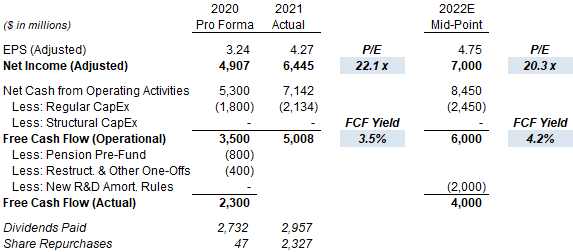 Source: RTX company filings. |
Raytheon’s quarterly dividend is $0.55 ($2.20 annualized) and represents a Dividend Yield of 2.3%.
RTX repurchased $602m of shares in Q3 at an average price of approximately $91, bringing the year-to-date total to $2.39bn.
CFO Greg Haynes indicated that share buybacks are likely to be “$3bn plus” in 2023, regardless of whether the new tax rule is repealed. Similarly he reaffirmed Raytheon’s commitment to return “at least $20bn” to shareholders through dividends and buybacks in the first four years after the UTX-RTN merger in 2020.
Raytheon Stock Forecasts
For our forecasts, we are shifting $2bn in FCF from 2022 to 2023, reflecting the new tax rule this year and assuming that it will be repealed next year, but keeping most other assumptions unchanged:
- 2022 FCF of $4.0bn (was $6.0bn)
- 2023 FCF of $10.0bn (was $8.0bn)
- 2024 and 2025 FCF to be $9.0bn and $10.0bn respectively (unchanged)
- 2022 share count to be 1,479m (was 1,485m)
- From 2023, share count to fall by 1.5% each year (unchanged)
- From 2023, dividend to be based on a 65% Payout Ratio (on FCF)
- FCF Yield at 5.5% at 2025 (unchanged)
Our new 2025 FCF/Share forecast is 0.3% higher than before ($7.05):
|
Illustrative Raytheon Return Forecasts 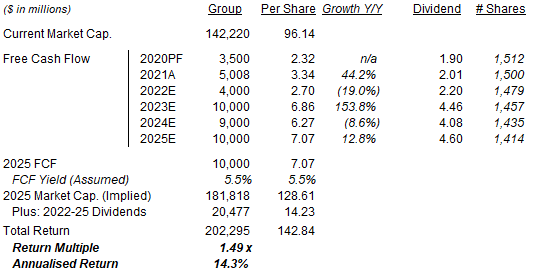 Source: Librarian Capital estimates. |
With shares at $96.14, we expect an exit price of $129 and a total return of 49% (14.3% annualized) by 2025 year-end.
Conclusion: Is Raytheon A Buy?
We reiterate our Buy rating on Raytheon.
Be the first to comment