

USD/ZAR ANALYSIS
- March 2021 Quarterly Bulletin
- Easter weekend restrictions
- President Biden Speech
- Economic data announcements
RAND FUNDAMENTAL BACKDROP
Yesterdays Quarterly Bulletin exposed many underlying flaws in the South African economy, however this did not deter the Rand which is currently up 0.74% against the U.S. Dollar. Some key points that should be highlighted:
- Higher borrowing by government was financed primarily through the issuance of domestic long-term government bonds
- As a percentage of GDP, gross loan debt increased from 62.2% to 77.1%
- Rand continues to fluctuate alongside global risk sentiment
- Inflationary pressures remained muted
In addition, short-term Rand pressure was supplemented by the upcoming restrictions over the Easter weekend which was addressed by President Ramaphosa last night. Tighter alcohol limitations were introduced in an attempt to curb further COVID-19 infections and a possible third wave.
The U.S. President Joe Biden will be in focus as well with his speech around the details of the economic recovery package focusing on infrastructure and manufacturing. This is likely the major contributing factor for Rand strength this morning regardless of climbing U.S. 10Y Treasury yields.
USD/ZAR ECONOMIC CALENDAR
Several key announcements are scheduled for this week with NFP on Friday. Expect some volatility pre and post-announcements which demands heightened awareness and sound risk management on trade positions.
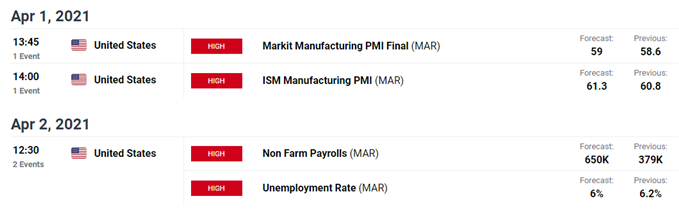
Source: DailyFX economic calendar

Recommended by Warren Venketas
Trading Forex News: The Strategy
TECHNICAL ANALYSIS
USD/ZAR WEEKLY CHART
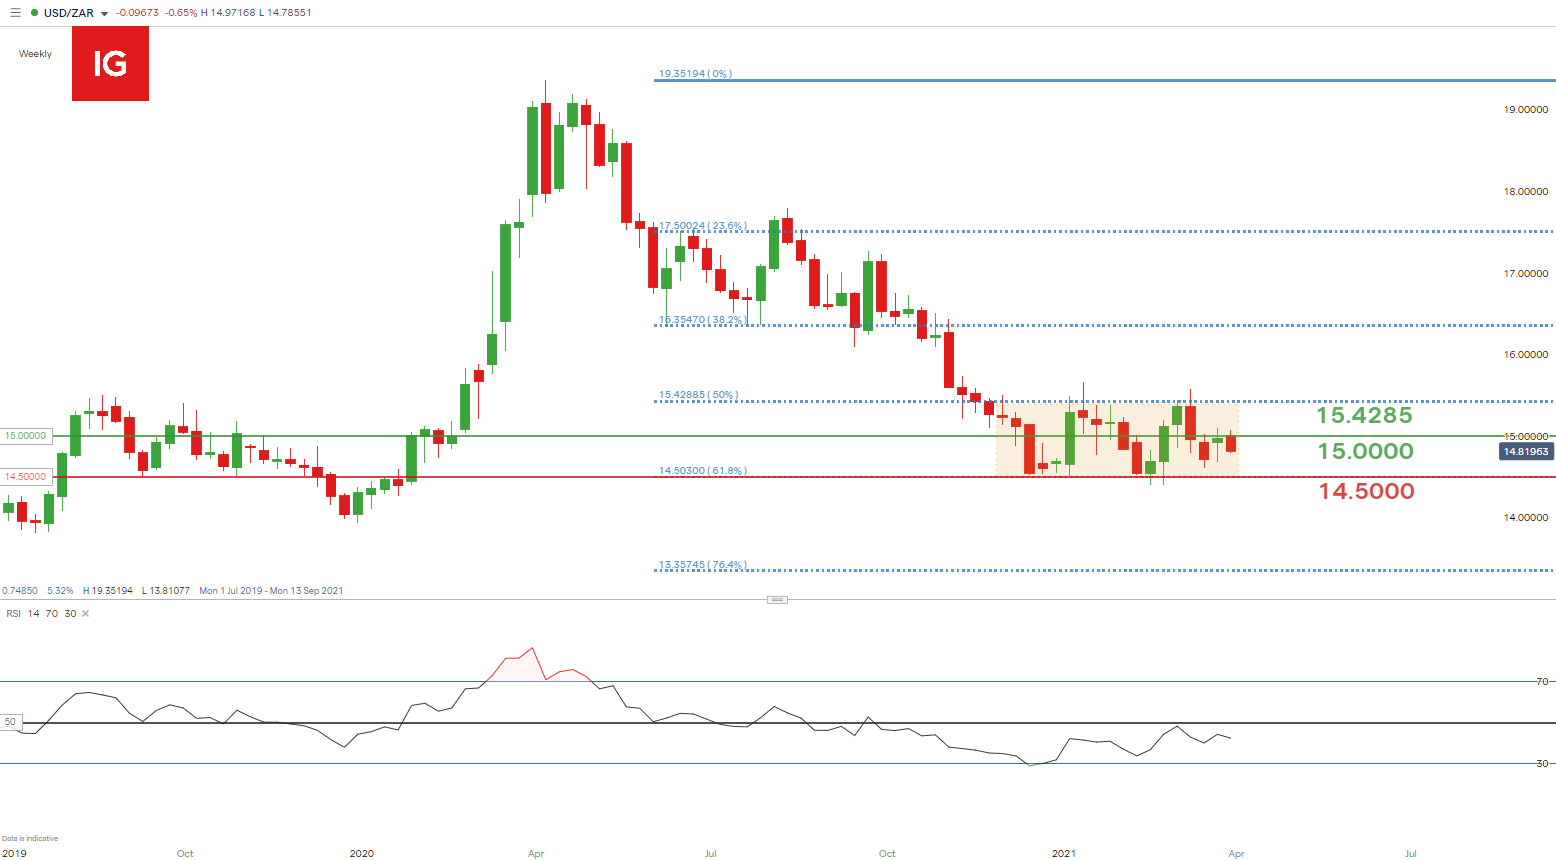
Chart prepared by Warren Venketas, IG
USD/ZAR extends its movement within the medium-term rectangle pattern (yellow). Last weeks candle close below the 15.0000 psychological level has dampened any upside this week as the Rand pushes lower. Although a breakout may be months away, many potential catalysts could spark a quicker than expected price break.
Discover the basic building blocks of Fibonacci and how it can be applied in Financial markets!
USD/ZAR DAILY CHART
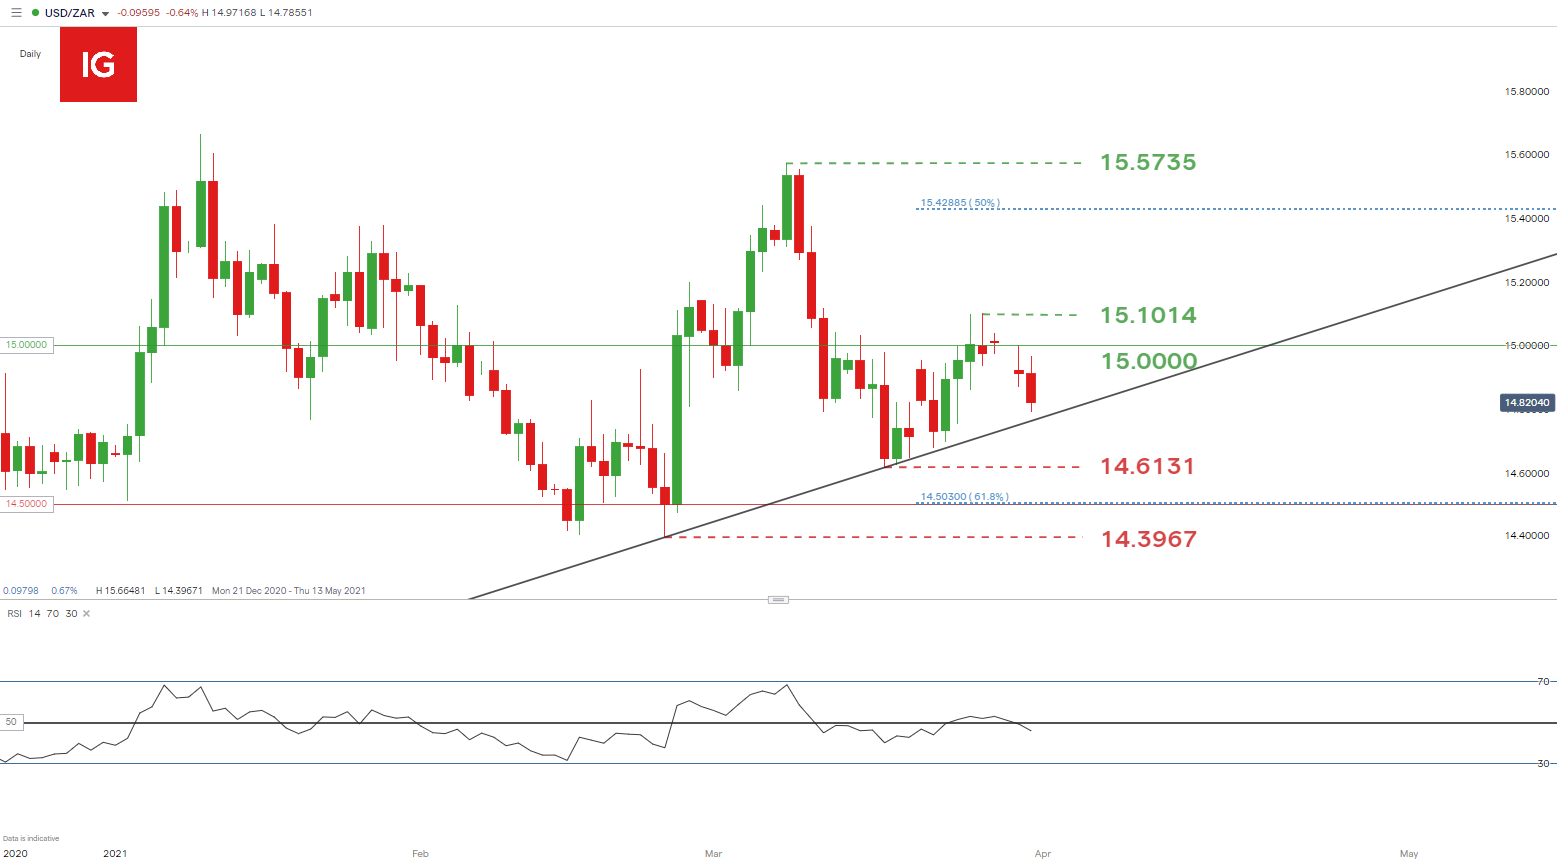
Chart prepared by Warren Venketas, IG
The daily chart above shows the short-term support trendline (black) looming which could provide a springboard for prices to push upward. If this trendline is breached, the March 17 swing low at 14.6131 will serve as initial support target followed by the 14.5000 key level.
The U.S. stimulus discussion may be prompting a Dollar sell-off, but local fundamentals point to long-term ZAR weakening toward the end of 2021 and 2022. The short-term bullish outlook should prices respect trendline support will come from the 15.0000 psychological resistance level.
The Relative Strength Index (RSI) has dipped slightly below the midpoint 50 level on the index which favors downside momentum. This could swing either way after the aforementioned economic announcements are digested so monitoring these updates are important for the week ahead.
Starts in:
Live now:
Apr 20
( 17:04 GMT )

Keep up to date with price action setups!
Trading Price Action
USD/ZAR: KEY TECHNICAL POINTS TO CONSIDER
- Weekly: Rectangle pattern persisting
- Daily: 15.0000 resistance
- 15.1014 swing high
- 14.6131 swing low
- 14.5000 support
— Written by Warren Venketas for DailyFX.com
Contact and follow Warren on Twitter: @WVenketas
Be the first to comment