

Technical Forecast for the US Dollar: Neutral
- The US Dollar (via the DXY Index) saw all of its weekly gains evaporate following the May US nonfarm payrolls report as US Treasury yields receded.
- Net-long US Dollar positioning has climbed for four consecutive weeks.
- The IG Client Sentiment Index suggests that the US Dollar has a neutral bias across the board, but for USD/JPY rates, which is bearish.
US Dollar Rates Week in Review
The US Dollar (via the DXY Index) was off to a strong start through the first week of June until it ran into the May US nonfarm payrolls report on Friday. Receding US Treasury yields around the data provoked a significant technical reversal in the DXY Index, seeing the gauge close out the week only up by +0.09% after being up by +0.63% at its weekly high. As a result, many USD-pairs have long wicks on the weekly charts, suggesting that US Dollar selling pressure remains as the calendar moves into the second week of June.
For full US economic data forecasts, view the DailyFX economic calendar.
EUR/USD RATE TECHNICAL ANALYSIS: DAILY CHART (March 2020 to June 2021) (CHART 1)
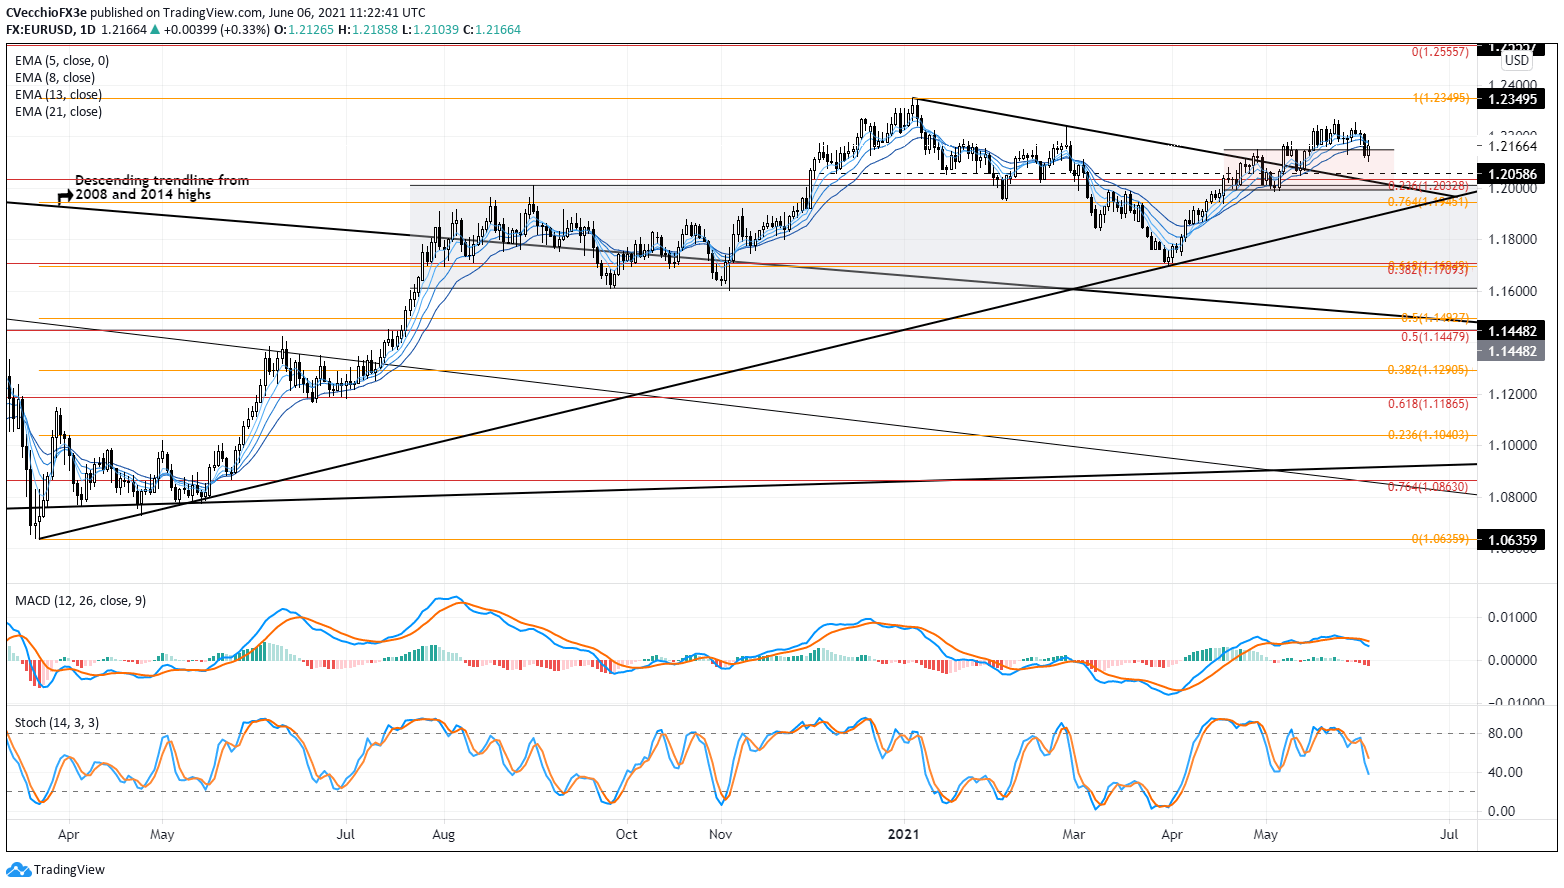
EUR/USD rates retraced their early week losses to settle above former consolidation resistance that defined price action starting in mid-April. Bullish momentum has waned, with the pair intertwined among daily 5-, 8-, 13-, and 21-EMA envelope, which is still in neither bearish nor bullish sequential order. Daily MACD is falling while above its signal line, and daily Slow Stochastics are dropping through their median line. More stability in price action is sought before it be discerned if EUR/USD rates are tracking towards the 2021 high at 1.2350.
IG Client Sentiment Index: EUR/USD Rate Forecast (June 4, 2021) (Chart 2)
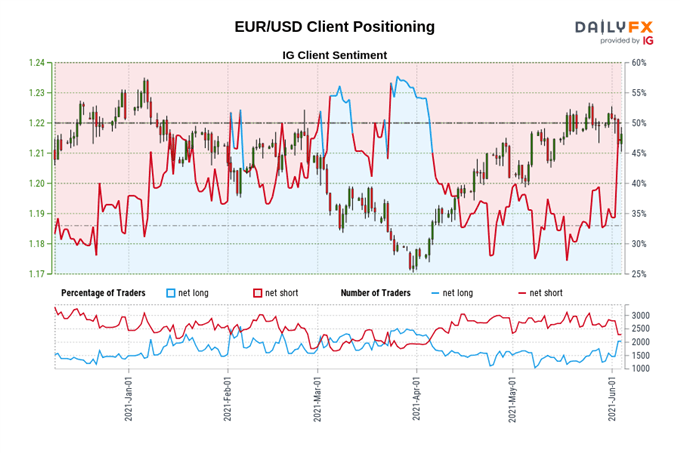
EUR/USD: Retail trader data shows 36.61% of traders are net-long with the ratio of traders short to long at 1.73 to 1. The number of traders net-long is 21.22% lower than yesterday and 7.24% higher from last week, while the number of traders net-short is 10.59% higher than yesterday and 2.23% lower from last week.
We typically take a contrarian view to crowd sentiment, and the fact traders are net-short suggests EUR/USD prices may continue to rise.
Positioning is more net-short than yesterday but less net-short from last week. The combination of current sentiment and recent changes gives us a further mixed EUR/USD trading bias.
GBP/USD RATE TECHNICAL ANALYSIS: DAILY CHART (March 2020 to June 2021) (CHART 3)
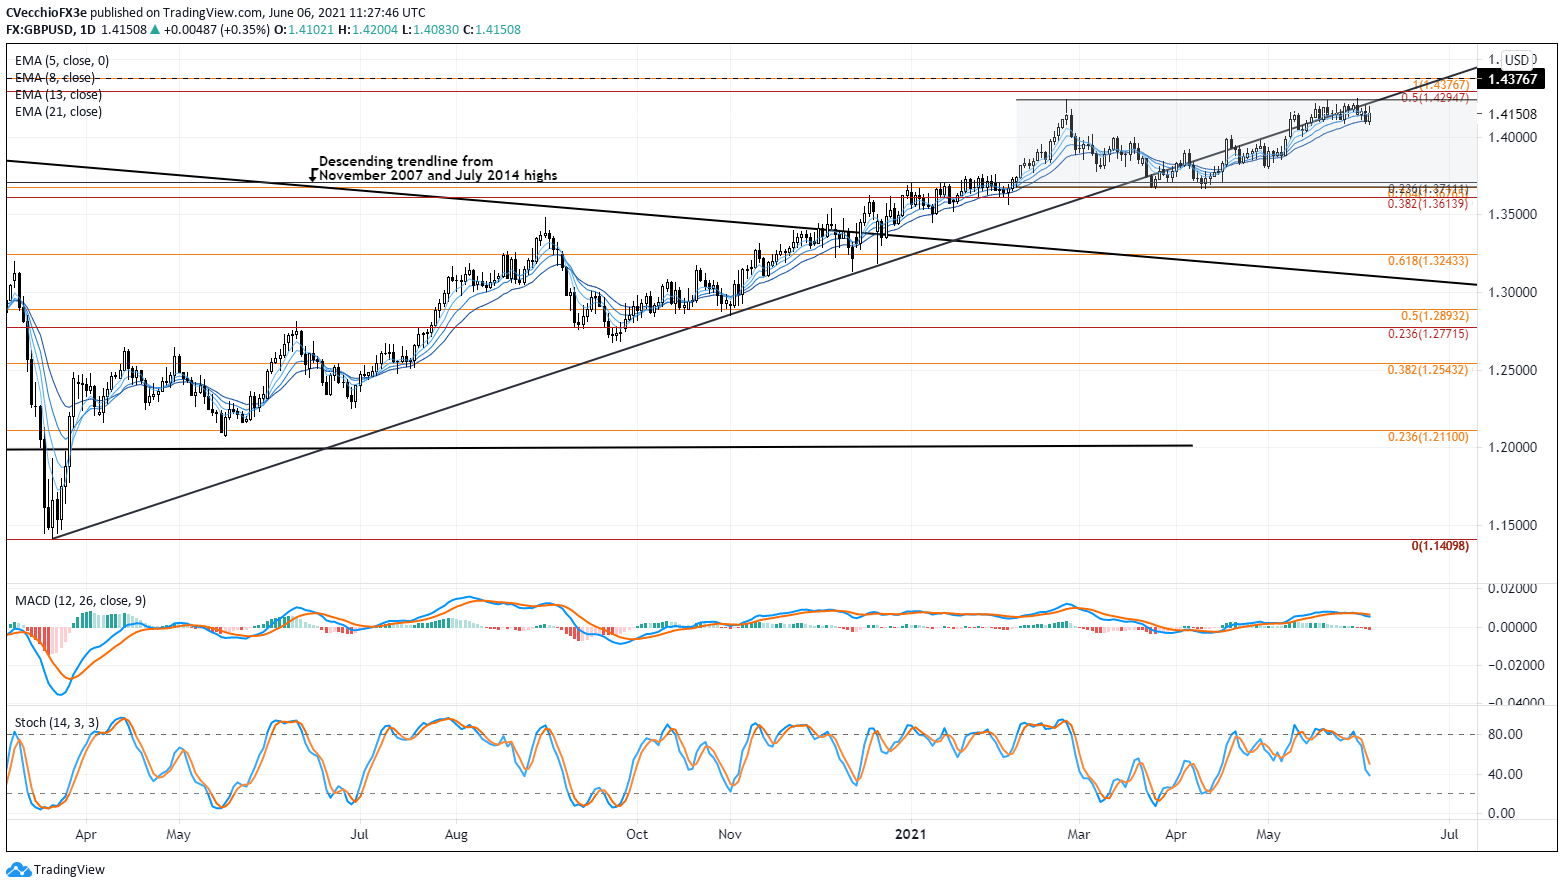
It’s been previously noted that “more gains may be ahead as the pair seeks to reclaim the base of the aforementioned descending triangle as well as the yearly high at 1.4241.” GBP/USD rates traded higher through 1.4241 on Monday, June 1, fulfilling our expectation.
Now, GBP/USD rates continue to hug the ascending trendline from the March and November 2020 lows, the pandemic uptrend, which has started to serve as more formidable resistance in recent days.But there is technical evidence that GBP/USD rates may still have bullish tendencies in the short-term.
GBP/USD rates are still treating the daily 21-EMA as support, which has been the case for the past five weeks. Daily MACD is falling while above its signal line, and daily Slow Stochastics are dropping through their median line. The context of price action and the technical studies suggests that GBP/USD rates are likely working off short-term overbought conditions before continuing higher.
IG Client Sentiment Index: GBP/USD Rate Forecast (June 4, 2021) (Chart 4)
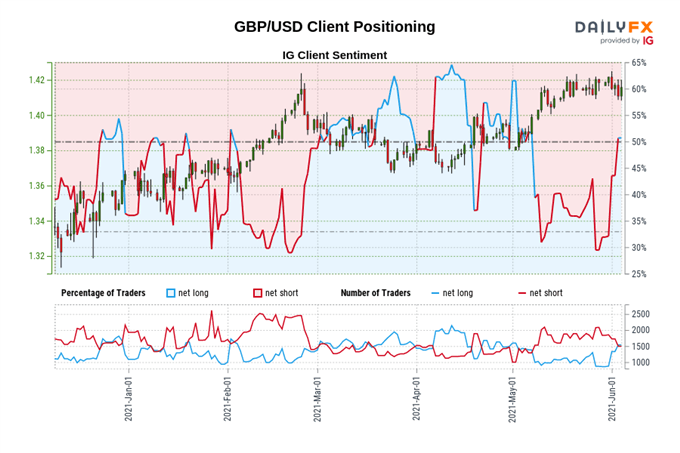
GBP/USD: Retail trader data shows 37.62% of traders are net-long with the ratio of traders short to long at 1.66 to 1. The number of traders net-long is 29.11% lower than yesterday and 13.83% higher from last week, while the number of traders net-short is 16.01% higher than yesterday and 4.86% lower from last week.
We typically take a contrarian view to crowd sentiment, and the fact traders are net-short suggests GBP/USD prices may continue to rise.
Positioning is more net-short than yesterday but less net-short from last week. The combination of current sentiment and recent changes gives us a further mixed GBP/USD trading bias.
USD/JPY RATE TECHNICAL ANALYSIS: DAILY CHART (June 2020 to June 2021) (CHART 5)
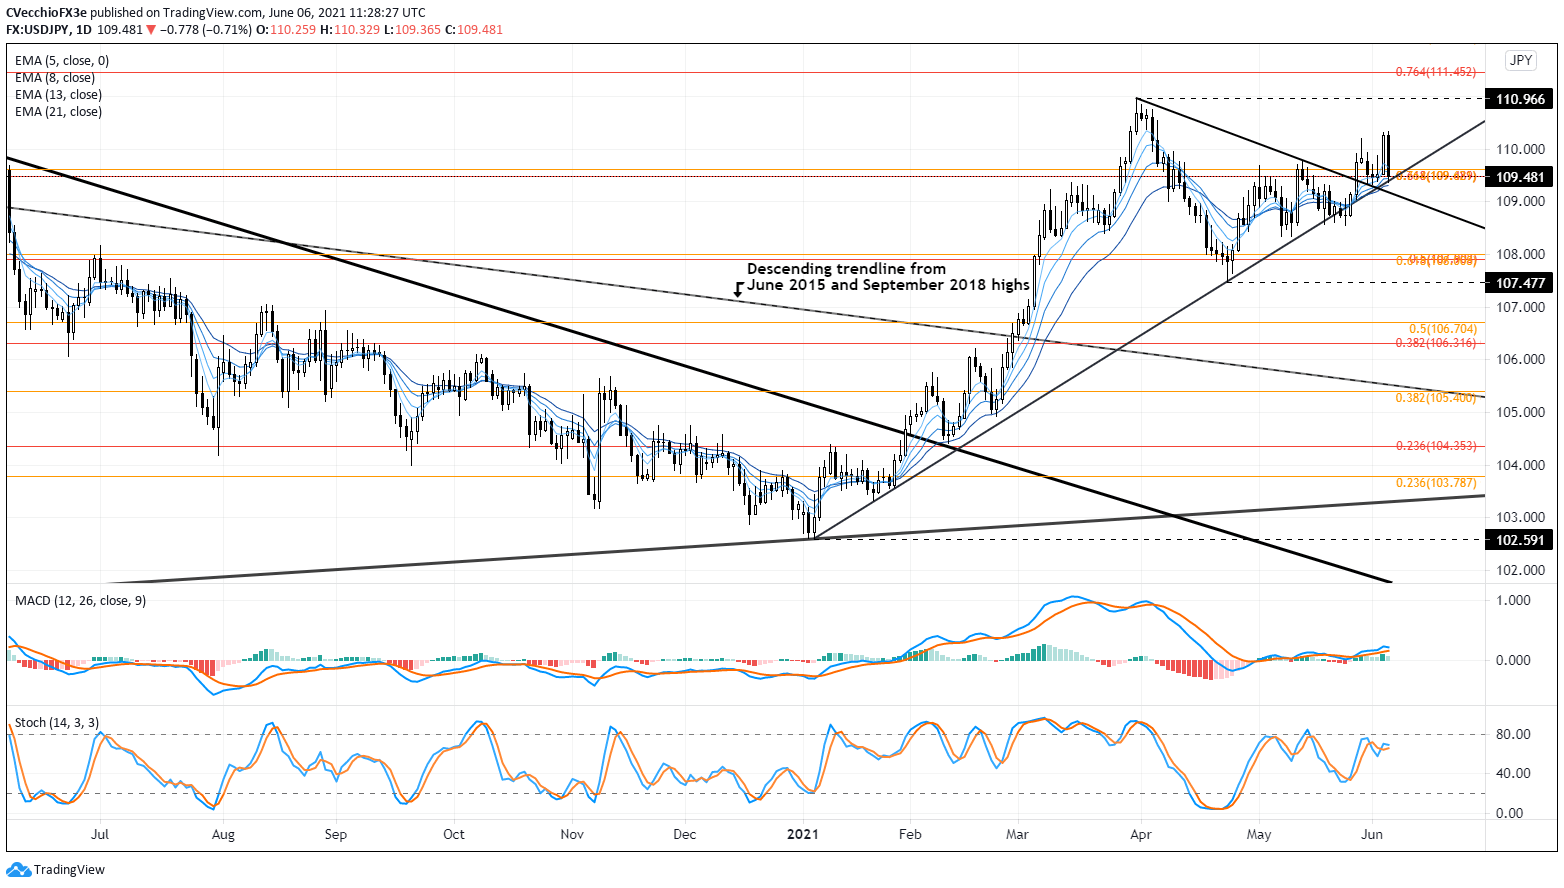
In the prior USD/JPY rate forecast update, it was noted that “USD/JPY rates may be starting to funnel into the vertex of a symmetrical triangle that’s materialized against the downtrend from the March and April swing highs and the uptrend from January, February, and April swing lows. Contextually, the expected outcome is for a bullish resolution, given that the preceding move was a rally following the break of the descending trendline from the June 2015 and September 2018 highs.If US Treasury yields can turn higher, USD/JPY may be one of the few places of solace for USD bulls, even if other USD-pairs are suffering.”
While USD/JPY rates did indeed trade higher out of the symmetrical triangle, price action at the end of last week yielded a shooting star candle on the weekly timeframe. Concurrently, the pair fell back to the ascending trendline from the January, February, and April swing lows, as well as a cluster of Fibonacci retracements. Even if USD/JPY’s technical studies point to bullish momentum, there’s good reason to have doubt; failure below the daily 21-EMA at 109.31 would be a topping signal.
IG Client Sentiment Index: USD/JPY Rate Forecast (June 4, 2021) (Chart 6)
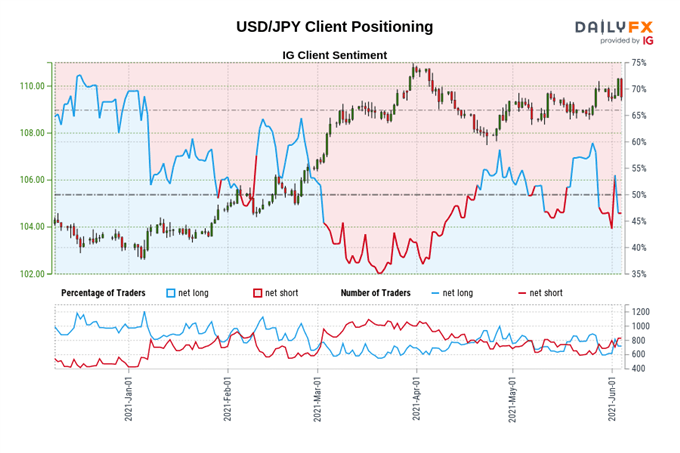
USD/JPY: Retail trader data shows 55.26% of traders are net-long with the ratio of traders long to short at 1.24 to 1. The number of traders net-long is 6.22% higher than yesterday and 22.71% higher from last week, while the number of traders net-short is 22.25% lower than yesterday and 15.20% lower from last week.
We typically take a contrarian view to crowd sentiment, and the fact traders are net-long suggests USD/JPY prices may continue to fall.
Traders are further net-long than yesterday and last week, and the combination of current sentiment and recent changes gives us a stronger USD/JPY-bearish contrarian trading bias.
CFTC COT US Dollar Futures Positioning (June 2020 to June 2021) (Chart 7)
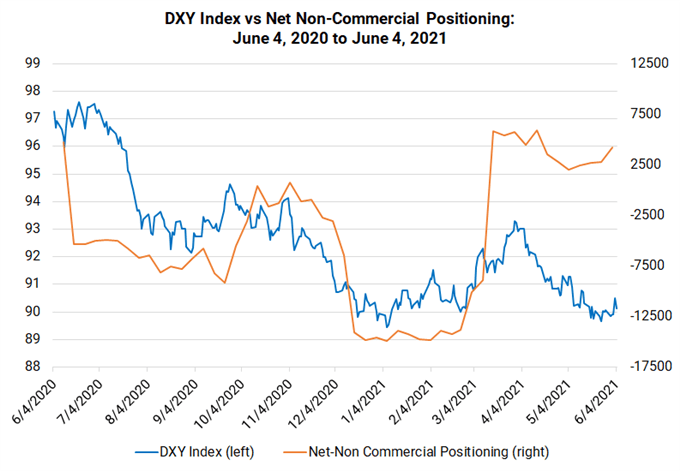
Finally, looking at positioning, according to the CFTC’s COT for the week ended June 1, speculators increased their net-long US Dollar positions for the fourth week in a row to 4.259 contracts, up from 2,780 contracts held in the week prior. Net-long US Dollar positioning has been holding steady for the past 10 weeks.
— Written by Christopher Vecchio, CFA, Senior Currency Strategist
Be the first to comment