

Pgiam/iStock via Getty Images
Investment Summary
Defensive healthcare continues to remain attractive in the current macroeconomic landscape. We have been crawling our way through the space and continue to locate various opportunities for growth for those willing to shift up in the quality spectrum. In our coverage universe, RadNet, Inc. (NASDAQ:RDNT) continues to be a standout in this regard. Since our last publication on RDNT, we’ve remained bullish on the outlook of the stock. Previously, we noted that 1) there are a number of inflection points for RDNT down the line; 2) imaging remains a strong contender for sustained growth despite the distribution of outcomes for the economy turning to recession; and 3) valuations implied the stock was fairly priced at its current values.
After extensively reviewing RDNT’s corporate value creation we believe the stock still offers investors compelling value to unlock future value down the line. Management reaffirmed FY22 revenue guidance and its markets are defensive in the event of an economic downturn. Net-net, we rate it a buy, seeking 2 price targets of $26.50, $32.50.
RDNT 12-month daily price evolution vs. SPX; RDNT equity beta [lower frame]
Data: Updata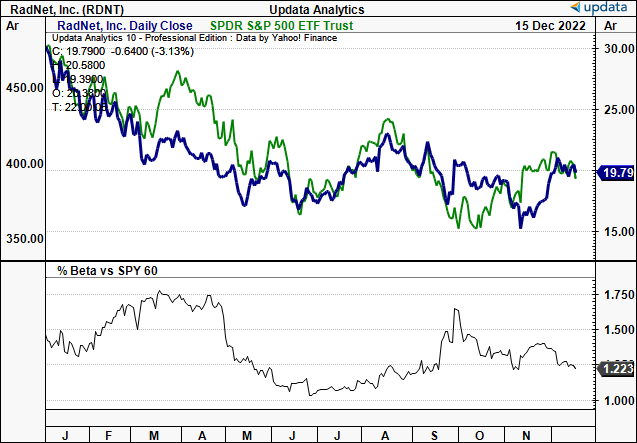
Q3 growth percentages in-line with expectations, a good sign by estimation
If we turn to the latest quarter, we’d note it was a period of reasonable growth in terms of cash flow, earnings and profitability for RDNT. First, we’d advise that RadNet has seen a significant improvement in filling open positions. You may recall, that back in September, the company had a peak of 850 open positions – almost 10% of the entire workforce.
However, according to the latest report management received in November, this number has fallen to 262 open positions, a 69% improvement. RadNet has recently entered into two joint venture (“JV”) agreements. This has increased the number of its facilities within health system partnerships to 119, or about 33% of the company’s entire network.
In addition, it has been in development for 15 de novo facilities across its broad market spectrum. It expects another 8 facilities to be in first revenue b Q2 FY23, having opened 3 this year. Should these convert, it would add to a long history of sequential revenue growth for the company, as you can see in Exhibit 1. In particular, despite the challenges of many in the healthcare domain this year, RDNT had continued to see normalized top-line growth.
Exhibit 1. RDNT Sequential revenue, core EBITDA, FCF yield since FY16 [only positive values plotted].
Data: HBI, Refinitiv Eikon, Koyfin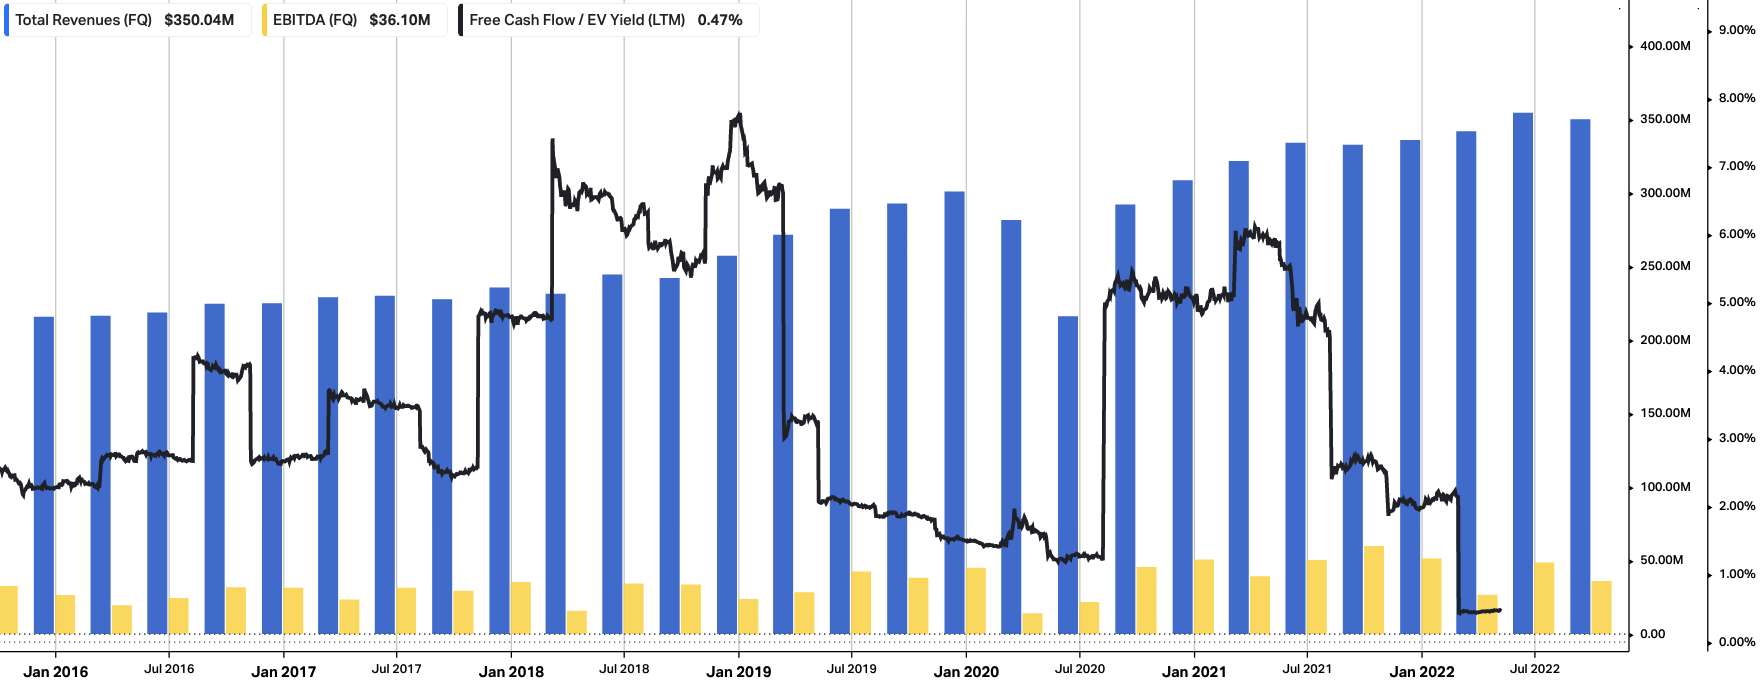
Speaking of the numbers, we checked Q3 RDNT’s financials with deep analytical rigour. We noted that RDNT’s imaging centres division reported revenue of $349.1 million on adjusted EBITDA of $50.2 million [note, this excludes revenue and losses from the AI reporting segment. Including the losses from the AI reporting segment, adjusted EBITDA for Q3 2022 was $45.8 million, compared to $54.6 million in Q3 2021, after adjusting for the one-time benefit of deferred federal payroll tax forgiveness in Q3 2021]. Compared to the same period last year, the imaging centres segment climbed 510bps YoY gain to $349mm increase in revenue and 850bps decrease in adjusted EBITDA – both after adjusting for the one-time tax benefit.
Moving down the P&L, RDNT printed net income of $668,000, compared to $16.2 million in Q3 2021. It pulled this to a fully diluted EPS of $0.01. This compared to $0.30 same time last year, with ~4mm more shares outstanding.
Finally, switching to the operational highlights, we noted the following:
- We saw an increase in RDNT’s MRI volume of 10.8% compared to the same period the previous year. This was coupled with a 9.6% increase in CT volume, and an 11.5% increase in PET/CT volume.
- Another point worth mentioning is that overall volume, including routine imaging exams such as x-ray, ultrasound, mammography, and others, increased by 5.7% YoY.
- MRI volume lifted by 9.2%, CT volume increased by 6%, and PET/CT volume increased by 9.5%. Overall same-centre volume, including all routine imaging exams, increased by 3.9%.
- In total, RadNet performed 2.3mm procedures in the Q3 2022. Of these, 75.4% of the volume coming from routine imaging exams. Specifically, it conducted 348,912 MRIs; 207,554 CT scans; 12,932 PET/CTs [compared to 11,600 PET/CTs in Q3 2021]; and 1.742mm routine imaging exams.
Each of the numbers in point 4 represent sizeable growth percentages from the previous year.
RDNT technicals searching for reversal
You’ll see in the chart below that RNDT has been trading sideways for the good portion of H2 FY22. In recent times, it has lifted from 52-week lows to close up for the past 4 weeks, crossing over the 50DMA in doing so.
The big push from its lows with the stock closing in the upper half of the trading range in early November suggests there are plenty of buyers at key levels. Shares now push towards the 250DMA and a cross above this moving average would be confirmation of a bullish reversal in our estimation.
Exhibit 2. RDNT continues to trade sideways for the bulk of H2 FY22, showing good defensive characteristics in the wake of the broad market trends.
- One potential factor for consideration is the reasonably flat volume trend, which could be either a positive or a negative depending on if the share price increases of decreases respectively.
Data: Updata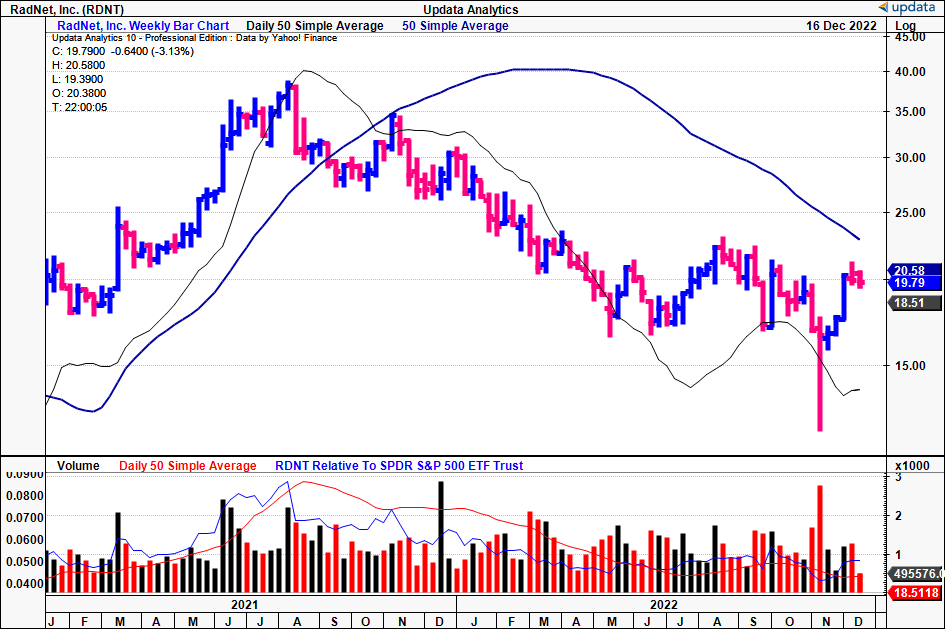
It comes as little surprise therefore that with the latest price action we now have new upside targets to $32.50 on our point and figure studies. The stock still has a number of inner and outer resistance lines to break through before getting there, however, it is currently testing these levels. Our furthest price objective at this point is therefore $32.50.
Exhibit 3. Upside targets to $32.50
Data: Updata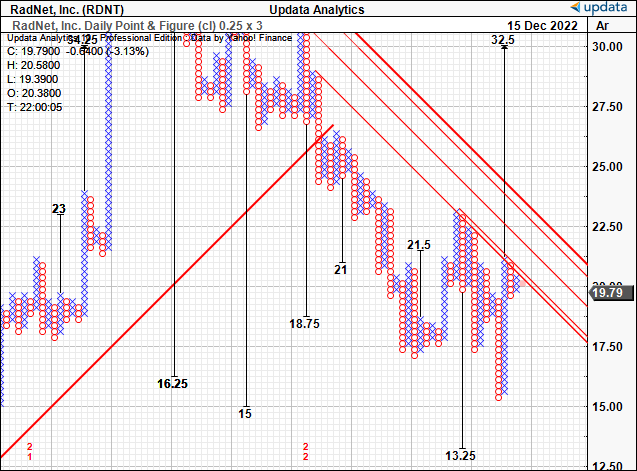
Valuation and conclusion
It’s absolutely worth pointing out that consensus sees tremendous upside for the stock looking ahead, pricing it at 80.8x forward GAAP EPS.
With non-GAAP EPS estimates of $0.19, we are ahead of this multiple by a large factor and price RDNT at 141x forward EPS. We arrive at this number via FY22 sales estimates of ~$348mm and adjusted EBITDA of $54.5mm, pulling down to a Q4 FY22 non-GAAP EPS assumption of $0.10 – well ahead of FY22 consensus non-GAAP of $0.07 [note: for FY22, Q1, Q2 and Q3 adjusted EPS was -$0.15, $0.15, $0.09 respectively =$0.09. Hence, with our Q4 estimate of $0.10 =$0.19]. This inevitably values the stock at $26.86, or ~35% upside potential from the current market price.
Exhibit 4. Fair forward valuation of $26.85. Our Q4 FY22 non-GAAP EPS estimate of $0.10 pushes the FY22 assumption to $0.19.
Note: All estimations are in non-GAAP/adjusted terms.
Note: Fair forward price-earnings multiple calculated as 1/fair cost of equity. This is known as the ‘steady state’ P/E. For more and literature see: [M. Mauboussin, D. Callahan, (2014): What Does a Price-Earnings Multiple Mean? An Analytical Bridge between P/Es and Solid Economics, Credit Suisse Global Financial Strategies, January 29 2014]. In addition, for RDNT in FY22, Q1, Q2 and Q3 adjusted EPS was -$0.15, $0.15, $0.09 respectively =$0.09. Hence, with our Q4 estimate of $0.10 =$0.19 (Data: HBI Estimates)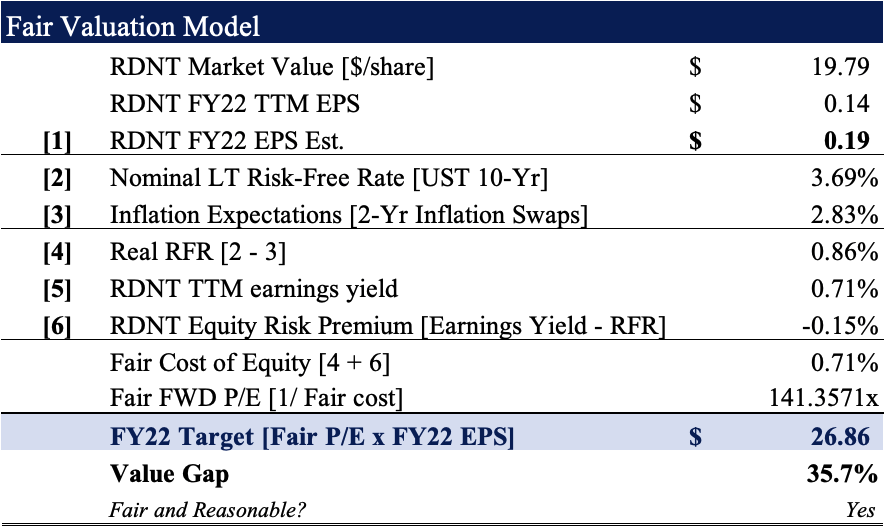
Net-net, we continue to believe RDNT will unlock shareholder value into the future. Both procedural and imaging growth percentages remain a takeout, and valuations are supportive as well. We are seeking price objectives of $26.85 then $32.50. Rate buy.
Be the first to comment