

AutumnSkyPhotography
Introduction
QUALCOMM (NASDAQ:QCOM), a technology leader, specializing in semiconductor design and manufacturing and wireless telecommunications equipment, is well prepared to satisfy the sustainable growing demand of the market. One of the main growth drivers is the acceleration in the adoption of 5G technology, which represents an opportunity for the company to grow its revenues. Moreover, the location of Qualcomm’s manufacturing facilities is diversified, preserving the company’s productivity and efficiency as compared to its competitors, whose manufacturing facilities are clustered in East Asia.
Qualcomm ranks highly in our Factor-Based US Large Cap Equity ranking system. This article will explain the factors (quality, value, and momentum) that encouraged us to include the stock in our portfolio and why they may shape the stock’s performance in the medium term.
Segments Overview
The company derives its revenues from three reportable segments:
- QCT – Qualcomm CDMA Technologies (86% of Q3-2022 revenues)*: designs and manufactures integrated circuits and system software, with revenue from handsets, RF front-end, automotive, and IoT,
- QTL – Qualcomm Technology Licensing (13.9% of revenues): covers granting licenses and providing rights of using Qualcomm’s portfolio.
- QSI – Qualcomm Strategic Initiatives (0.1% of revenues): focuses on investments aimed at identifying new opportunities and assisting with designing and deploying new products and services.
*excluding reconciling item
The quarterly evolution of revenues for the core business segments is still growing at high growth rates despite the global inflationary pressure and supply chain disruptions. This growth can be attributed to the increased content consumption, which requires enhanced hardware capabilities.
Qualcomm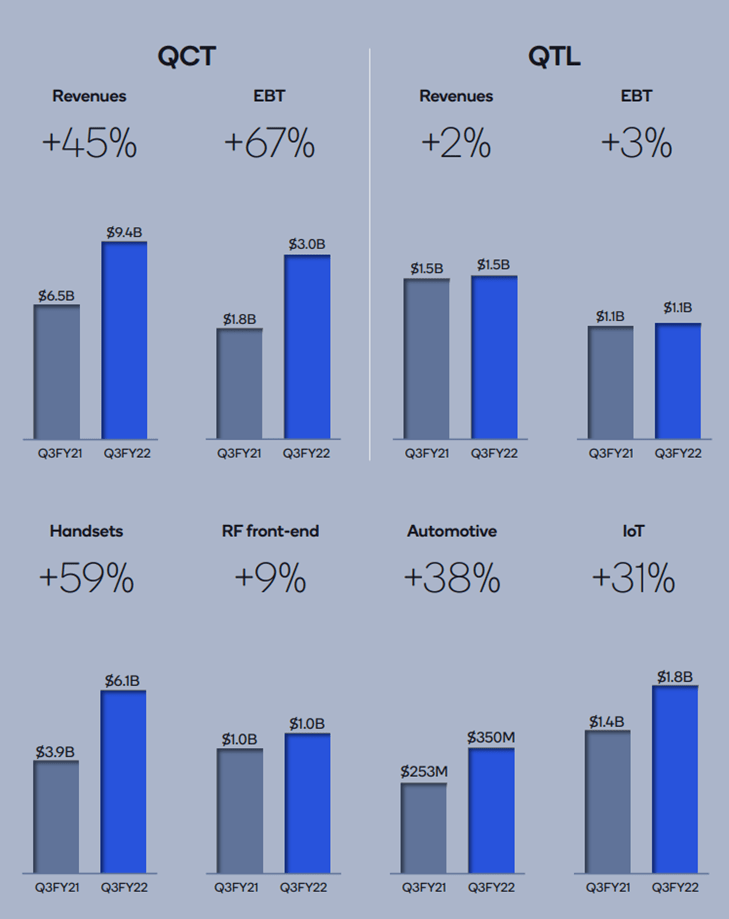
Strong fundamentals
Qualcomm established itself as a market leader while increasing its profit margins. Over the past years, the operating margin has increased from 16.7% in 2018 to 35.8%, indicating that management benefited from its earlier strategic investment in generating quality revenues.
When it comes to value returned to shareholders, the company’s dividend has been growing for the last 19 years, which, if annualized, provides a yield of 2.05% at current market prices.
Seeking Alpha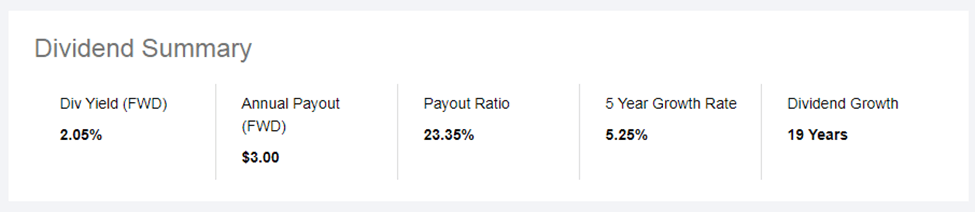
Additionally, the company is returning an additional value by continuously buying back its shares. Over the last three years, the company bought back an average of 694 million shares per quarter.
YCharts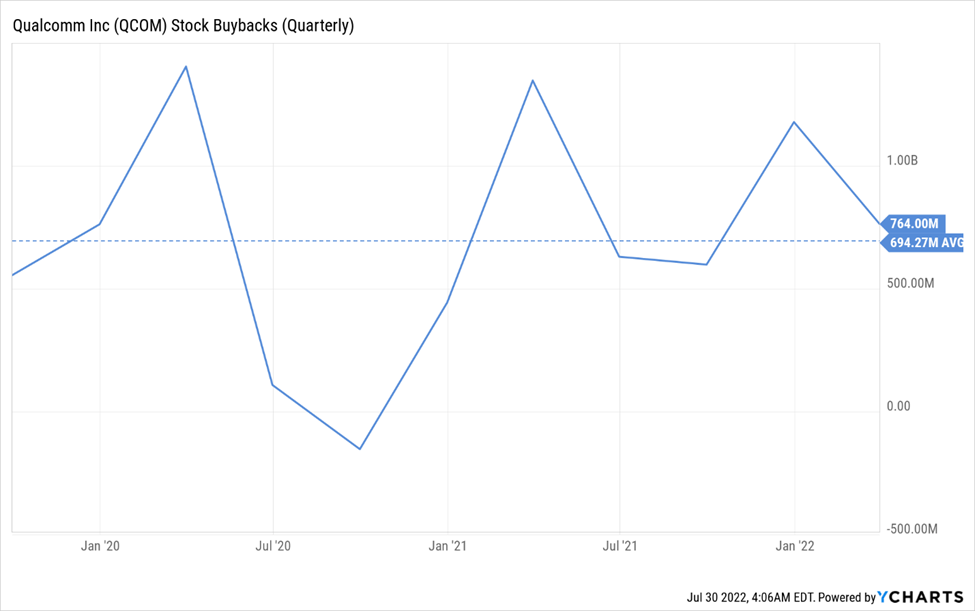
Qualcomm’s management expects a non-GAAP EPS of $12.55 for the fiscal year 2022, representing a $4 increase compared to last year. And for the fourth quarter, the mid-point is $3.15, a 6.4% quarterly increase on a sequential basis. Based on these assumptions, it is expected that Qualcomm will deliver exceptional yearly results.
For the upcoming period, Qualcomm announced that they have entered into a new multi-year agreement with Samsung that will begin in 2023. The deal is expected to boost the company’s revenues further as it relates to Samsung Galaxy smartphones, including PCs, tablets, extended reality, and more.
Competitive Advantage
Qualcomm has a promising growth outlook, so we’ll analyze its market positioning using the Porter Five Forces framework. This insight assists in evaluating the numerous external business factors that influence any company’s competitive environment.
Threat of New Entrants (Low)
Existing players in the semiconductor industry, including Qualcomm, Broadcom (AVGO), Advanced Micro Devices (AMD), and others, have been aggressively spending on R&D, and PPE, particularly on software development and hardware innovation to design and manufacture their products. Thus, it is not easy for new companies to enter and compete. Only very large corporations willing to take a very high risk can survive.
Threat of Substitutes (Low)
Although customers can substitute the products sold by Qualcomm, there is a relatively high switching cost for such a decision due to compatibility and dependence issues. Companies need to account for time and successful testing of substituted products. Furthermore, even if a customer is willing to accept the high cost, substitutes are not readily available due to the extreme shortage in the chip industry.
Bargaining Power of Customers (Moderate)
Currently, customers cannot easily substitute products, but we think they moderately impact Qualcomm’s growth outlook. For instance, only three customers contributed to almost half of the company’s revenues, which raises the impact of concentration risk.
Qualcomm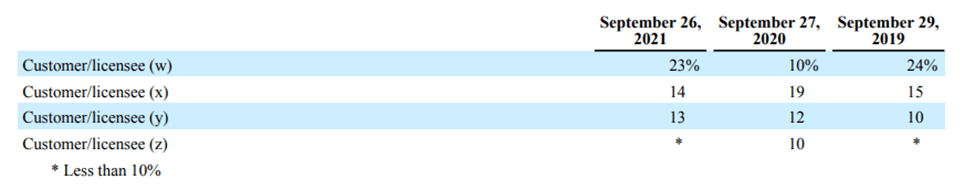
Bargaining Power of Suppliers (High)
Although many of the raw materials used by semiconductor companies are standardized, availability is the current major issue. Hence, suppliers can bargain as long as supply chain networks are disrupted. Moreover, as described in its annual report, Qualcomm depends on a limited number of third-party suppliers to procure, manufacture, assemble, and test its products, placing suppliers in an advantageous position.
Competitive Rivalry (High)
While there are few competitors like Intel (INTC) and Broadcom, all firms in the industry have extensively invested in their products and offerings, making it difficult for them to exit. Hence, they are aggressive regarding their market share and always looking for expansion opportunities or consolidating through M&A activity.
Rankings
Qualcomm ranks among the first decile stocks based on our multi-factor ranking system, so it is considered an attractive investment opportunity. It is currently included in our Factor-Based US Growth Equity Strategy with a grade of 98.1, as seen below.
|
Ranking (%) |
Quality (45%) |
Value (20%) |
Momentum (35%) |
|
98.1 |
90.6 |
90.4 |
84.2 |
Factor-Based
As displayed in the chart below, during 2019, Qualcomm showed a radical change in rank and was among the top decile of stocks in our universe. Since then, the stock price has been trending upwards consistently.
FactSet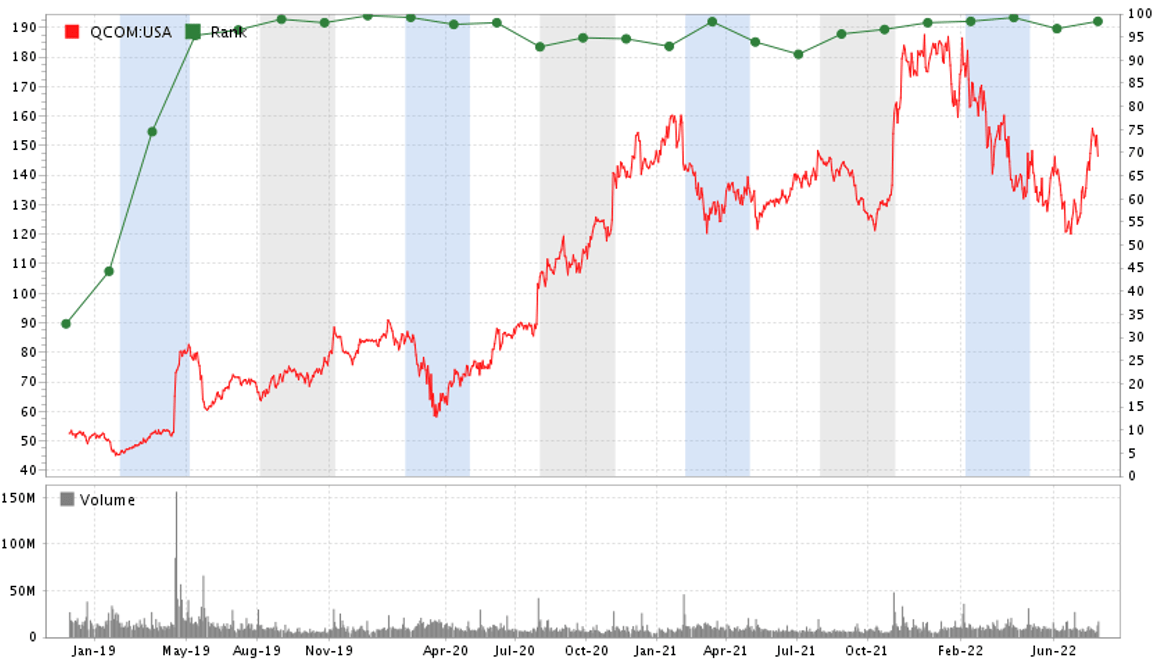
Our ranking approach is based on analyzing nine indicators spread across quality, value, and momentum factors. We allocate a weight for each factor, and the final rank is reached after normalizing it to a percentile. You can look at the whole ranking process described in the Factor-Based US Growth Equity Strategy presentation.
Now, let’s examine some of those factors and explain how they contributed to Qualcomm’s excellent ranking compared to its counterparts.
Quality
The twelve-month trailing ROE and the gross profitability metric are among our quality factors. Qualcomm’s ROE (TTM) has continuously increased and shifted from a negative figure in 2018 to reaching levels above 100% since early 2021 (107.54% currently). Furthermore, the ROE is higher than that of its main competitors, such as Broadcom Inc., Intel Corp., and Advanced Micro Devices Inc., which have ROE ratios of 38.09%, 27.14%, and 20.32%, respectively.
Likewise, gross profitability, calculated as Gross Profit / Total Assets, has improved considerably over the last few years, showing enhanced profitability, and is currently maintaining its upward trajectory.
FactSet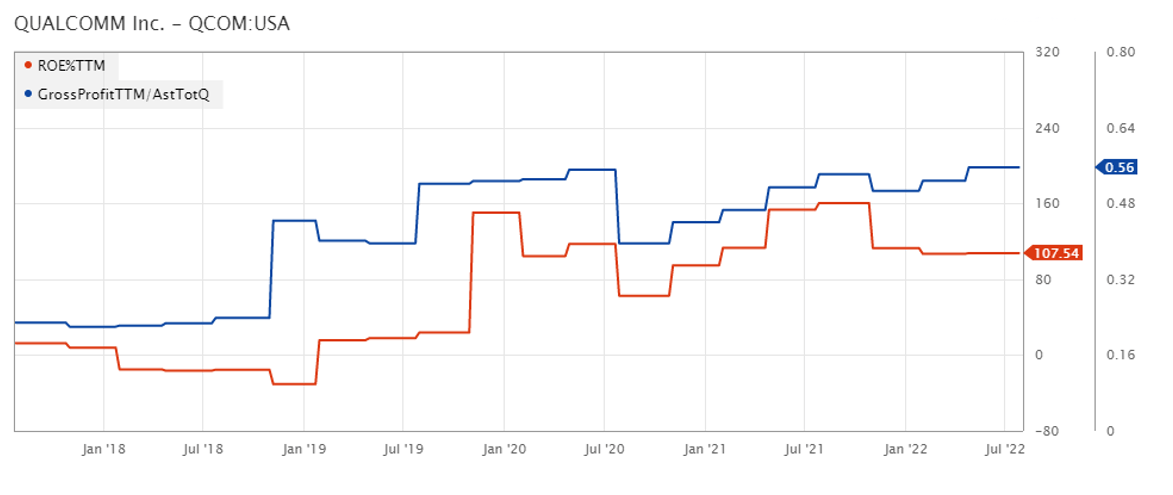
Value
Based on our back-testing, we found that assessing how much EBITDA the company generates for every unit of Enterprise Value (after adjusting for R&D) is a good value factor in identifying companies with greater profitability efficiency. Qualcomm’s ratio has increased sharply following the pandemic, as shown in the chart below.
FactSet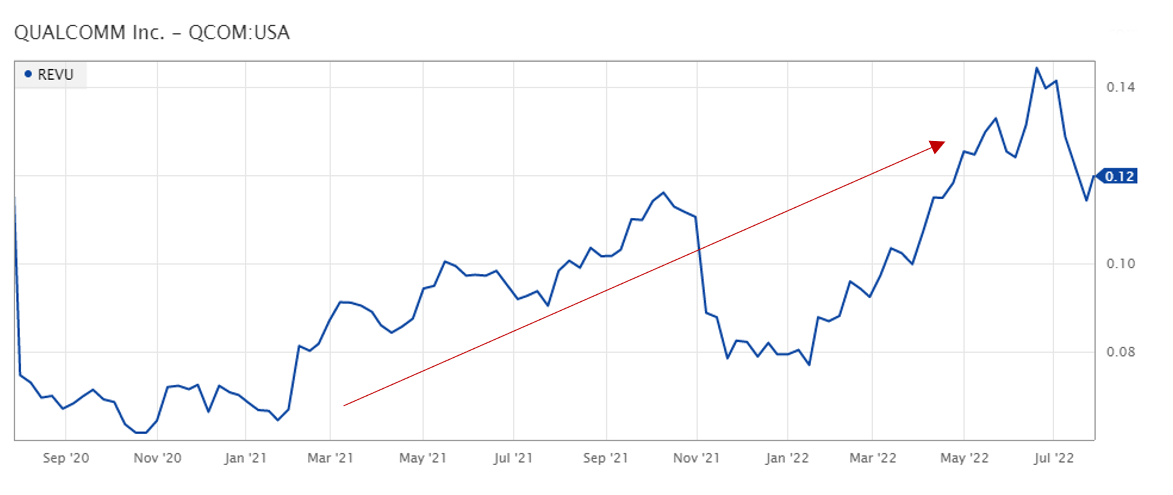
Momentum
As for momentum factors, one of the metrics used is the price slope, which helps identify medium-term upswings. Although this factor has decreased since the beginning of the year due to the market’s bearish sentiment, it currently indicates a potential upward trend. As shown in the below chart, the trend is showing reversing signs. This factor is determined by dividing the 63-Day VMA (Volume Weighted Moving Average) by the 252-Day VMA.
FactSet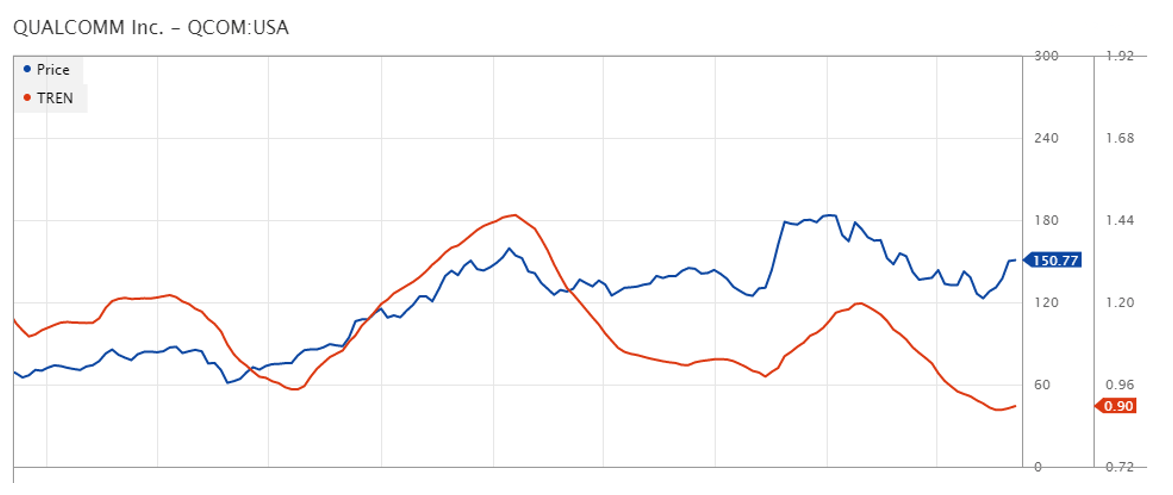
Qualcomm outperforms its rivals in the semiconductor industry when it comes to balancing quality and value. We plotted ROE (x-axis) versus REVU (y-axis), and as indicated in the chart below, Qualcomm has a reasonable valuation with good upside potential.
FactSet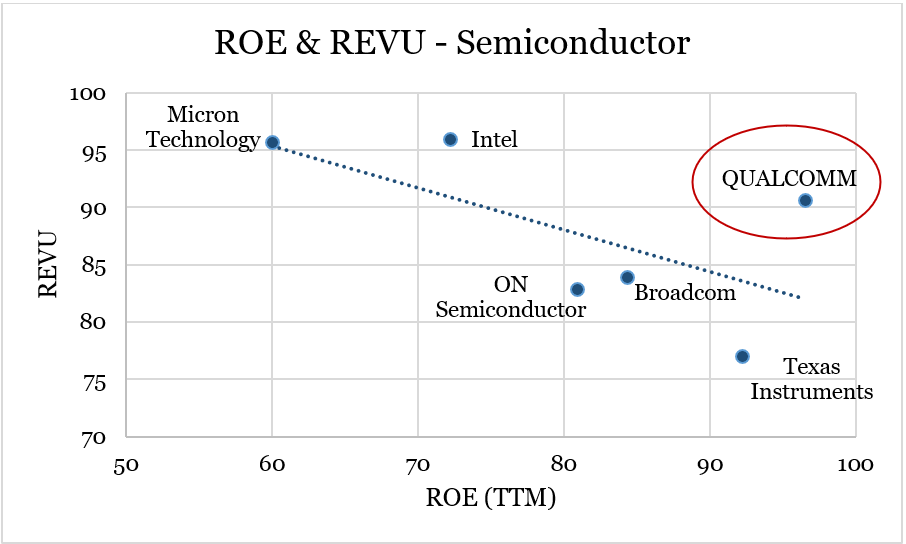
Investment Risks
Although Qualcomm has an attractive rank, its valuation and growth potential are vulnerable to various threats, of which we will mention a few:
- Recession risk: Due to the increasing interest rate environment coupled with other macroeconomic factors such as slowing economic activity, many analysts expect a recession by the end of 2022 or early 2023. Thus, demand for the company’s products such as integrated circuits and the revenue from royalties earned might decrease;
- International political relations, including trade protection policies or other governmental and regulatory actions, might limit or prevent the company from reaching its total potential growth in the future (trade war was a clear example);
- Continuous research & development: the company operates in a tech industry that is on a non-stop development cycle which justifies the need to allocate a large part of gross profit to R&D to maintain its competitive market positioning. However, the expenses incurred might not necessarily lead to additional revenue in the future.
Conclusion
Finally, Qualcomm’s business was resilient during highly volatile periods and proved less cyclical than other firms. Despite the high R&D required to maintain a competitive advantage, the current managerial strategy generated higher profit margins. The company is well-positioned to grow as a semiconductor leader given the current and long-term industry tailwinds driven by 5G, IoT, and the metaverse.
Furthermore, QCOM has a strong combination of quality, value, and momentum factors in our Large Cap US Equity universe, making it a good growth-at-a-reasonable-price [GARP] investment opportunity.
Be the first to comment