

shapecharge/iStock via Getty Images
Wall Street analysts are too bullish on first quarter earnings expectations for most S&P 500 companies. At 79%, the percent of S&P 500 companies whose Street EPS exceed our Core EPS remains near record highs.
This report shows:
- the prevalence and magnitude of overstated Street Earnings[1] in the S&P 500
- five S&P 500 companies with overstated Street estimates likely to miss 1Q22 earnings
Street Overstates EPS for 336 S&P 500 Companies
336 companies with overstated Street Earnings make up 79% of the S&P 500’s market cap as of 3/11/22, which is the fifth-highest percent since 2012 (earliest data available), measured with TTM data in each quarter. Figure 1 shows that 79%, by market cap, of the S&P 500 has overstated Street Earnings for most of the last two years.
Figure 1: Overstated Street Earnings as % of Market Cap: 2012 through 3/11/22
Overstated Street Earnings as % of S&P 500 Market Cap (New Constructs, LLC)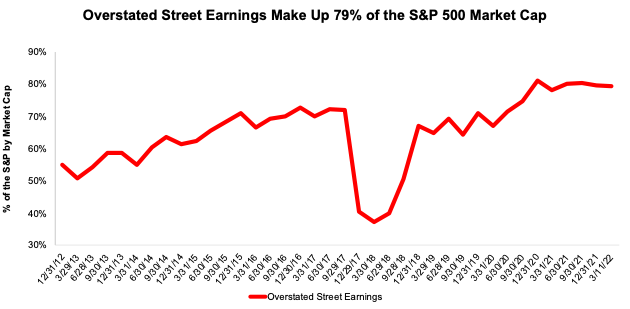
In the TTM ended 3Q21 and 2020 as a whole, Wall Street analysts overstated earnings for 360 companies and 351 companies, respectively. On average, Street Earnings overstate Core Earnings by 21% per company. See Figure 2. For over a third of S&P 500 companies, Street Earnings overstate Core Earnings by >10%.
Figure 2: Street Earnings Overstated by 21% on Average in 2021[2]
Overstated Street Earnings in the S&P 500 (New Constructs, LLC)
Five S&P 500 Companies Likely to Miss Calendar 1Q22 Earnings
Figure 3 shows five S&P 500 companies likely to miss calendar 1Q22 earnings based on overstated Street EPS estimates. Below we detail the hidden and reported unusual items that caused Street Distortion and overstated Street Earnings in 2021 for Invesco Ltd. (IVZ) and Amazon.com (AMZN).
Figure 3: Five S&P 500 Companies Likely to Miss 1Q22 EPS Estimates
S&P 500 Companies Likely to Miss Earnings (New Constructs, LLC)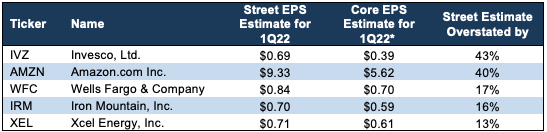
*Assumes Street Distortion as a percent of Core EPS is same for 1Q22 EPS as for calendar year ended 2021.
Invesco Ltd: The Street Overstates Earnings for 1Q22 by $0.30/share
The Street’s 1Q22 EPS estimate of $0.69/share for Invesco Ltd. is overstated by $0.30/share due, at least in part, to gains on investments in consolidated investments product (CIP) included in historical Street EPS. Based on how much the Street EPS estimate exceeds our Core EPS of $0.39/share, we consider Invesco as one of the S&P 500 companies most likely to miss Wall Street’s expectations. Invesco’s Earnings Distortion Score is Strong Miss and its Stock Rating is Neutral.
Unusual gains, which we detail below, materially increased Invesco’s 2021 Street and GAAP earnings and makes profits look better than Core EPS. When we adjust for all unusual items, we find that Invesco’s 2021 Core EPS are $1.76/share, which is worse than 2021 Street EPS of $3.09/share and 2021 GAAP EPS of $2.99/share.
Figure 4: Comparing Invesco’s GAAP, Street, and Core Earnings: 2021
IVZ GAAP vs. Street Vs. Core Earnings (New Constructs, LLC)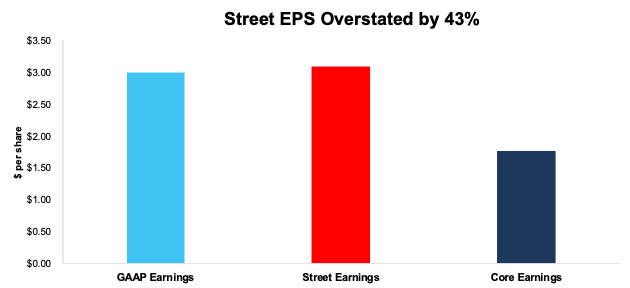
Below, we detail the differences between Core Earnings and GAAP Earnings so readers can audit our research. We would be happy to reconcile our Core Earnings with Street Earnings but cannot because we do not have the details on how analysts calculate their Street Earnings.
Figure 5 details the differences between Invesco’s Core Earnings and GAAP Earnings.
Figure 5: Invesco’s GAAP Earnings to Core Earnings Reconciliation: 2021
IVZ Core to GAAP Earnings Reconciliation (New Constructs, LLC)
More details:
Total Earnings Distortion of $1.23/share, which equals $573 million, is comprised of the following:
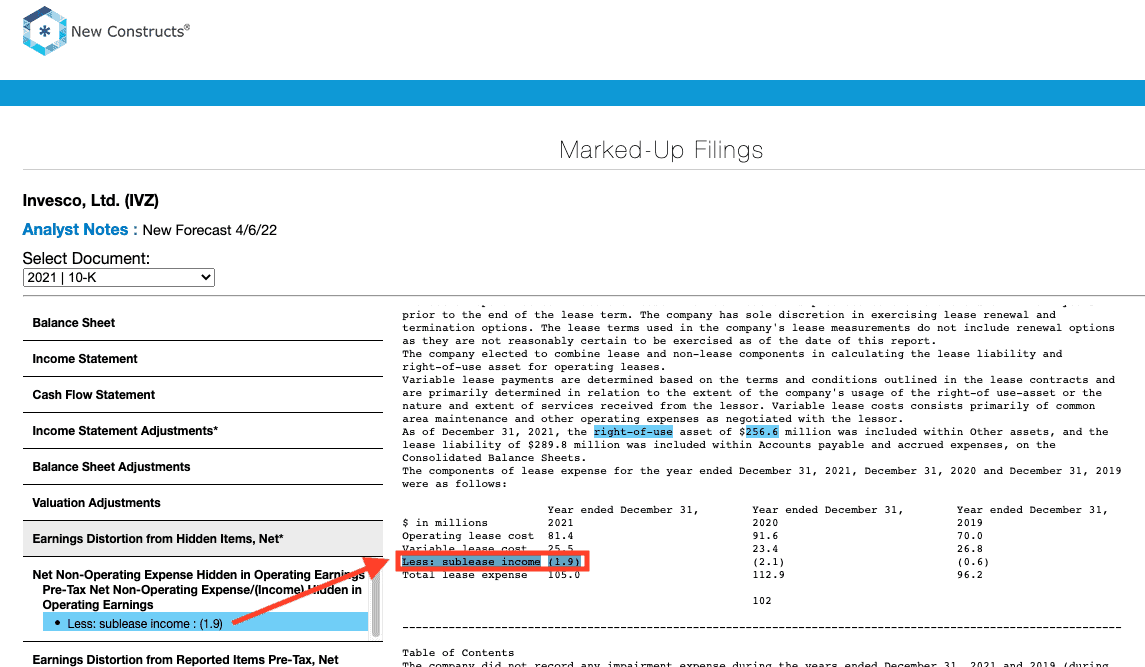
Hidden Unusual Gains, Net = <$0.01/per share, which equals $2 million and is comprised of
- $2 million in sublease income – page 102
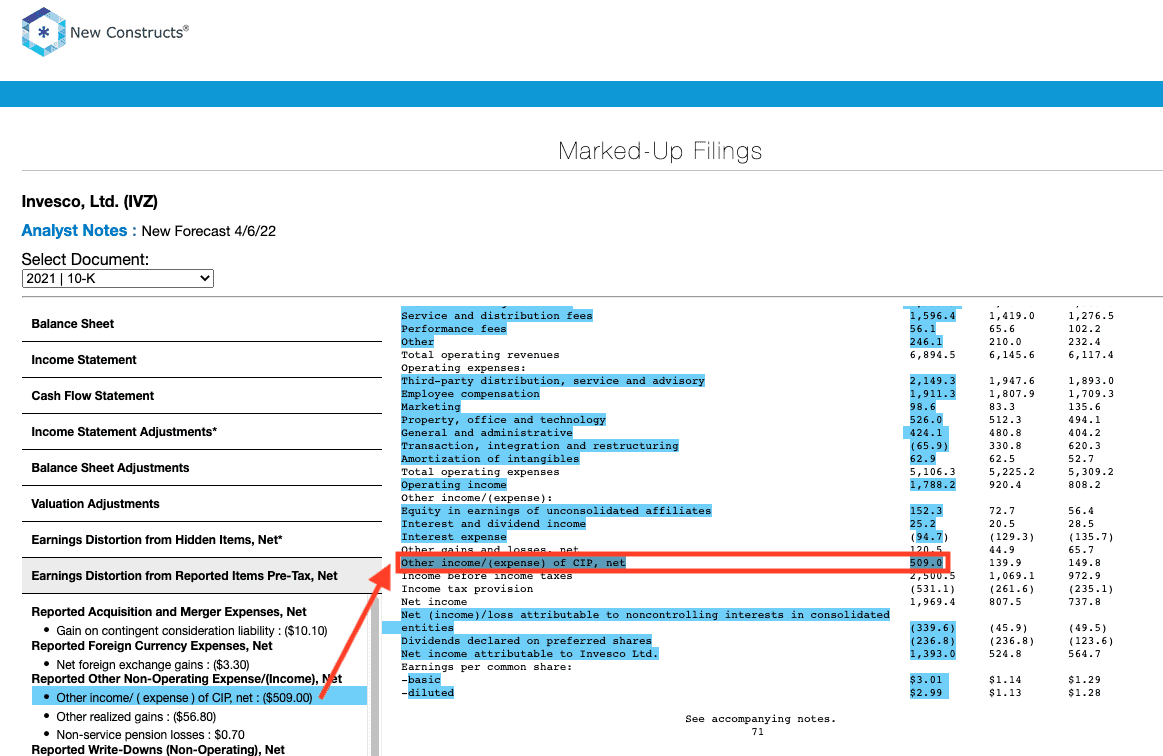
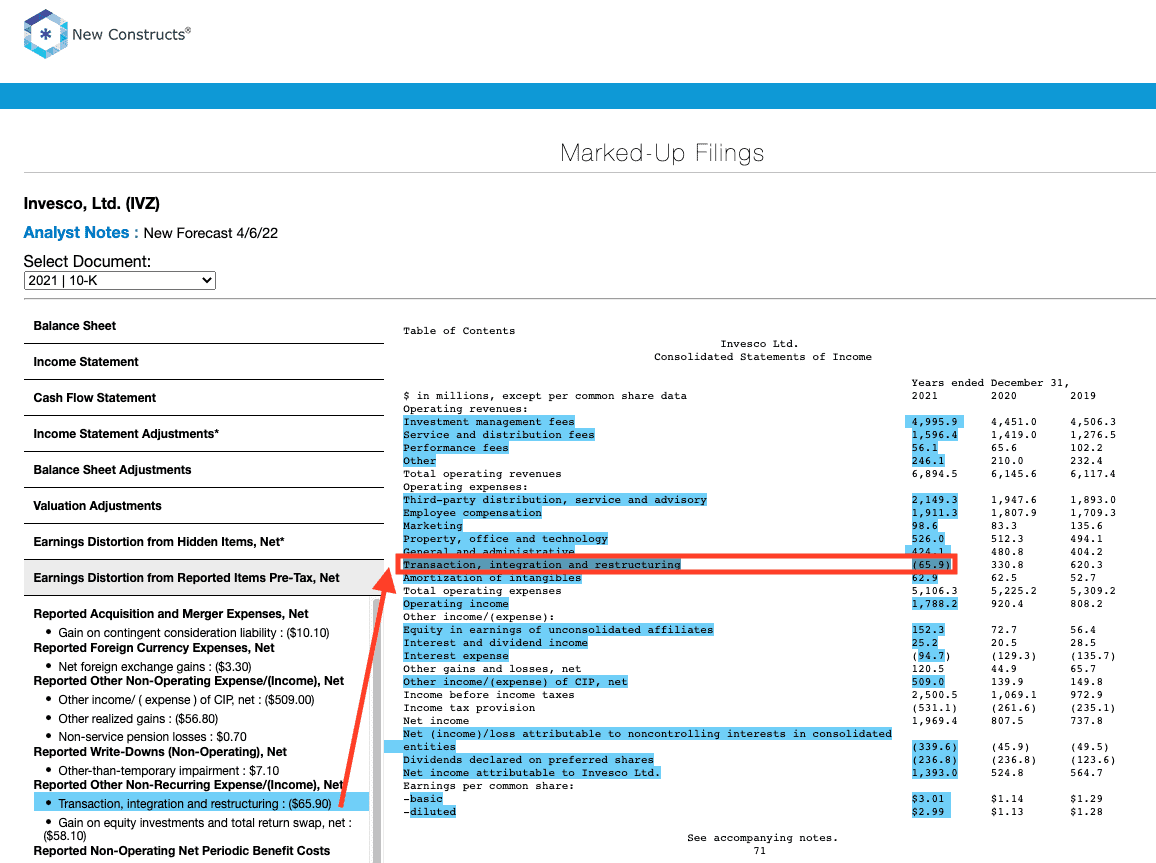
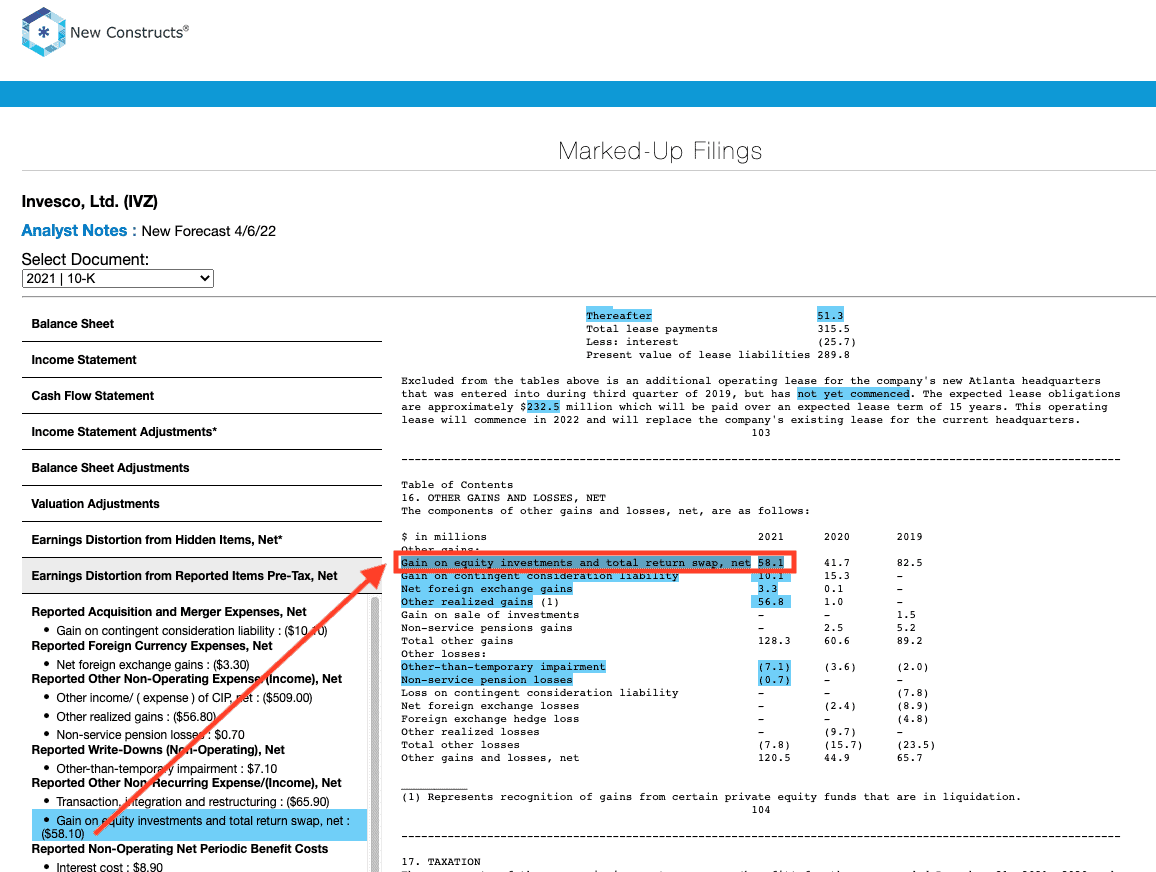
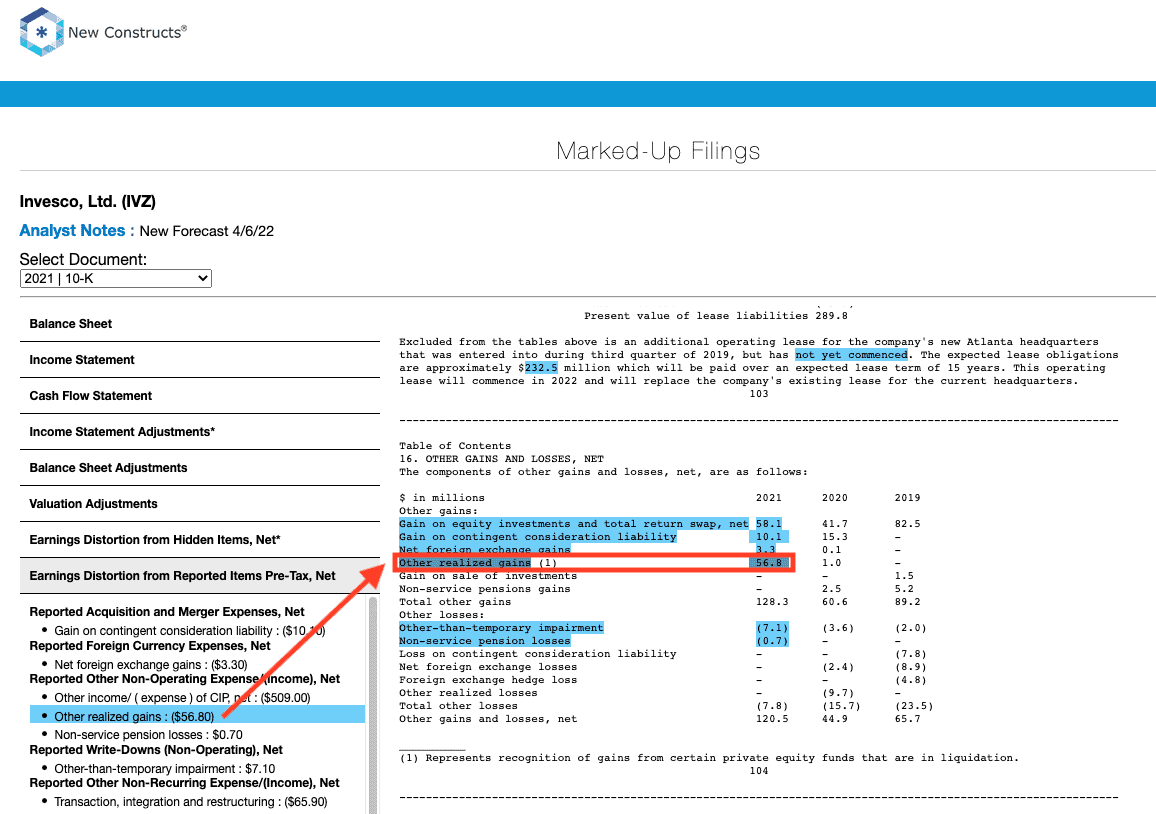
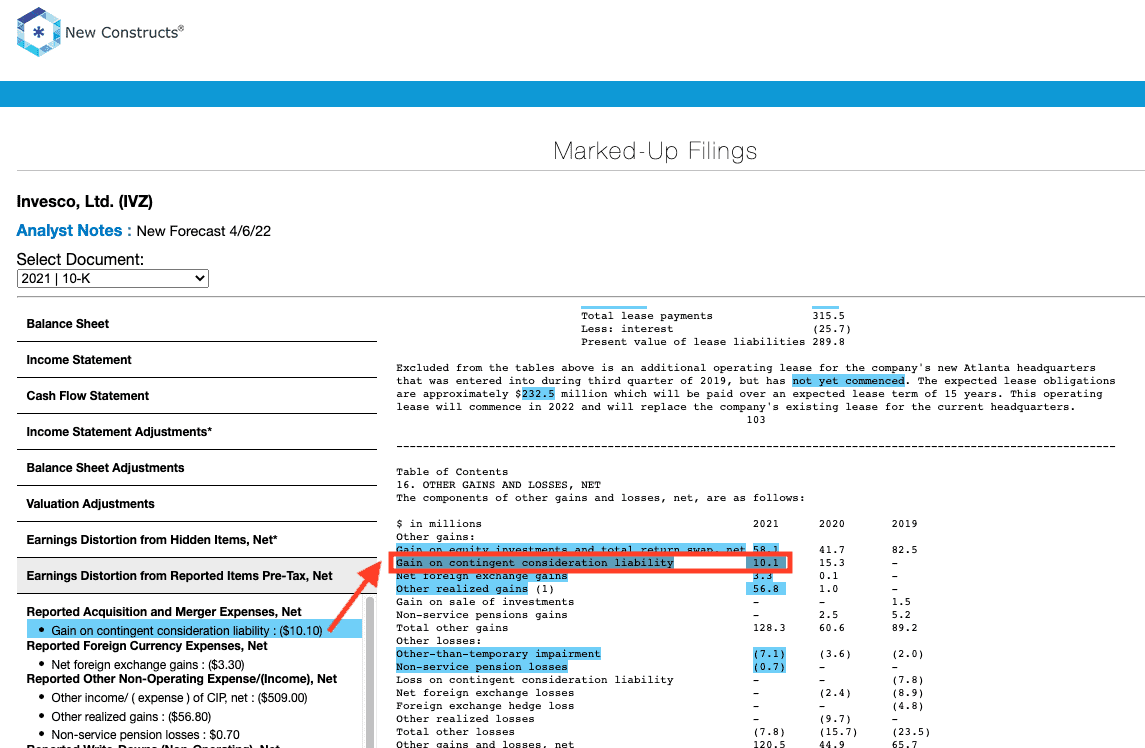
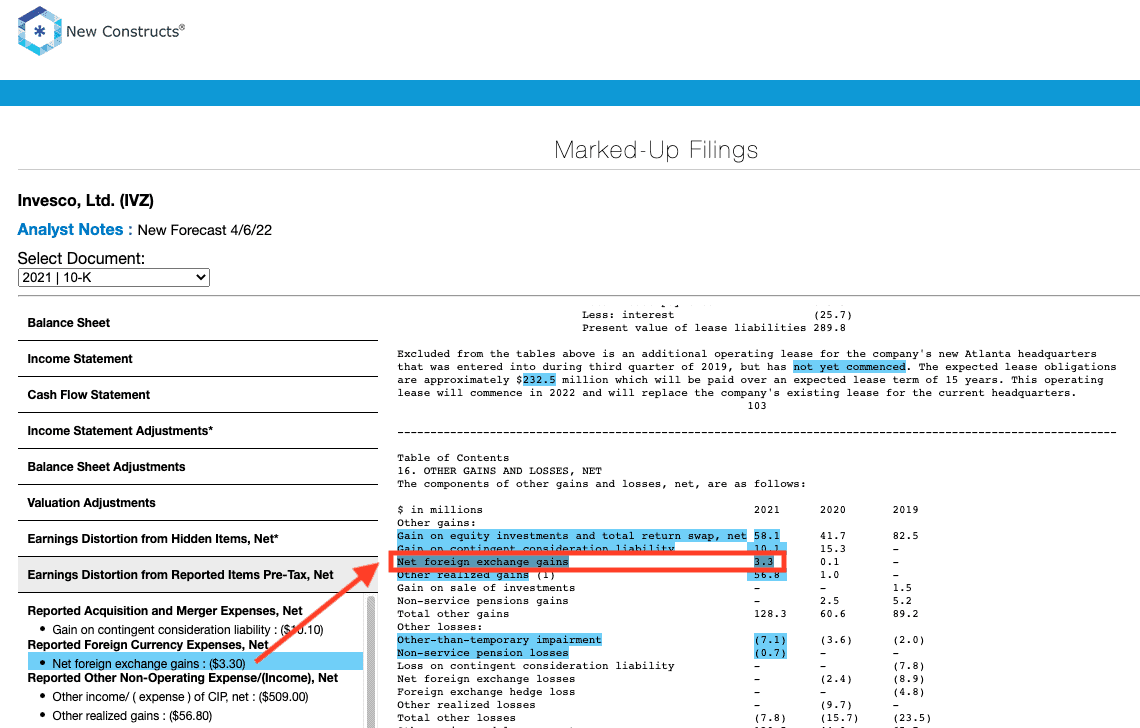
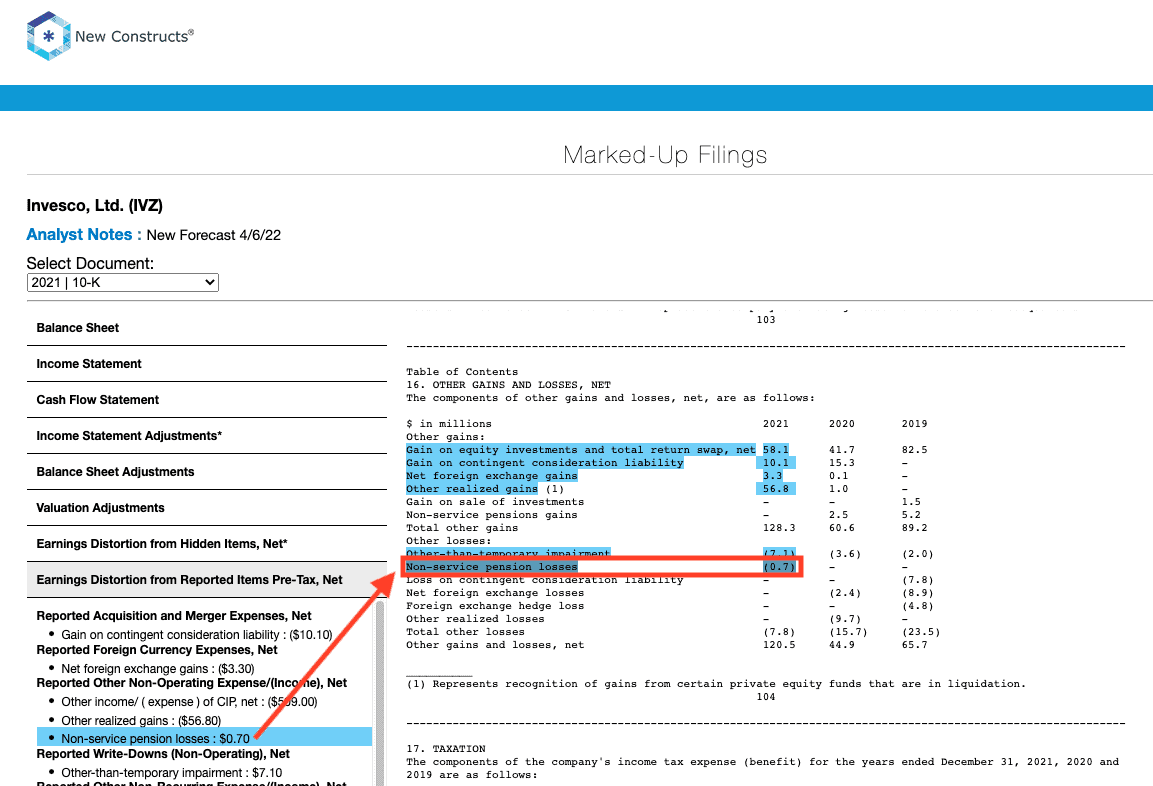
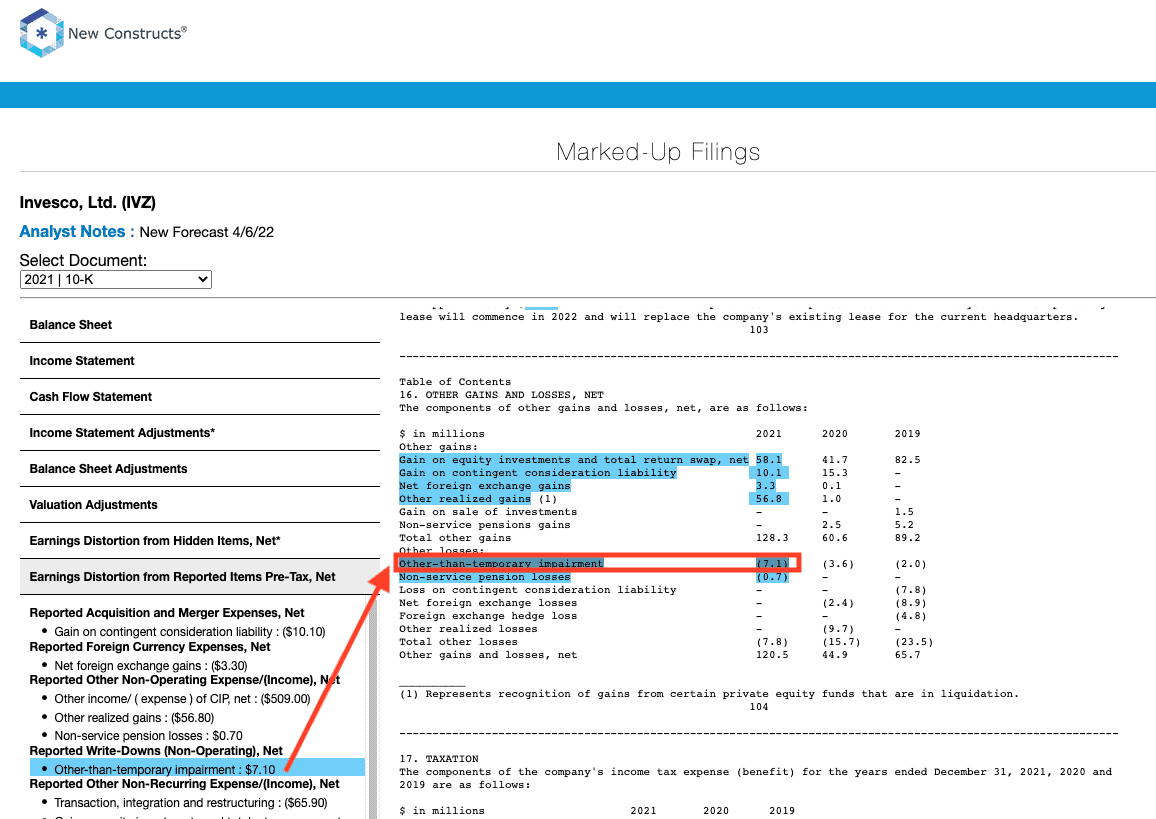
Reported Unusual Gains, Net = $1.48/per share, which equals $690 million and is comprised of
- $509 million in other income of CIP
- $66 million in transaction, integration, and restructuring benefits
- $58 million gain on equity investments and total return swap, net
- $57 million in “other realized gains”
- $10 million gain on contingent consideration liability
- $3 million net foreign exchange gains
- -$1 million in non-service pension losses
- -$5 million contra adjustment for recurring pension costs. These recurring expenses are reported in non-recurring line items, so we add them back and exclude them from Earnings Distortion.
- -$7 million in “other-than-temporary impairment” charges
Tax Distortion = -$0.26/per share, which equals -$119 million
Given the similarities between Street Earnings and GAAP Earnings for Invesco, our research shows both Street and GAAP earnings fail to capture significant unusual items both hidden and reported directly on Invesco’s income statement.
Amazon.com Inc: The Street Overstates Earnings for 1Q22 by $3.71/share
Amazon.com, Inc. discloses unusual income directly on the income statement, which should make it easy for analysts to remove them from their estimates. However, the disconnect between Street Earnings and Core Earnings reveals the former misses even this straightforward adjustment.
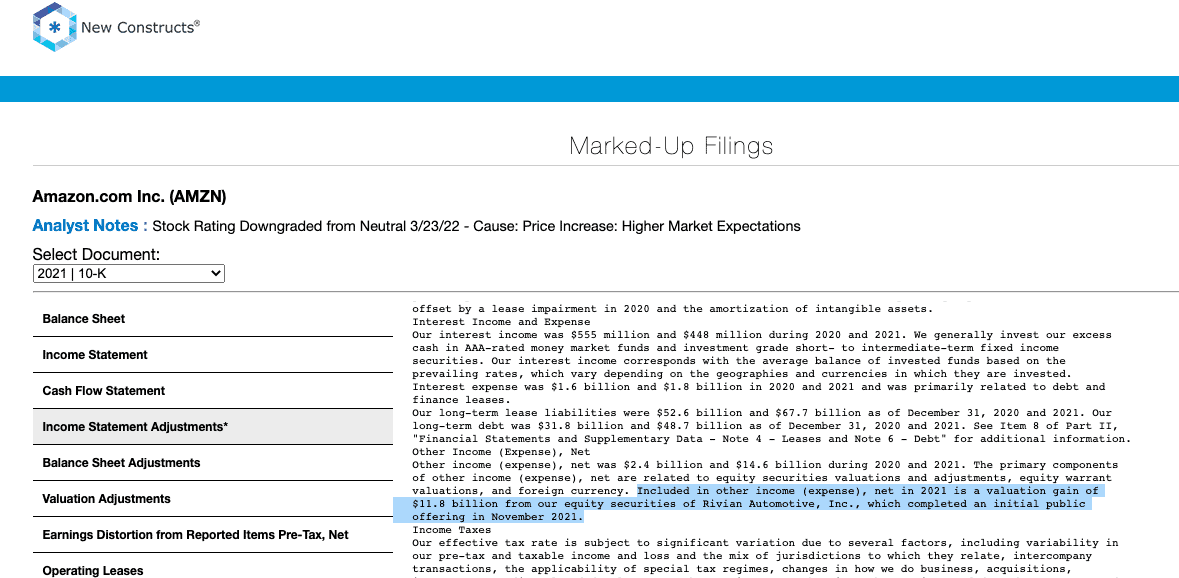
The Street’s 1Q22 EPS estimate of $9.33/share for Amazon.com is overstated by $3.71/share largely due to a securities valuation gain related to Rivian’s 2021 IPO that is included in historical Street EPS.
Based on how much the Street EPS estimate exceeds our Core EPS estimate of $5.62/share, we consider Amazon as one of the S&P 500 companies most likely to miss Wall Street analyst’s expectations in its 1Q22 earnings report. Amazon’s Earnings Distortion Score is Strong Miss and its Stock Rating is Unattractive.
Unusual gains, which we detail below, materially increased Amazon’s 2021 Street and GAAP earnings and makes profits look better than Core EPS. When we adjust for all unusual items, we find that Amazon’s 2021 Core EPS are $39.05/share, which is worse than 2021 Street EPS and GAAP EPS of $64.78/share.
Figure 6: Comparing Amazon’ GAAP, Street, and Core Earnings: 2021
AMZN GAAP vs. Street vs. Core Earnings (New Constructs, LLC)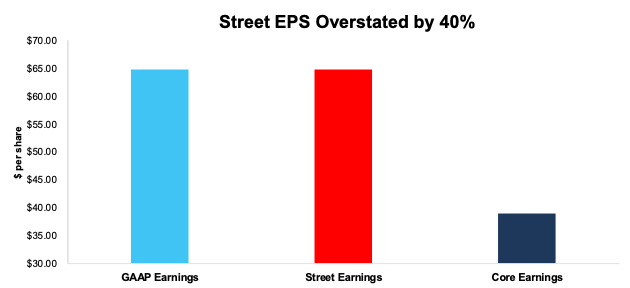
Below, we detail the differences between Core Earnings and GAAP Earnings so readers can audit our research. We would be happy to reconcile our Core Earnings with Street Earnings but cannot because we do not have the details on how analysts calculate their Street Earnings.
Figure 7 details the differences between Amazon’s Core Earnings and GAAP Earnings.
Figure 7: Amazon’s GAAP Earnings to Core Earnings Reconciliation: 2021
AMZN Core to GAAP Earnings Reconciliation (New Constructs, LLC)
More details:
Total Earnings Distortion of $25.73/share, which equals $13.3 billion, is comprised of the following:
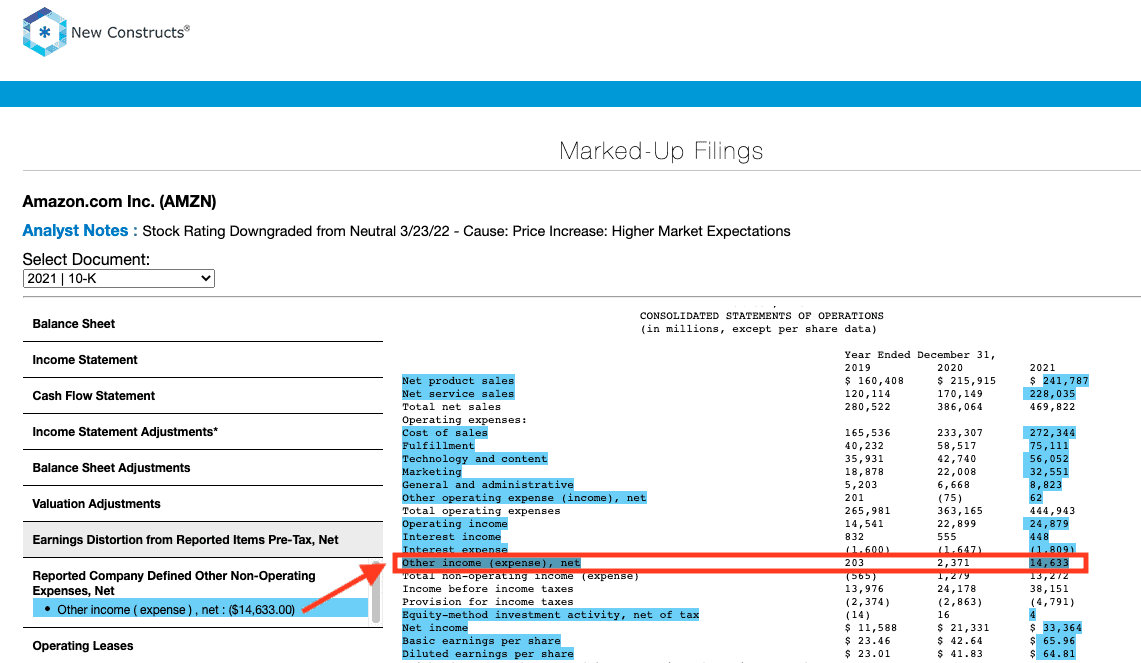
Reported Unusual Gains, Net = $28.41/per share, which equals $14.6 billion and is comprised of
- $14.6 billion in “other income” reported on the income statement
Tax Distortion = -$2.68/per share, which equals -$1.4 billion
Amazon’s “other income” was reported directly on the income statement, so analysts should be able to easily identify such an unusual gain. Furthermore, on page 27 of its 2021 10-K, in the MD&A, management provides additional disclosure that Other Income includes an $11.8 billion gain related its equity stake in Rivian Automotive (RIVN), which went public in 2021.
Given the similarities between Street Earnings and GAAP Earnings for Amazon, our research shows Street and GAAP earnings both fail to capture unusual items reported directly on Amazon’s income statement and therefore give a misleading picture of the firm’s profitability.
This article originally published on April 8, 2022.
Disclosure: David Trainer, Kyle Guske II, and Matt Shuler receive no compensation to write about any specific stock, style, or theme.
[1] Street Earnings refer to Zacks Earnings, which are reported to be adjusted to remove non-recurring items using standardized assumptions from the sell-side.
[2] Average overstated % is calculated as Street Distortion, which is the difference between Street Earnings and Core Earnings.
Be the first to comment