

Passakorn Prothien/iStock via Getty Images
The case for an enduring value cycle remains strong despite the market sell-off on recession fears.
With inflation climbing ever higher and GDP growth tepid in some regions and negative in others, investor fears have been rising, leading to increased market volatility. During periods such as these, we look to history, which has proven that timing equity allocations is incredibly difficult. A review of history also shows us that periods of fear and uncertainty create opportunities. Our data indicates that the value cycle has plenty of room to run, as value stocks remain historically cheap.
MARKET TIMING IS TOUGH
Global stock markets traded into bear market territory in the second quarter as investors grappled with recessionary fears. These fears are understandable; after all, the average peak-to-trough US equity market drawdown surrounding the 15 recessions over the last century is 28%. Value stocks lost 35%, on average (Exhibit 1). Indeed, if one could both accurately predict and time a recession, significant alpha could be added by reducing equity allocations during periods leading up to, and in the early stages of recessions, when the bulk of the negative performance occurs.
Unfortunately, it is difficult to anticipate the timing of market peaks and troughs around recessions. An investor who times equity allocations must broadly get both their exit and re-entry points right, or risk impairing performance. This is particularly difficult during recessionary periods because the official declaration of one comes at some point during the economic downturn itself, if not after.
At that point, which is near the level of maximum pessimism, it pays to already be invested in stocks, which generate a positive 3% return, on average, in the one-year period following the start of a recession; the value cohort returns positive 5%, on average. Longer term, from the official start date of a recession, the market has, on average, generated solid returns, led by value stocks.
Exhibit 1: The Market vs. Value Around Recessions
| Average Cumulative Return | Market | Value |
|
Peak-to-Trough |
-28% |
-35% |
|
1Y From Recession Start |
3% |
5% |
|
5Y From Recession Start |
53% |
91% |
Source: Federal Reserve Bank of St. Louis, Kenneth R. French, Pzena analysis. Chart is based on 15 US recessions from 1929 – 2020. The US universe is all NYSE, AMEX, and NASDAQ stocks defined by Kenneth R. French data library and excludes the smallest 30% of the universe based on aggregate market capitalization to remove the small cap effect. Value (equally weighted US dollar returns) is defined as the cheapest quintile of stocks on a price-to-book basis. Past performance is not indicative of future returns. Returns could be reduced, or losses incurred, due to currency fluctuations. Does not represent any specific Pzena product or service.
The two most recent recessions highlight the difficulty in timing re-entry points. Assume an investor was lucky enough to have lowered their equity allocation prior to the Global Financial Crisis. How comfortable would they have been reversing course at the depths of despair in March 2009, before there was any clarity on how the crisis would be resolved? From that point, the market rose 51% through the remainder of 2009, closing the year up 23% in a period where the viability of the entire financial system seemed in doubt.
Even more recently, suppose in late 2019 an investor reduced their equity allocation, correctly predicting the world would essentially lock down due to COVID and the markets would sell off sharply. Would they have the fortitude and foresight to turn bullish when stocks dropped by a third in about a month? After all, COVID was just declared a global pandemic and the lockdowns had no end in sight. Two months later the market was 40% higher, and by year-end it was 65% above its lows, up 16% in a year that GDP suffered its steepest and fastest decline in history.
THE VALUE OPPORTUNITY
Instead of concentrating on market timing, which we believe is extremely difficult, we focus on the value opportunity. As the pro-value cycle approaches its two-year anniversary, we continue to receive queries from our clients asking how much opportunity remains in value.
The extreme performance disparity between cheap and expensive stocks in the period leading up to the depths of COVID is what precipitated one of the most attractive relative opportunities for value on record. During this pro-growth stock period, expensive stocks could do no wrong, growing earnings significantly faster than the market while cheap stocks, more levered to the physical economy, struggled. Expensive stocks also expanded their multiples significantly, leading to an overall 109 percentage point performance advantage (see Exhibit 2).
Exhibit 2: Value vs Growth Performance Drivers (Dec. 31, 2016 – Aug. 31, 2020)
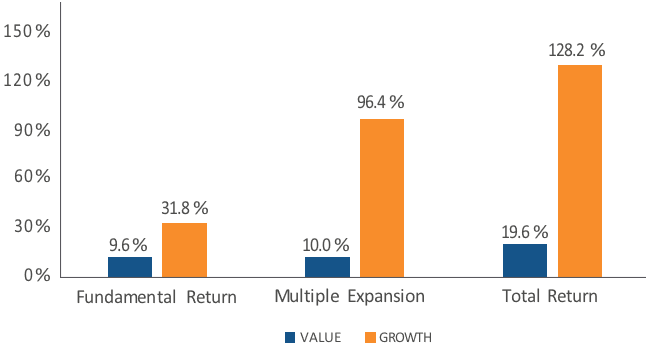
Source: FactSet, Pzena analysis. Value = Russell 1000 Value Index. Growth = Russell 1000 Growth Index. Fundamental Return = Dividend return + EPS growth. EPS growth is calculated using forward 12-month consensus estimates per FactSet for both starting and ending dates. All data cumulative in US dollars. Past performance is not indicative of future returns. Returns could be reduced, or losses incurred, due to currency fluctuations.
In the autumn of 2020, positive vaccine news provided visibility to an end to COVID lockdowns. Around this time, in November, cheap stocks started outperforming, both driven by faster earnings growth as they recovered, and multiple expansion. Looking at the longer period, since the end of 2016, expensive stocks have outperformed cheap stocks by 74 percentage points, leaving significant ground for cheap stocks to make up (see Exhibit 3).
Exhibit 3: Value vs Growth Performance Drivers (Dec. 31, 2016 – Jun. 30, 2022)
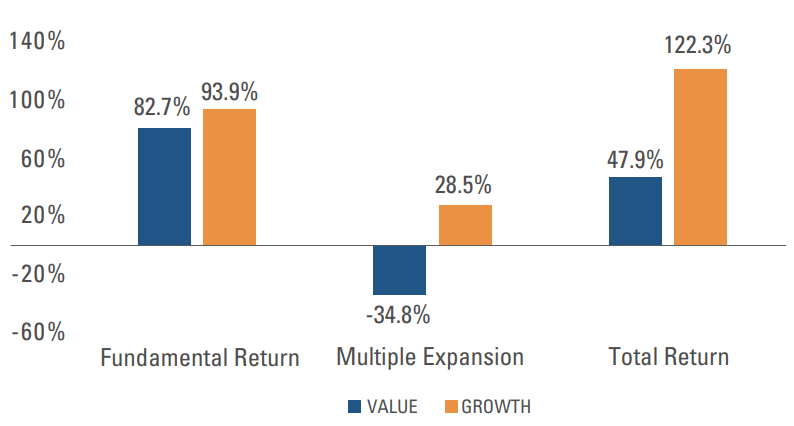
Source: FactSet, Pzena analysis. Value = Russell 1000 Value Index. Growth = Russell 1000 Growth Index. Fundamental Return = Dividend return + EPS growth. EPS growth is calculated using forward 12-month consensus estimates per FactSet for both starting and ending dates. All data cumulative in US dollars. Past performance is not indicative of future returns. Returns could be reduced, or losses incurred, due to currency fluctuations.
The late John Bogle, founder of The Vanguard Group, suggested a framework for breaking stock market returns into two pieces: fundamental return, the return from dividends and earnings, and speculative return, the return from the change in multiples.
Using this framework, 85% of expensive stocks’ return advantage over the past five and a half years has come from the speculative expansion of multiples, versus the multiple compression of value stocks. It is important to remember that extreme multiple expansion has never been a reliable and sustainable contributor to long-term performance, accounting for less than 10% of historical market gains.
The wide valuation disparity has left cheap stocks extremely attractive relative to expensive stocks. Despite value outperforming the market by 48% in the US since the value cycle turned, the ratio between the cheapest and most expensive stocks remains near historical highs on a price-to-earnings basis, or more than twice the 71-year average (Exhibit 4). That ratio has been wider just 3% of the time over the history of the data.
Exhibit 4: Cheap Stocks Remain Attractive
|
PE Today* |
71 year average |
% of time cheaper/wider |
|||||
|
Cheap |
5.1x |
7.9x |
10% |
||||
|
Expensive |
47.5x |
35.8x |
78% |
||||
|
Ratio |
9.2x |
4.5x |
3% |
Source: FactSet, Kenneth R. French, Pzena analysis. P/E ratios for the most expensive and cheapest quintiles of the US market based on price/earnings. 71Year Average is annual December data from 1950 – 2020. Universe is all NYSE, AMEX, and NASDAQ stocks defined by Kenneth R. French data library. *Based on Russell 3000 Index data as of June 30, 2022 as Kenneth R. French data was only available through December 31, 2020 at the time of analysis.
The valuation disparity is largely driven by expensive stocks, which, despite selling off this year, remain richly valued by historical standards at 47x earnings. Meanwhile, cheap stocks are trading at the low end of the typical 5–10x range observed over the past 71 years. This presents disciplined value investors with a compelling opportunity to rotate out of the stocks that have provided the outperformance of the past several quarters, and into a diverse new set of bargain names.
CONCLUSION
While recession fears are understandable, timing market peaks and valleys is extremely difficult and more likely to cost performance than add to it. Indeed, with reported GDP growth turning negative in some regions and markets already down sharply in anticipation of the next recession, it calls into question the risk/reward of maintaining a lower equity allocation at this point, since it has historically represented a good time to invest in the market, and a particularly good time for value stocks.
With the opportunity set we see in value stocks, we believe the runway for a long and enduring value cycle remains intact.
Editor’s Note: The summary bullets for this article were chosen by Seeking Alpha editors.
Be the first to comment